
$1,349,000
Investment Summary
We noticed that property taxes are missing—this is a standard expense and should be considered in your estimate.
- Monthly Cash Flow
- -$3,900
- Cap Rate
- 2.2%
- Cash-on-Cash Return
- -15.1%
- Debt Coverage Ratio
- 0.39
- Internal Rate of Return (5 years)
- -10.6%
Cash Flow
Net Operating Income (NOI) minus mortgage payments.
Calculation:
NOI - Mortgage Payments
Cap Rate (Market Value)
Capitalization Rate is a rate of return that compares the yearly Net Operating Income (NOI) to the market value.
Calculation:
NOI / Market Value
Cash-on-Cash Return (CoC)
Annual Cash Flow / Cash Invested
Calculation:
Annual cash flow divided by initial cash invested.
Debt Coverage Ratio (DCR)
Net Operating Income (NOI) divided by total debt payments.
Calculation:
NOI / Total Debt Payments
Internal Rate of Return (IRR)
A metric for assessing profitability over time. IRR is the discount rate at which the net present value (NPV) of all future cash flows (positive and negative) from an investment equals zero — including both periodic cash flow (such as rent) and a projected sale at the end of the holding period. It represents the expected annualized return, accounting for income, expenses, and the recovery of capital through a future sale.
Property Description
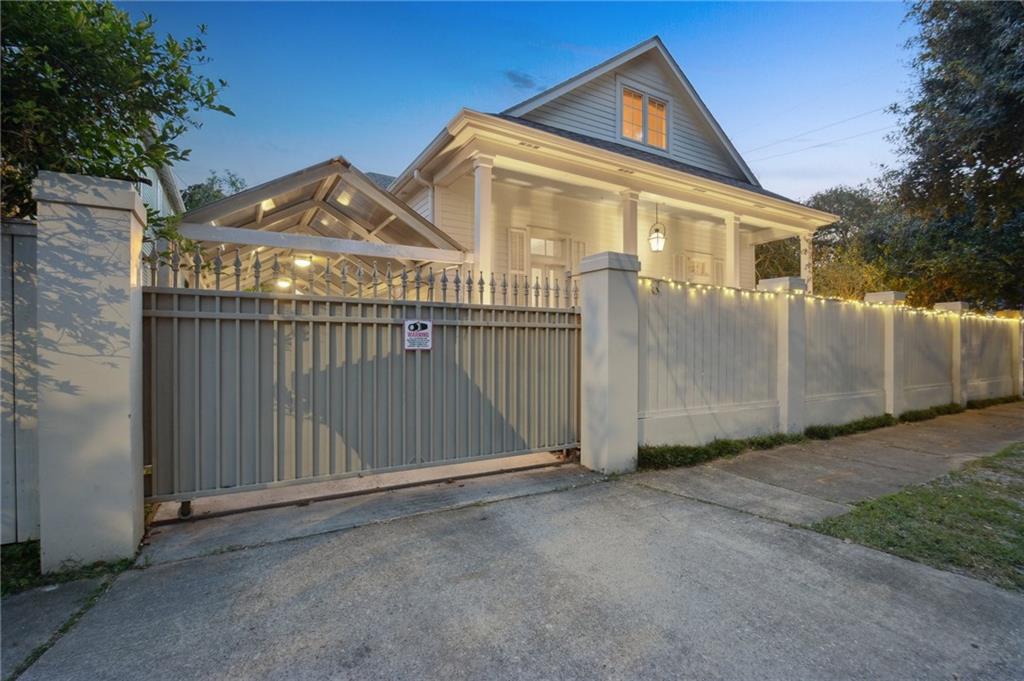
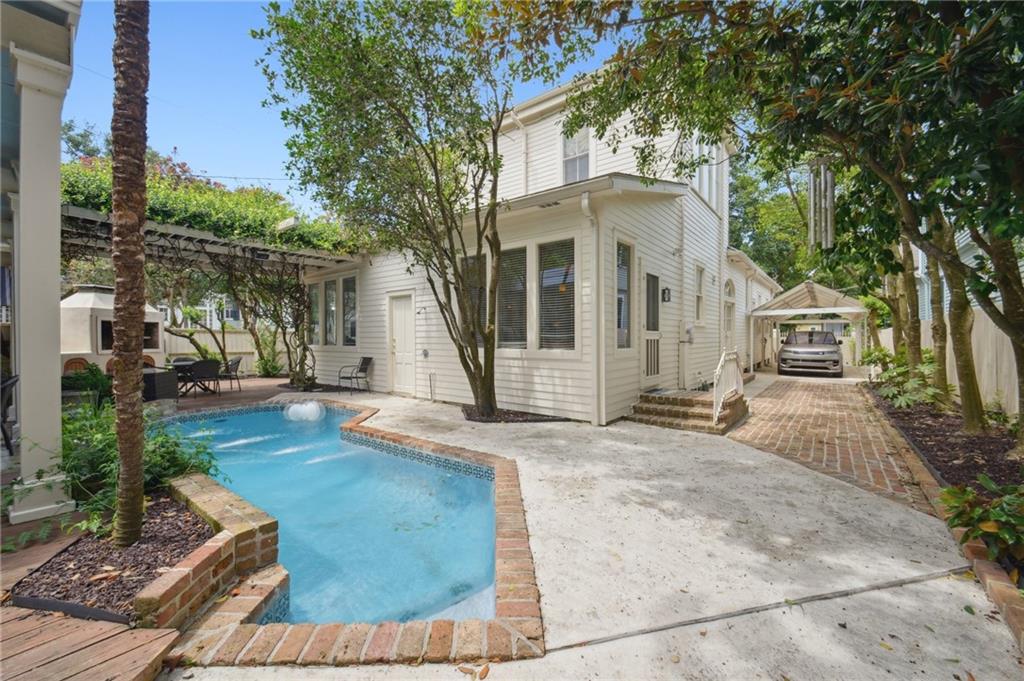
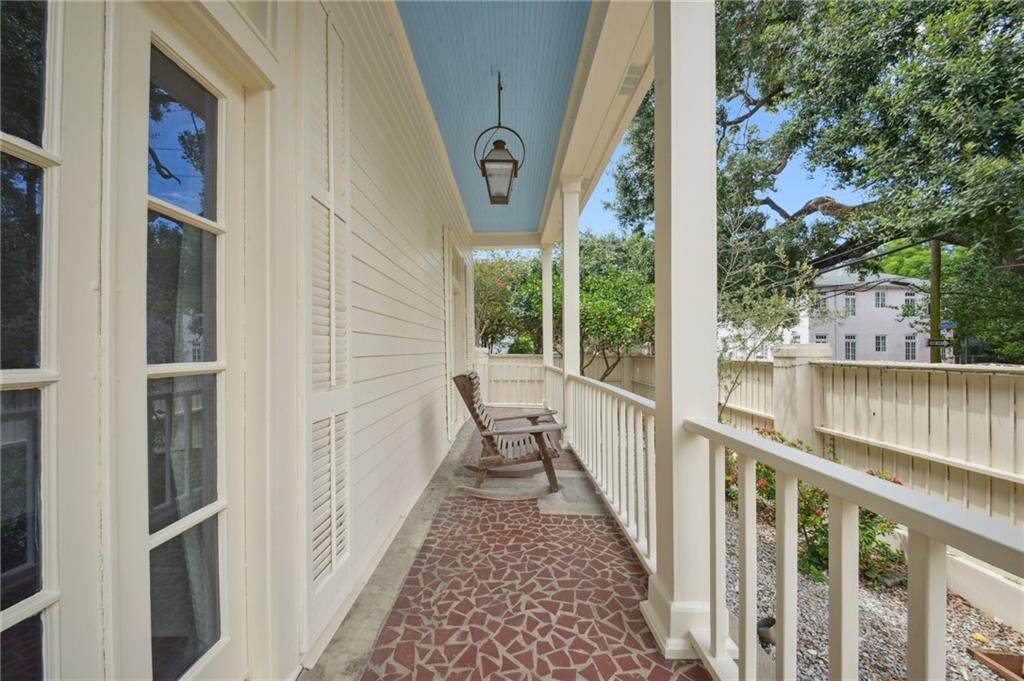
Enter through the privacy gates and into your own walled compound in a Superb Uptown East Carrollton location. Set on an expansive Corner Lot measuring 60' Wide by 122' Deep; this elegant residence balances architectural grandeur with effortless everyday living. Twelve foot ceilings crown the first floor. Refinished Original heart pine floors glow under beautiful natural light. Tall elegant Light Filled Windows, refined millwork, and French doors create a timeless ambience that is both stately and warmly inviting.<br><br> Arrivals are exceptional. With a covered and gated motor court on the Hampson Street side, that leads to an Israeli Smart Technology cooled parking pavilion for up to three vehicles with an EV Fast Charging Station. A second covered off-street parking area, with a gated entrance on Burdette provides additional convenience, with added dedicated guest parking outside the gate, sized for a large SUV or truck. The property’s thoughtful orientation allows for multiple off street parking configurations, without compromising the beauty of the grounds, and allows for complete privacy at all times.<br><br> Outdoors, the setting is a true sanctuary. Mature citrus and fruit trees include Satsuma, Meyer lemon, fig, & olive. Fragrance from a Sweet Olive & a jasmine covered Pergola drifts across the patio. The entertainment terrace is anchored by an Argentine style cooking and grill station beside a sparkling salt water pool, with an outdoor shower. With a detached Casita, that offers true flexibility as a playroom, an art studio, a coveted fitness retreat, or a palatial private office.<br><br> Inside, the plan is purposeful & truly generous. The first floor primary suite is a quiet haven with an updated en-suite bath, abundant built-in storage, and an oversized bedroom with Beautiful French doors opening onto a private meditation porch, where morning coffee and evening reflections feel worlds away. In total, the home provides 4 large separate bedrooms, 2 FULL Baths, & 2 Half baths to accommodate family and guests with ease.<br><br> The Chef’s kitchen is designed for gathering, with informal dining at a built-in banquette, a state of the art induction stovetop, wrapped in light and glorious views of the gardens and pool. A large walk in pantry and a first floor laundry center keep daily life organized and easily efficient.<br><br> Practical advantages match the beauty. The property lies in an X flood zone that has never flooded, and carries an annual flood insurance premium of $1,043. The address is enviable, just a half block off Saint Charles Avenue & only a half block to the very best of Maple Street’s cafes, shops, and neighborhood favorites.<br><br> This is an extraordinary offering, a rare private compound with scale, privacy, and presence in the heart of Uptown. It has everything you want, and the thoughtful details you did not know you needed. Come experience a residence that lives beautifully today and promises lasting value for years to come.<br><br>
Build Your Team
Quickly find investor-friendly professionals who can help you succeed in real estate investing at any stage of the investing journey.


Agents
Match with investor-friendly agents who can help you find, analyze, and close your next deal


Lenders
Get the best funding…find investor-friendly lenders who specialize in your deal strategy


Property Managers
Transition to passive investing. Find a trusted property management partnership that lasts.


Tax Pros & Accountants
Taxes and financial reporting made easy—find experts to create tax savings strategies, file taxes, and more
Location
Property Details
Parking
- Details: Carport, Driveway
- Garage Spaces: 0
- Spaces Total: 3
Bedroom Information
- # of Bedrooms: 4
Bathroom Information
- # of Baths (Full): 2
- # of Baths (Total): 4.0
Interior Features
- # of Rooms: 12
Exterior Features
- Foundation: Raised
- Roof Material: Shingle
Land Information
- Land Use: Residential
- Land Use Subtype: Single Family Residential
Lot Information
- Parcel ID: 716104901
- Lot Size: 0 sqft
Property Information
- Property Type: Single Family Residence
- Style: Camelback
- Year Built: 1935
Tax Information
- Annual Tax: $0
Utilities
- Water & Sewer: Public
- Heating: Central
- Cooling: Ceiling Fan(s), Central Air, Multi Units
Location
- County: Orleans Parish
Listing Details
Investment Summary
We noticed that property taxes are missing—this is a standard expense and should be considered in your estimate.
- Monthly Cash Flow
- -$3,900
- Cap Rate
- 2.2%
- Cash-on-Cash Return
- -15.1%
- Debt Coverage Ratio
- 0.39
- Internal Rate of Return (5 years)
- -10.6%
Cash Flow
Net Operating Income (NOI) minus mortgage payments.
Calculation:
NOI - Mortgage Payments
Cap Rate (Market Value)
Capitalization Rate is a rate of return that compares the yearly Net Operating Income (NOI) to the market value.
Calculation:
NOI / Market Value
Cash-on-Cash Return (CoC)
Annual Cash Flow / Cash Invested
Calculation:
Annual cash flow divided by initial cash invested.
Debt Coverage Ratio (DCR)
Net Operating Income (NOI) divided by total debt payments.
Calculation:
NOI / Total Debt Payments
Internal Rate of Return (IRR)
A metric for assessing profitability over time. IRR is the discount rate at which the net present value (NPV) of all future cash flows (positive and negative) from an investment equals zero — including both periodic cash flow (such as rent) and a projected sale at the end of the holding period. It represents the expected annualized return, accounting for income, expenses, and the recovery of capital through a future sale.
Purchase Details
Purchase PriceThe price paid for the property. Purchase price:
| $1,349,000 |
|---|---|
Amount FinancedThe amount of the purchase financed through a loan. Amount financed:
| -$1,079,200 |
Down paymentThe initial payment made towards the purchase. Down payment:
| $269,800 |
Closing CostsFees and expenses associated with purchasing a property, typically ranging from 2% to 5% of the home’s purchase price, paid at the end of a home purchase to cover services like lending, title transfer, and taxes. Closing costs:
| $40,470 |
Rehab CostsCosts incurred to repair or improve the property, including: roof, flooring, exterior siding, kitchen, exterior paint, bathrooms, etc. Rehab costs:
| $0 |
Initial Cash InvestedThe total initial cash invested in the property. Calculation:Down payment + Buying costs + Rehab costs Initial cash invested:
| $310,270 |
Square Feet (SQFT)The total square footage of the property. Square feet:
| 3,549 |
Cost Per Square FootCost per square foot of the property. Calculation:Purchase Price / Square Feet Cost per square foot:
| $380 |
Monthly Rent Per Square FootMonthly rent divided by the number of square feet. This ratio helps investors compare rental income efficiency across properties, markets, and unit sizes Calculation:Monthly Rent / Square Feet Monthly rent per square foot:
| $1.01 |
Financing Details
Loan AmountThe total sum of money borrowed from a lender to finance a property purchase. Calculation:Purchase Price - Down Payment
Loan amount:
| $1,079,200 |
|---|---|
Loan to Value Ratio (LTV)Loan amount divided by the market value of the property. Calculation:Loan Amount / Market Value
Loan to value ratio:
| 80.0% |
Loan TypeThe type of loan (e.g., fixed, adjustable).
Loan type:
| Amortizing |
TermThe loan repayment period in years.
Term:
| 30 years |
Interest RateThe percentage a lender charges on the borrowed amount of a loan, determining the cost of borrowing money.
Interest rate:
| 5.875% |
Principal & Interest (PI)The principal is the portion of the loan payment that reduces the loan balance. The interest is the lender's charge for borrowing money. Calculation:(P * r * (1 + r) ** n) / ((1 + r) ** n - 1) Where:
P = Loan amount (principal)
Principal & interest:
| $6,384 |
Property TaxesAnnual taxes levied by local governments on real estate properties. These taxes fund public services like schools, roads, and emergency services.
Property tax:
| $0 |
InsuranceThe costs for insurance coverage to protect against financial losses due to risks like fire, natural disasters, theft, liability, or tenant-related damages. Calculation:Assumes 7% of gross rental income, unless insurance rates are specified.
Insurance:
| $252 |
Private Mortgage Insurance (PMI)A fee that borrowers pay when they take out a conventional loan with a loan-to-value (LTV) ratio above 80%.
Private mortgage insurance (PMI):
| $0 |
Monthly PaymentThe fixed amount a borrower pays each month to repay a loan. It typically includes principal and interest (P&I) and may also cover property taxes, insurance, HOA fees, and PMI if escrowed. Monthly payment:
| $6,636 |
Operating Income
| % Rent | Monthly | Yearly | |
|---|---|---|---|
Gross RentThe total rental income received from tenants before deducting any expenses. Includes base rent, late fees, pet fees, parking fees, and other recurring charges.
Gross rent:
| $3,600 | $43,200 | |
Vacancy LossExpected loss of rent due to vacancies.
Vacancy loss:
(6%)
| 6% | -$216 | -$2,592 |
Operating IncomeGross rental income minus vacancy loss. Calculation:Gross rent - Vacancy loss
Operating income:
| $3,384 | $40,608 |
Operating Expenses
| % Rent | Monthly | Yearly | |
|---|---|---|---|
Property TaxesAnnual taxes levied by local governments on real estate properties. These taxes fund public services like schools, roads, and emergency services.
We noticed that property taxes are missing—these are standard expenses and should be considered in your estimate. | n/a | n/a | n/a |
InsuranceThe costs for insurance coverage to protect against financial losses due to risks like fire, natural disasters, theft, liability, or tenant-related damages. Calculation:Assumes 7% of gross rental income, unless insurance rates are specified. | 7% | -$252 | -$3,024 |
Property ManagementThe costs associated with hiring a property manager to handle the day-to-day operations of a rental property. Includes management fees, leasing fes, eviction fees, etc. Calculation:Assumes 8% of gross rental income. | 8% | -$288 | -$3,456 |
Repairs & MaintenanceOngoing costs for routine upkeep and minor fixes needed to keep a property in good working condition. Calculation:Assumes 5% of gross rental income. Varies by property age and condition. | 5% | -$180 | -$2,160 |
Capital ExpensesLarge, infrequent costs for major improvements or replacements, like a new roof, HVAC system, or appliances. Calculation:Assumes 5% of gross rental income. Varies by property age. | 5% | -$180 | -$2,160 |
HOA FeesRegular dues paid to a Homeowners Association for community maintenance, amenities, and management. Similar fees include: Condo Association Fees, Co-op Maintenance Fees, etc. | n/a | n/a | n/a |
Operating ExpensesRecurring costs required to maintain and manage a rental property, including property taxes, insurance, maintenance, repairs, utilities (if paid by the owner), property management fees, and other day-to-day expenses. Calculation:Insurance + Property Taxes + Property Management + Repairs & Maintenance + Capital Expenditures + HOA Fees | 25% | -$900 | -$10,800 |
Cash Flow
| Monthly | Yearly | |
|---|---|---|
Net Operating Income (NOI)The income generated from a property after deducting all operating expenses but before deducting mortgage payments, taxes, and capital expenditures. Calculation:Gross Operating Income - Operating Expenses
Net operating income:
| $2,484 | $29,808 |
Mortgage PaymentThe fixed amount a borrower pays each month to repay a loan. It typically includes principal and interest (P&I) and may also cover property taxes, insurance, HOA fees, and PMI if escrowed. | -$6,384 | -$76,608 |
Cash FlowNet Operating Income (NOI) minus mortgage payments. Calculation:NOI - Mortgage Payments | -$3,900 | -$46,800 |