$2,400,000
Investment Summary
- Monthly Cash Flow
- -$7,508
- Cap Rate
- 2.4%
- Cash-on-Cash Return
- -16.3%
- Debt Coverage Ratio
- 0.39
- Internal Rate of Return (5 years)
- -11.8%
Cash Flow
Net Operating Income (NOI) minus mortgage payments.
Calculation:
NOI - Mortgage Payments
Cap Rate (Market Value)
Capitalization Rate is a rate of return that compares the yearly Net Operating Income (NOI) to the market value.
Calculation:
NOI / Market Value
Cash-on-Cash Return (CoC)
Annual Cash Flow / Cash Invested
Calculation:
Annual cash flow divided by initial cash invested.
Debt Coverage Ratio (DCR)
Net Operating Income (NOI) divided by total debt payments.
Calculation:
NOI / Total Debt Payments
Internal Rate of Return (IRR)
A metric for assessing profitability over time. IRR is the discount rate at which the net present value (NPV) of all future cash flows (positive and negative) from an investment equals zero — including both periodic cash flow (such as rent) and a projected sale at the end of the holding period. It represents the expected annualized return, accounting for income, expenses, and the recovery of capital through a future sale.
Property Description
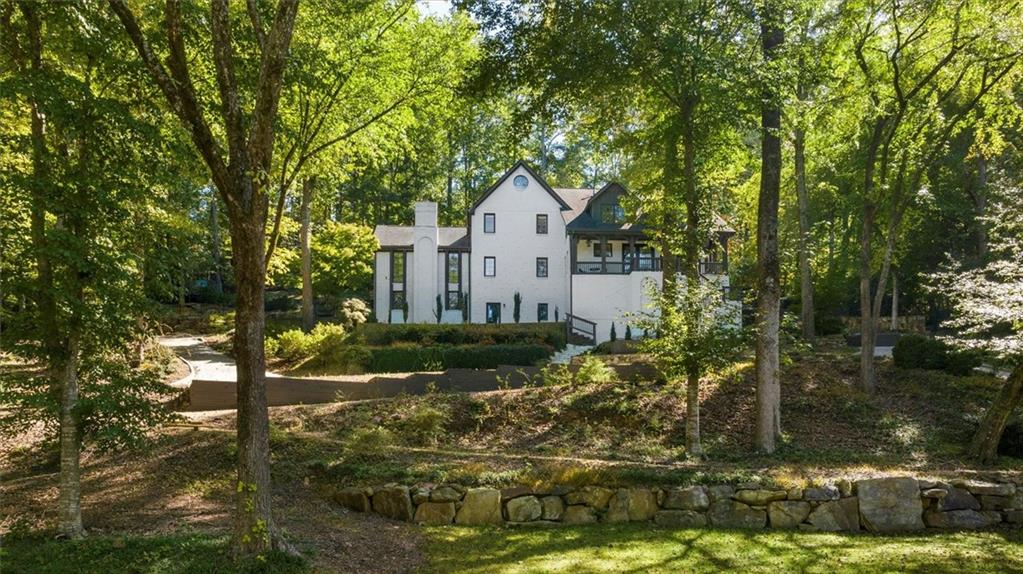
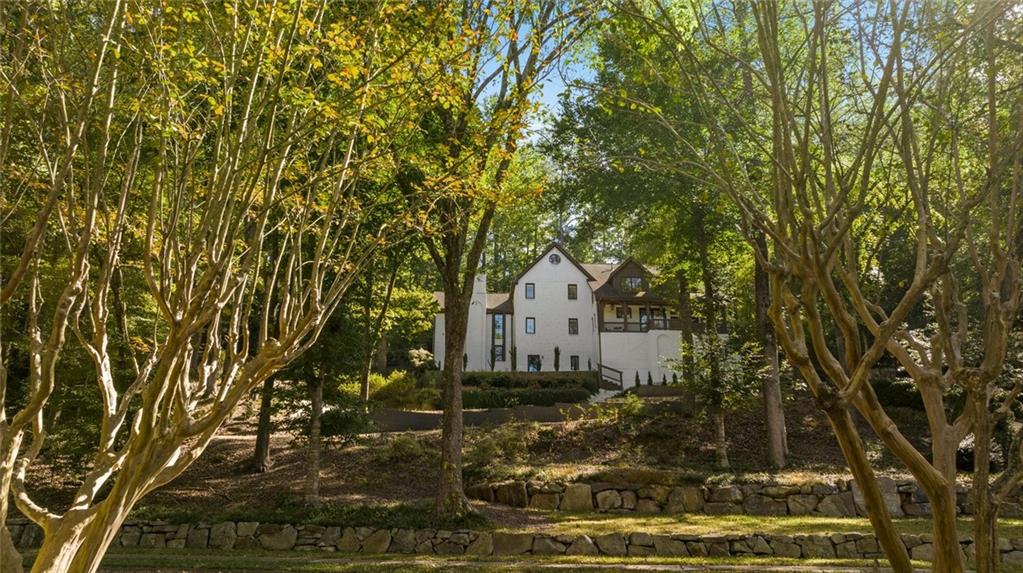
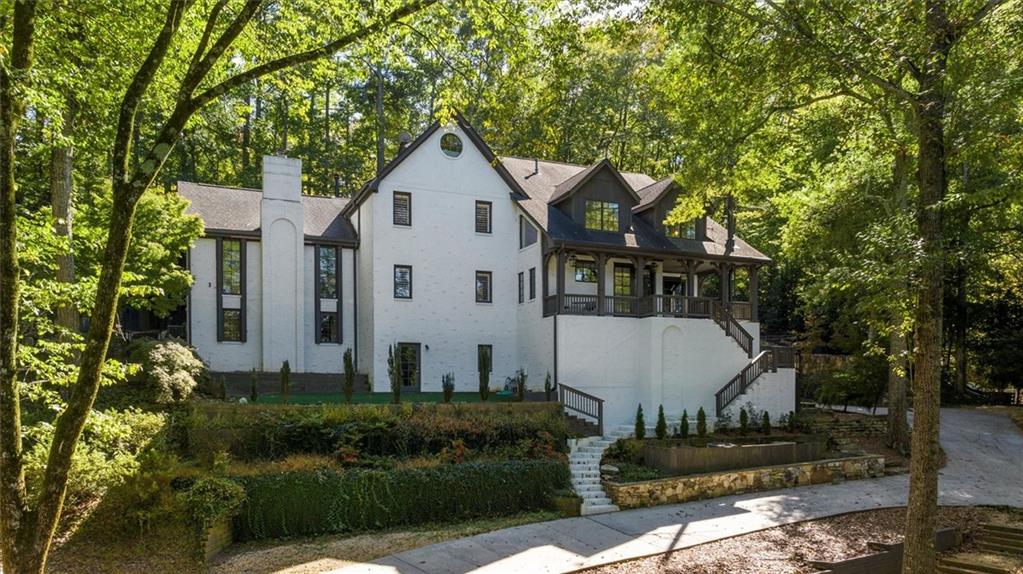
Where Sophistication Meets Serenity – A Masterfully Renovated Executive Retreat Welcome to a rare fusion of modern luxury and timeless design. This expansive brick residence, originally built with Tudor influences in 1980, was completely reimagined between 2018–2019 with no detail overlooked—including all-new electrical, plumbing, interior walls, and custom exterior windows and doors. Located in one of the area's most prestigious swim/tennis communities, this private 1.5-acre estate offers an unparalleled living experience just steps from the Chattahoochee River and top-rated schools.The home greets you with a circular drive, a charming front porch with fireplace, and tranquil treetop views. Inside, over 8,000 square feet of light-filled, designer-curated interiors provide seamless flow for daily living and grand entertaining.At the heart of the home is a chef-caliber kitchen featuring quartz countertops and backsplash, Thermador appliances—including full-size refrigerator and freezer—dual sinks, a gas cooktop, and an oversized island. The main level is purpose-built for elegant gatherings with a sun-drenched dining room that seats 12+, a keeping room, formal living and family rooms, a guest suite with private bath, stylish powder room, and a glass-lined sunroom offering serene views of the landscaped grounds.Throughout the home, you'll find wide-plank hardwoods, soaring beamed ceilings, five fireplaces, walls of windows, and custom wet bars on three levels. Upstairs, the primary suite is a private sanctuary with its own fireplace, lounge area, luxurious spa bath with dual vanities, soaking tub, dual walk-in showers—including a steam shower—and a custom walk-in closet with discreet access to a hidden fourth-story bonus room. The third level hosts two additional ensuite bedrooms, a private laundry room, Juliet balcony, and a fully equipped kitchenette and coffee bar. The fourth floor reveals a sprawling bonus space perfect for creative work or relaxation.Outdoor living is equally impressive. French doors from the kitchen and dining areas open to a beautifully turfed courtyard ideal for al fresco dining, lounging, and entertaining. Multiple stone terraces, landscaped courtyards, and quiet garden paths surround the home, offering privacy and serenity with ample guest parking.The terrace level completes the lifestyle experience with a full gym, additional office space, game room, library, kitchenette, full bath, mudroom, and access to a 3-car garage with additional storage. Another turfed patio just outside offers a peaceful extension of your indoor lifestyle.Perfectly positioned near Heards Ferry, Riverwood, top private schools, and upscale shopping and dining, this extraordinary home offers the ultimate blend of luxury, privacy, and convenience for the modern executive.
Build Your Team
Quickly find investor-friendly professionals who can help you succeed in real estate investing at any stage of the investing journey.


Agents
Match with investor-friendly agents who can help you find, analyze, and close your next deal


Lenders
Get the best funding…find investor-friendly lenders who specialize in your deal strategy


Property Managers
Transition to passive investing. Find a trusted property management partnership that lasts.


Tax Pros & Accountants
Taxes and financial reporting made easy—find experts to create tax savings strategies, file taxes, and more
Location
Property Details
Parking
- Description: Attached, Drive Under Main Level, Driveway, Garage, Garage Faces Side, Parking Pad
- Details: Attached, Driveway, Garage, Garage Faces Side, Parking Pad
- Garage Spaces: 3
- Spaces Total: 0
Bedroom Information
- # of Bedrooms: 4
Bathroom Information
- # of Baths (Full): 5
- # of Baths (Partial): 1
- # of Baths (Total): 6.0
Interior Features
- # of Rooms: 8
- # of Stories: 3
- Basement: Yes
- Basement Description: Daylight, Exterior Entry, Finished, Interior Entry, Partial
- Fireplace: Yes
Exterior Features
- Exterior Walls Materials: Rock, Stone
- Foundation: Concrete Perimeter
- Roof Material: Composition
Land Information
- Land Use: Residential
- Land Use Subtype: Single Family Residential
Lot Information
- Parcel ID: 17020600080388
- Lot Size: 0 sqft
Property Information
- Property Type: Single Family Residence
- Style: Contemporary, Craftsman, Modern
- Year Built: 1980
Tax Information
- Annual Tax: $17,093
Utilities
- Water & Sewer: Public
- Heating: Central
- Cooling: Ceiling Fan(s), Central Air
Location
- County: Fulton
Listing Details
Investment Summary
- Monthly Cash Flow
- -$7,508
- Cap Rate
- 2.4%
- Cash-on-Cash Return
- -16.3%
- Debt Coverage Ratio
- 0.39
- Internal Rate of Return (5 years)
- -11.8%
Cash Flow
Net Operating Income (NOI) minus mortgage payments.
Calculation:
NOI - Mortgage Payments
Cap Rate (Market Value)
Capitalization Rate is a rate of return that compares the yearly Net Operating Income (NOI) to the market value.
Calculation:
NOI / Market Value
Cash-on-Cash Return (CoC)
Annual Cash Flow / Cash Invested
Calculation:
Annual cash flow divided by initial cash invested.
Debt Coverage Ratio (DCR)
Net Operating Income (NOI) divided by total debt payments.
Calculation:
NOI / Total Debt Payments
Internal Rate of Return (IRR)
A metric for assessing profitability over time. IRR is the discount rate at which the net present value (NPV) of all future cash flows (positive and negative) from an investment equals zero — including both periodic cash flow (such as rent) and a projected sale at the end of the holding period. It represents the expected annualized return, accounting for income, expenses, and the recovery of capital through a future sale.
Purchase Details
Purchase PriceThe price paid for the property. Purchase price:
| $2,400,000 |
|---|---|
Amount FinancedThe amount of the purchase financed through a loan. Amount financed:
| -$1,920,000 |
Down paymentThe initial payment made towards the purchase. Down payment:
| $480,000 |
Closing CostsFees and expenses associated with purchasing a property, typically ranging from 2% to 5% of the home’s purchase price, paid at the end of a home purchase to cover services like lending, title transfer, and taxes. Closing costs:
| $72,000 |
Rehab CostsCosts incurred to repair or improve the property, including: roof, flooring, exterior siding, kitchen, exterior paint, bathrooms, etc. Rehab costs:
| $0 |
Initial Cash InvestedThe total initial cash invested in the property. Calculation:Down payment + Buying costs + Rehab costs Initial cash invested:
| $552,000 |
Square Feet (SQFT)The total square footage of the property. Square feet:
| 0 |
Cost Per Square FootCost per square foot of the property. Calculation:Purchase Price / Square Feet Cost per square foot:
| n/a |
Monthly Rent Per Square FootMonthly rent divided by the number of square feet. This ratio helps investors compare rental income efficiency across properties, markets, and unit sizes Calculation:Monthly Rent / Square Feet Monthly rent per square foot:
| n/a |
Financing Details
Loan AmountThe total sum of money borrowed from a lender to finance a property purchase. Calculation:Purchase Price - Down Payment
Loan amount:
| $1,920,000 |
|---|---|
Loan to Value Ratio (LTV)Loan amount divided by the market value of the property. Calculation:Loan Amount / Market Value
Loan to value ratio:
| 80.0% |
Loan TypeThe type of loan (e.g., fixed, adjustable).
Loan type:
| Amortizing |
TermThe loan repayment period in years.
Term:
| 30 years |
Interest RateThe percentage a lender charges on the borrowed amount of a loan, determining the cost of borrowing money.
Interest rate:
| 6.625% |
Principal & Interest (PI)The principal is the portion of the loan payment that reduces the loan balance. The interest is the lender's charge for borrowing money. Calculation:(P * r * (1 + r) ** n) / ((1 + r) ** n - 1) Where:
P = Loan amount (principal)
Principal & interest:
| $12,294 |
Property TaxesAnnual taxes levied by local governments on real estate properties. These taxes fund public services like schools, roads, and emergency services.
Property tax:
| $1,424 |
InsuranceThe costs for insurance coverage to protect against financial losses due to risks like fire, natural disasters, theft, liability, or tenant-related damages. Calculation:Assumes 7% of gross rental income, unless insurance rates are specified.
Insurance:
| $630 |
Private Mortgage Insurance (PMI)A fee that borrowers pay when they take out a conventional loan with a loan-to-value (LTV) ratio above 80%.
Private mortgage insurance (PMI):
| $0 |
Monthly PaymentThe fixed amount a borrower pays each month to repay a loan. It typically includes principal and interest (P&I) and may also cover property taxes, insurance, HOA fees, and PMI if escrowed. Monthly payment:
| $14,348 |
Operating Income
| % Rent | Monthly | Yearly | |
|---|---|---|---|
Gross RentThe total rental income received from tenants before deducting any expenses. Includes base rent, late fees, pet fees, parking fees, and other recurring charges.
Gross rent:
| $9,000 | $108,000 | |
Vacancy LossExpected loss of rent due to vacancies.
Vacancy loss:
(6%)
| 6% | -$540 | -$6,480 |
Operating IncomeGross rental income minus vacancy loss. Calculation:Gross rent - Vacancy loss
Operating income:
| $8,460 | $101,520 |
Operating Expenses
| % Rent | Monthly | Yearly | |
|---|---|---|---|
Property TaxesAnnual taxes levied by local governments on real estate properties. These taxes fund public services like schools, roads, and emergency services. | 16% | -$1,424 | -$17,093 |
InsuranceThe costs for insurance coverage to protect against financial losses due to risks like fire, natural disasters, theft, liability, or tenant-related damages. Calculation:Assumes 7% of gross rental income, unless insurance rates are specified. | 7% | -$630 | -$7,560 |
Property ManagementThe costs associated with hiring a property manager to handle the day-to-day operations of a rental property. Includes management fees, leasing fes, eviction fees, etc. Calculation:Assumes 8% of gross rental income. | 8% | -$720 | -$8,640 |
Repairs & MaintenanceOngoing costs for routine upkeep and minor fixes needed to keep a property in good working condition. Calculation:Assumes 5% of gross rental income. Varies by property age and condition. | 5% | -$450 | -$5,400 |
Capital ExpensesLarge, infrequent costs for major improvements or replacements, like a new roof, HVAC system, or appliances. Calculation:Assumes 5% of gross rental income. Varies by property age. | 5% | -$450 | -$5,400 |
HOA FeesRegular dues paid to a Homeowners Association for community maintenance, amenities, and management. Similar fees include: Condo Association Fees, Co-op Maintenance Fees, etc. | n/a | n/a | n/a |
Operating ExpensesRecurring costs required to maintain and manage a rental property, including property taxes, insurance, maintenance, repairs, utilities (if paid by the owner), property management fees, and other day-to-day expenses. Calculation:Insurance + Property Taxes + Property Management + Repairs & Maintenance + Capital Expenditures + HOA Fees | 41% | -$3,674 | -$44,093 |
Cash Flow
| Monthly | Yearly | |
|---|---|---|
Net Operating Income (NOI)The income generated from a property after deducting all operating expenses but before deducting mortgage payments, taxes, and capital expenditures. Calculation:Gross Operating Income - Operating Expenses
Net operating income:
| $4,786 | $57,432 |
Mortgage PaymentThe fixed amount a borrower pays each month to repay a loan. It typically includes principal and interest (P&I) and may also cover property taxes, insurance, HOA fees, and PMI if escrowed. | -$12,294 | -$147,528 |
Cash FlowNet Operating Income (NOI) minus mortgage payments. Calculation:NOI - Mortgage Payments | $7,508 | $90,096 |