$1,995,000
Investment Summary
- Monthly Cash Flow
- -$5,716
- Cap Rate
- 2.2%
- Cash-on-Cash Return
- -14.9%
- Debt Coverage Ratio
- 0.39
- Internal Rate of Return (5 years)
- -10.5%
Cash Flow
Net Operating Income (NOI) minus mortgage payments.
Calculation:
NOI - Mortgage Payments
Cap Rate (Market Value)
Capitalization Rate is a rate of return that compares the yearly Net Operating Income (NOI) to the market value.
Calculation:
NOI / Market Value
Cash-on-Cash Return (CoC)
Annual Cash Flow / Cash Invested
Calculation:
Annual cash flow divided by initial cash invested.
Debt Coverage Ratio (DCR)
Net Operating Income (NOI) divided by total debt payments.
Calculation:
NOI / Total Debt Payments
Internal Rate of Return (IRR)
A metric for assessing profitability over time. IRR is the discount rate at which the net present value (NPV) of all future cash flows (positive and negative) from an investment equals zero — including both periodic cash flow (such as rent) and a projected sale at the end of the holding period. It represents the expected annualized return, accounting for income, expenses, and the recovery of capital through a future sale.
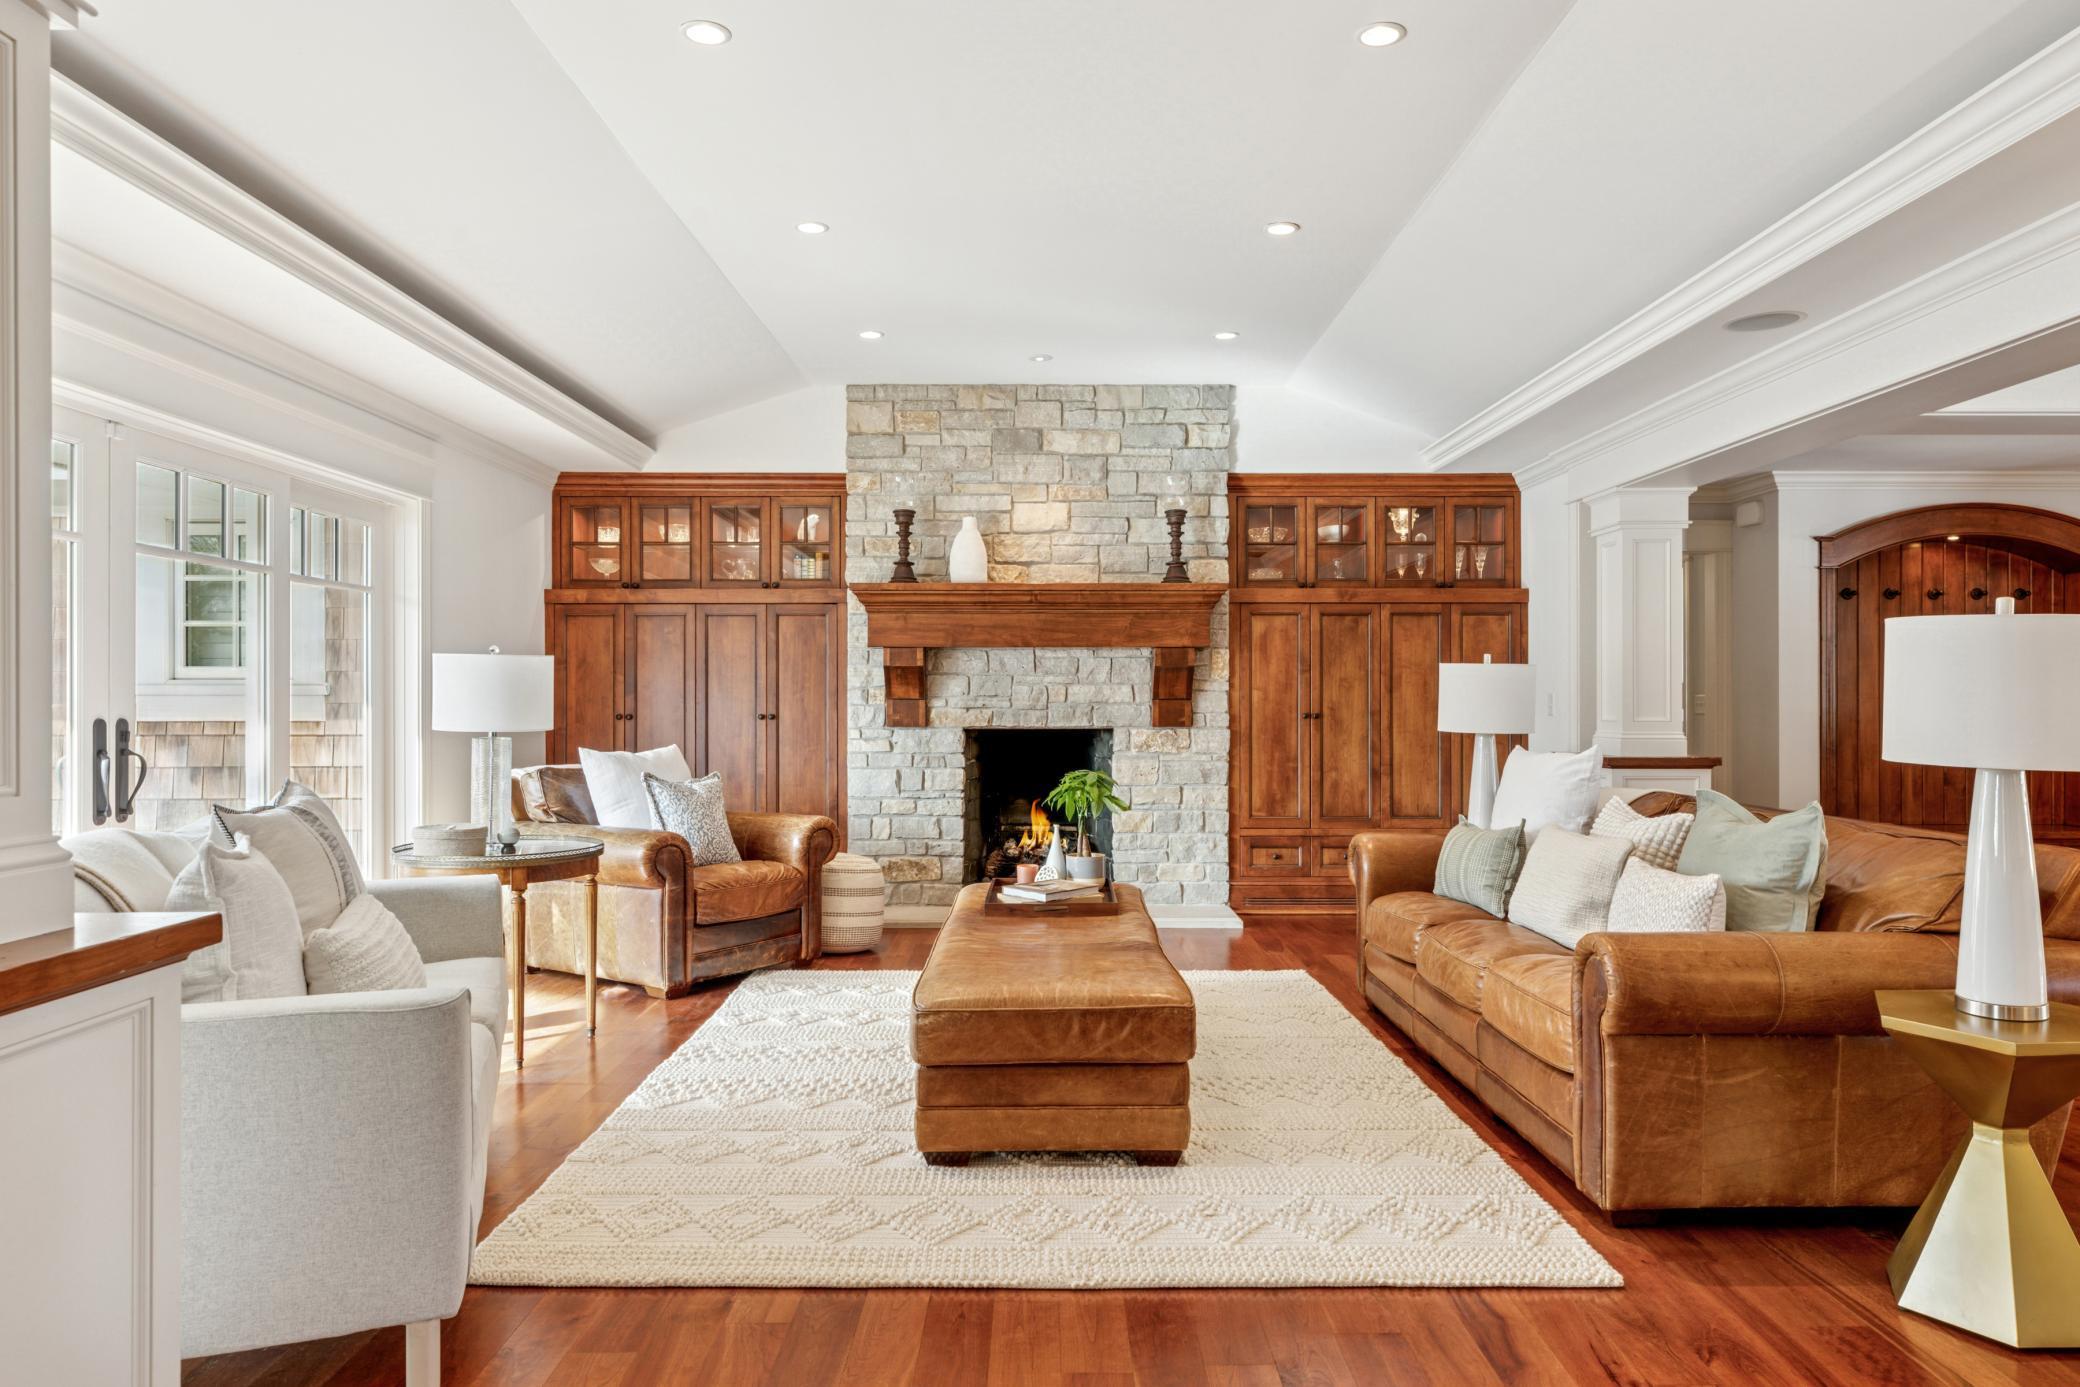
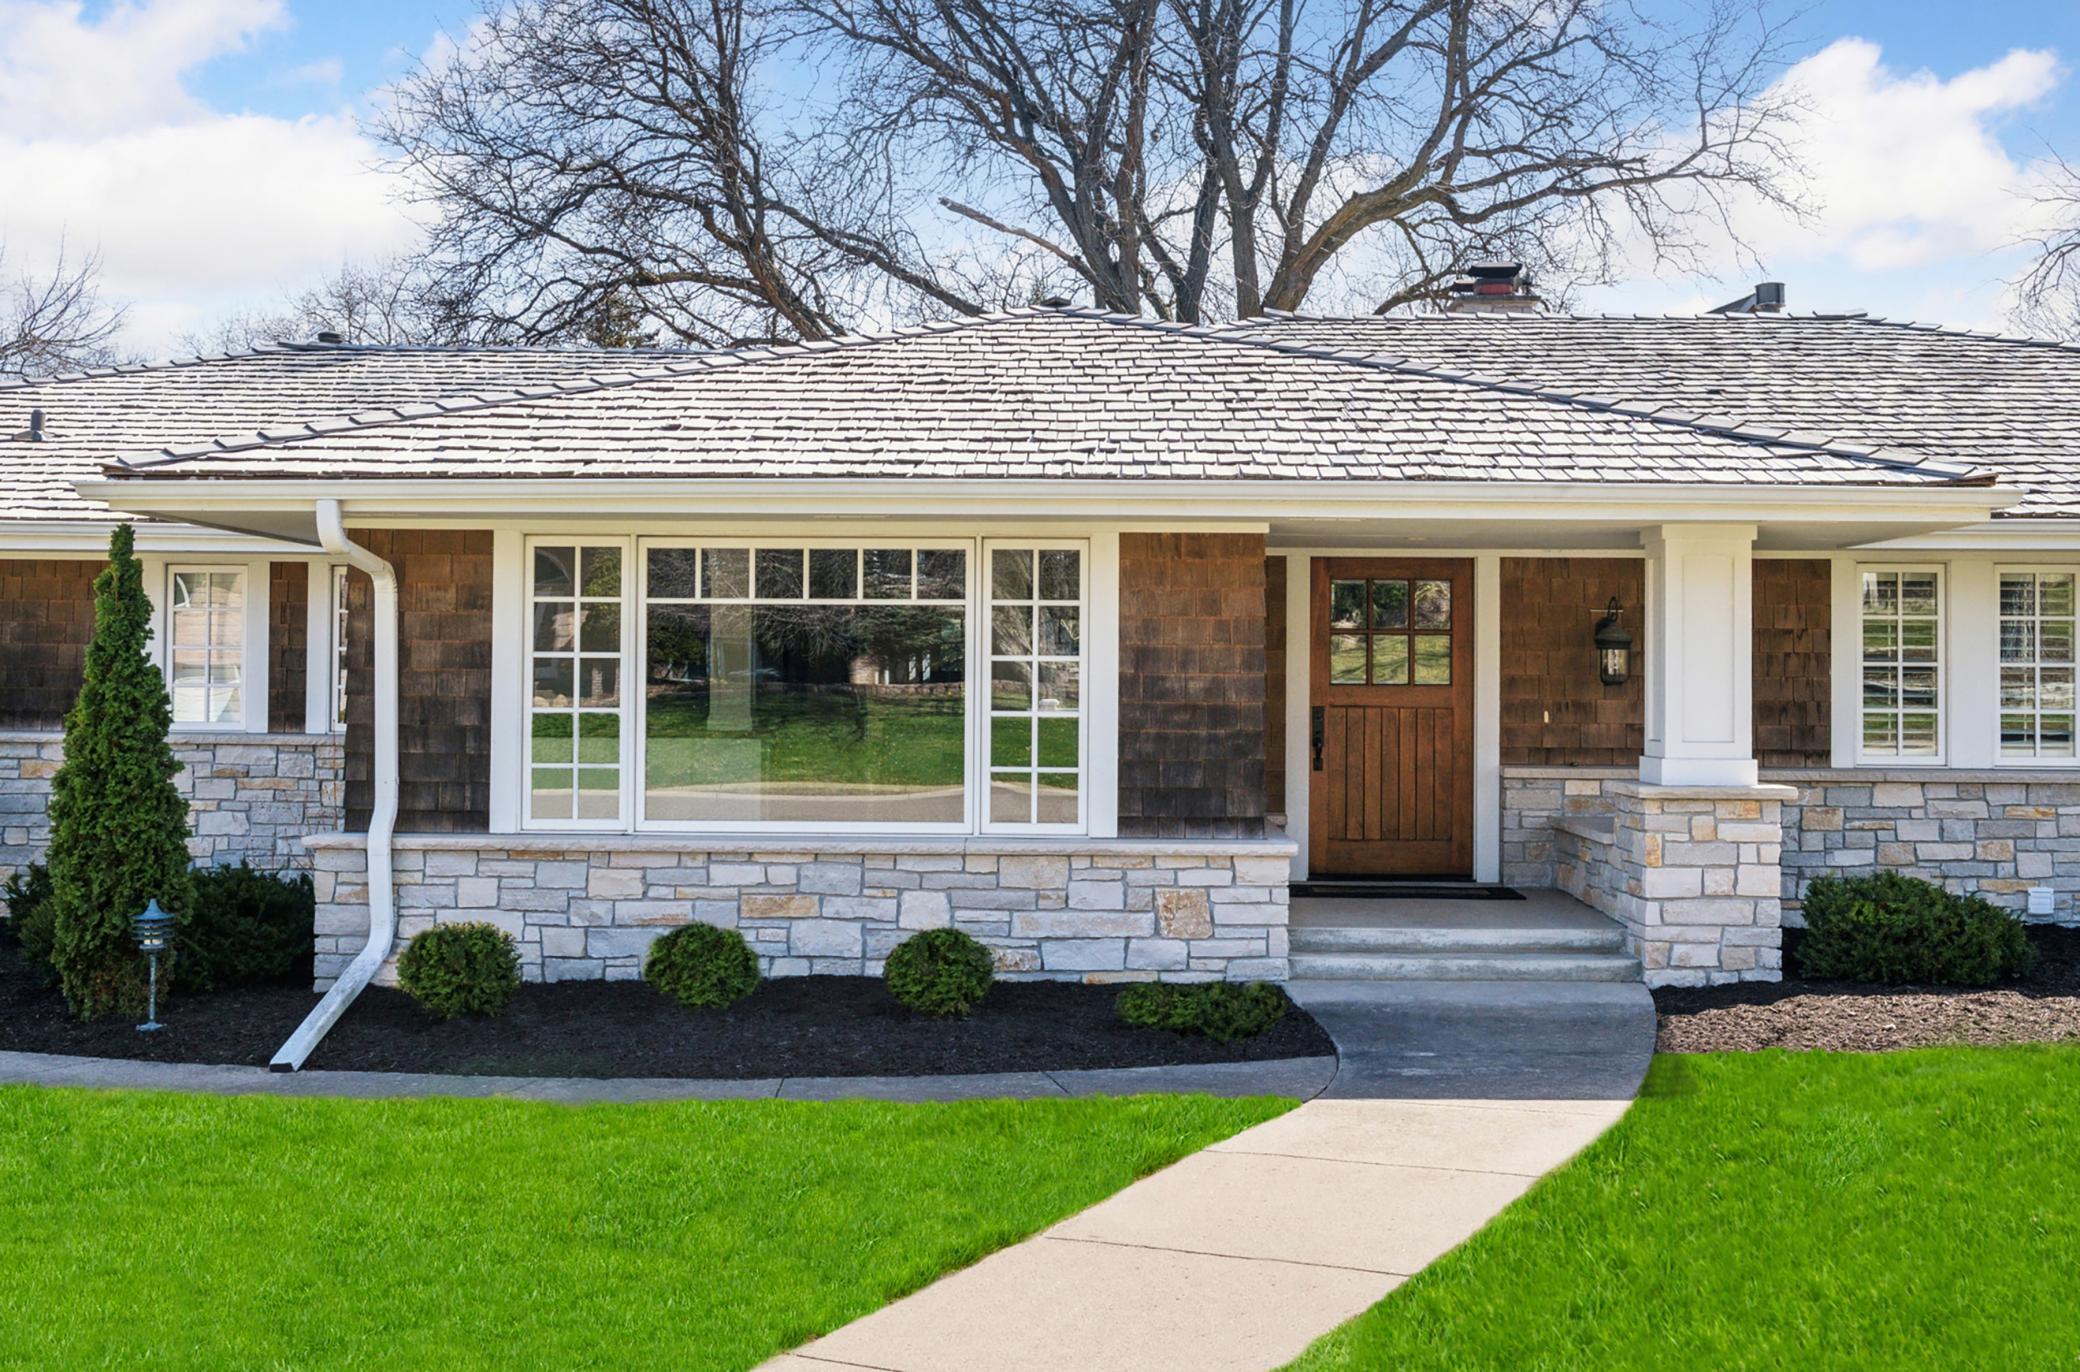
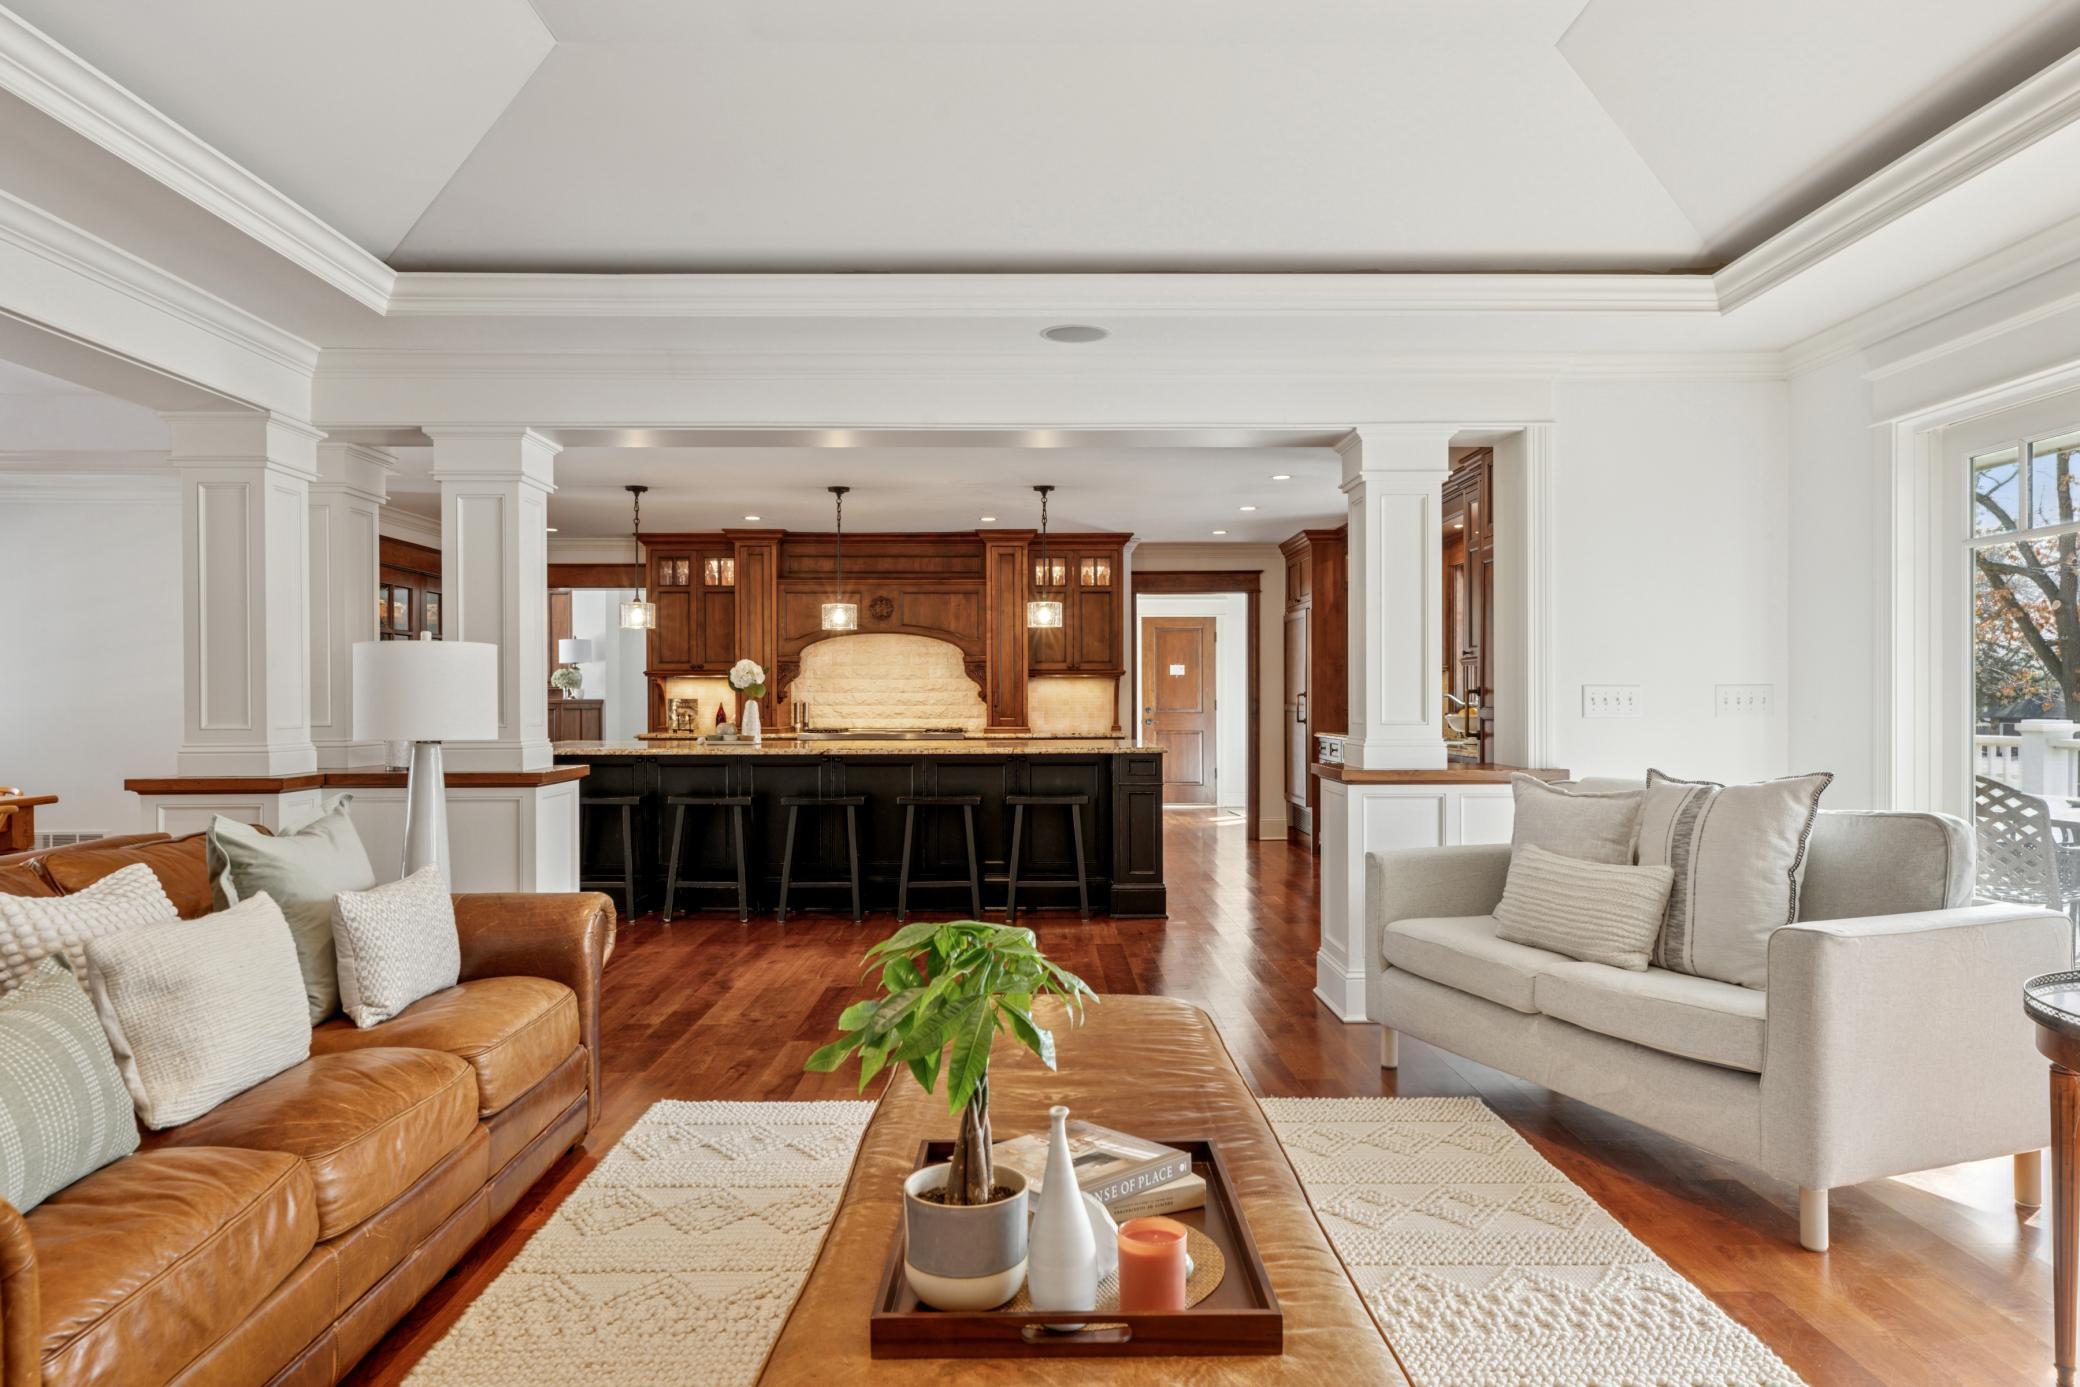
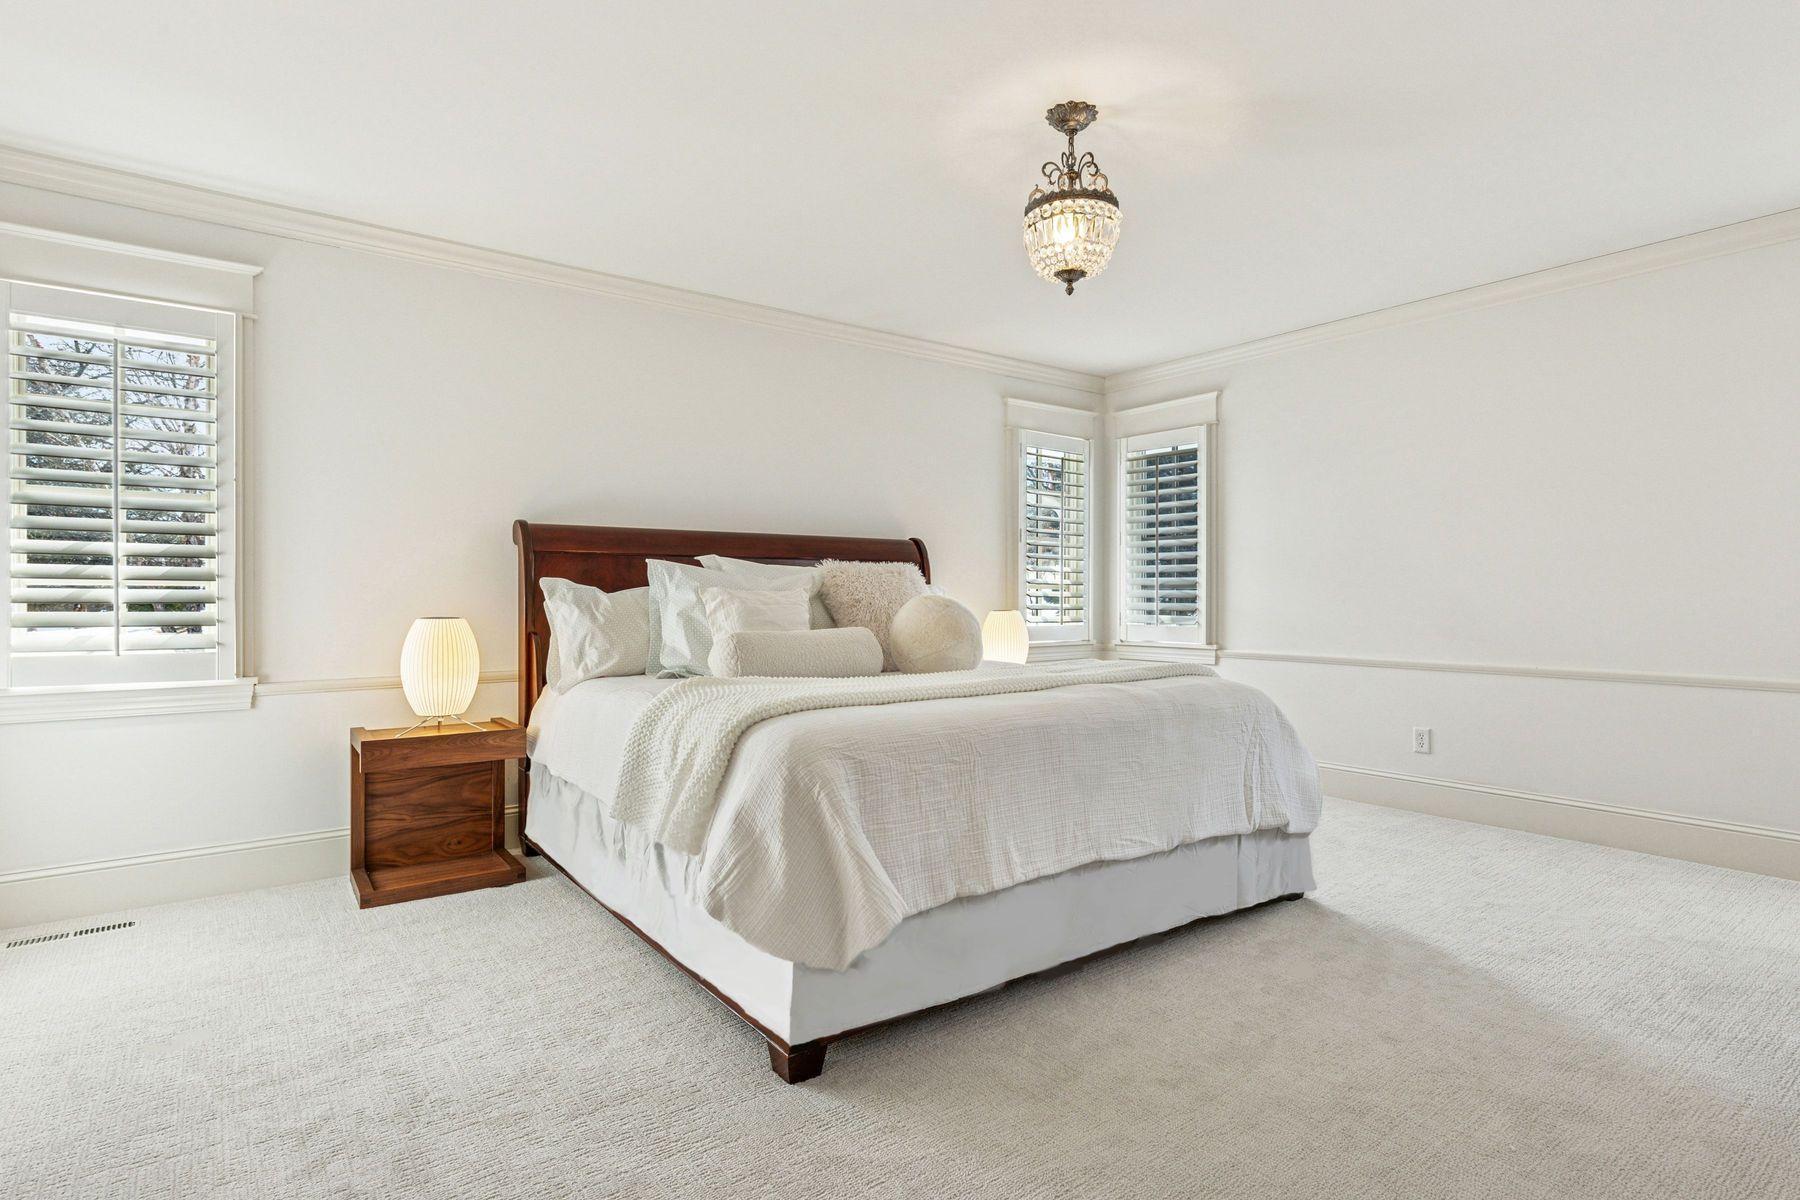
Property Description
Parkwood Knolls Retreat: Luxury, Location, and Modern Comfort. Experience refined living in this beautifully renovated Parkwood Knolls residence, where stately and timeless curb appeal meets impeccable design. Nestled on a quiet, tree-lined street in one of Edina's most sought-after neighborhoods, this home offers rare conveniences and a seamless blend of modern elegance and classic sophistication. Inviting Interiors and Exceptional Craftsmanship. Step inside the grand entry and discover natural stone and rich woodwork, creating a warm, cohesive atmosphere that masterfully combines rustic elegance with contemporary aesthetics. The expansive, open-concept layout is perfect for both lively gatherings and quiet evenings at home. Immense natural light pours through oversized windows, highlighting sleek horizontal lines, gleaming hardwood floors, and exquisite masonry. Main-Level Living Designed for Comfort and Entertaining. The main level areas are grand and welcoming, featuring stately pillars, soaring ceilings, and a dramatic stone fireplace anchoring the family room. The colossal kitchen island inspires entertaining or casual meals, surrounded by bespoke cabinetry and luxury appliances. Unwind in the picturesque sunroom or transform this area into a formal dining room, playroom, or reading room. Four spacious main-level bedrooms include a luxurious primary suite with a spa-inspired bathroom with heated flooring, a soaking tub, a separate shower, a walk-in closet, and adjoining laundry area that adds ultimate convenience. Additional main-level highlights include a dedicated office, mudroom, pantry, and easy access to the three-car-garage - step onto the expansive deck, perfect for evening relaxation or hosting unforgettable gatherings under the stars. Versatile Lower Level for Every Lifestyle. Flexibility and functional describe the walk-out at the lower level. It features a second full kitchen and laundry, a large family room, additional bedrooms, flexible office spaces, a home gym, and an oversized storage area with easy conversion to a fourth garage space. Whether you need guest quarters, a suite, a secluded retreat, or an additional large gathering area, this level adapts to your needs. Spectacular Lot, Location, and Outdoor Enjoyment. Take advantage of this rare opportunity: a panoramic, oversized Edina lot that can easily accommodate your vision, albeit a swimming pool, additional quarters, gardens, and/or an expanded sports court. Some of the best of Edina living is steps from Walnut Ridge Park's scenic trails, tennis and pickleball courts, playground, and bike paths. Top-rated schools, world-class shopping, and dining are all within easy reach, making every day both convenient and enriching. Move-In Ready Luxury. Meticulously maintained and thoughtfully updated, this move-in-ready home delivers effortless, elevated living in one of Edina's most desirable neighborhoods. Discover a rare combination of location, luxury, and style-the lifestyle you dream of. Schedule your private tour today and experience the magic of this home for yourself.
Build Your Team
Quickly find investor-friendly professionals who can help you succeed in real estate investing at any stage of the investing journey.


Agents
Match with investor-friendly agents who can help you find, analyze, and close your next deal


Lenders
Get the best funding…find investor-friendly lenders who specialize in your deal strategy


Property Managers
Transition to passive investing. Find a trusted property management partnership that lasts.


Tax Pros & Accountants
Taxes and financial reporting made easy—find experts to create tax savings strategies, file taxes, and more
Location
Property Details
Parking
- Description: Attached Garage, Concrete
- Details: Asphalt, Garage Door Opener, Storage
- Garage Spaces: 3
- Spaces Total: 0
Bedroom Information
- # of Bedrooms: 7
Bathroom Information
- # of Baths (Full): 1
- # of Baths (Partial): 1
- # of Baths (Total): 4.0
Interior Features
- # of Rooms: 5
- # of Stories: 1
- Basement: Yes
- Fireplace: Yes
Exterior Features
- Exterior Walls Materials: Wood
- Roof Type: Hip
- Roof Material: Shake
Land Information
- Land Use: Residential
- Land Use Subtype: Single Family Residential
Lot Information
- Parcel ID: 3111721240026
- Lot Size: 27007 sqft
Property Information
- Property Type: Single Family Residence
- Style: (SF) Single Family
- Year Built: 1971
Tax Information
- Annual Tax: $20,709
Utilities
- Heating: Forced Air
Location
- County: Hennepin
Listing Details
Investment Summary
- Monthly Cash Flow
- -$5,716
- Cap Rate
- 2.2%
- Cash-on-Cash Return
- -14.9%
- Debt Coverage Ratio
- 0.39
- Internal Rate of Return (5 years)
- -10.5%
Cash Flow
Net Operating Income (NOI) minus mortgage payments.
Calculation:
NOI - Mortgage Payments
Cap Rate (Market Value)
Capitalization Rate is a rate of return that compares the yearly Net Operating Income (NOI) to the market value.
Calculation:
NOI / Market Value
Cash-on-Cash Return (CoC)
Annual Cash Flow / Cash Invested
Calculation:
Annual cash flow divided by initial cash invested.
Debt Coverage Ratio (DCR)
Net Operating Income (NOI) divided by total debt payments.
Calculation:
NOI / Total Debt Payments
Internal Rate of Return (IRR)
A metric for assessing profitability over time. IRR is the discount rate at which the net present value (NPV) of all future cash flows (positive and negative) from an investment equals zero — including both periodic cash flow (such as rent) and a projected sale at the end of the holding period. It represents the expected annualized return, accounting for income, expenses, and the recovery of capital through a future sale.
Purchase Details
Purchase PriceThe price paid for the property. Purchase price:
| $1,995,000 |
|---|---|
Amount FinancedThe amount of the purchase financed through a loan. Amount financed:
| -$1,596,000 |
Down paymentThe initial payment made towards the purchase. Down payment:
| $399,000 |
Closing CostsFees and expenses associated with purchasing a property, typically ranging from 2% to 5% of the home’s purchase price, paid at the end of a home purchase to cover services like lending, title transfer, and taxes. Closing costs:
| $59,850 |
Rehab CostsCosts incurred to repair or improve the property, including: roof, flooring, exterior siding, kitchen, exterior paint, bathrooms, etc. Rehab costs:
| $0 |
Initial Cash InvestedThe total initial cash invested in the property. Calculation:Down payment + Buying costs + Rehab costs Initial cash invested:
| $458,850 |
Square Feet (SQFT)The total square footage of the property. Square feet:
| 7,018 |
Cost Per Square FootCost per square foot of the property. Calculation:Purchase Price / Square Feet Cost per square foot:
| $284 |
Monthly Rent Per Square FootMonthly rent divided by the number of square feet. This ratio helps investors compare rental income efficiency across properties, markets, and unit sizes Calculation:Monthly Rent / Square Feet Monthly rent per square foot:
| $1.13 |
Financing Details
Loan AmountThe total sum of money borrowed from a lender to finance a property purchase. Calculation:Purchase Price - Down Payment
Loan amount:
| $1,596,000 |
|---|---|
Loan to Value Ratio (LTV)Loan amount divided by the market value of the property. Calculation:Loan Amount / Market Value
Loan to value ratio:
| 80.0% |
Loan TypeThe type of loan (e.g., fixed, adjustable).
Loan type:
| Amortizing |
TermThe loan repayment period in years.
Term:
| 30 years |
Interest RateThe percentage a lender charges on the borrowed amount of a loan, determining the cost of borrowing money.
Interest rate:
| 5.875% |
Principal & Interest (PI)The principal is the portion of the loan payment that reduces the loan balance. The interest is the lender's charge for borrowing money. Calculation:(P * r * (1 + r) ** n) / ((1 + r) ** n - 1) Where:
P = Loan amount (principal)
Principal & interest:
| $9,441 |
Property TaxesAnnual taxes levied by local governments on real estate properties. These taxes fund public services like schools, roads, and emergency services.
Property tax:
| $1,726 |
InsuranceThe costs for insurance coverage to protect against financial losses due to risks like fire, natural disasters, theft, liability, or tenant-related damages. Calculation:Assumes 7% of gross rental income, unless insurance rates are specified.
Insurance:
| $553 |
Private Mortgage Insurance (PMI)A fee that borrowers pay when they take out a conventional loan with a loan-to-value (LTV) ratio above 80%.
Private mortgage insurance (PMI):
| $0 |
Monthly PaymentThe fixed amount a borrower pays each month to repay a loan. It typically includes principal and interest (P&I) and may also cover property taxes, insurance, HOA fees, and PMI if escrowed. Monthly payment:
| $11,720 |
Operating Income
| % Rent | Monthly | Yearly | |
|---|---|---|---|
Gross RentThe total rental income received from tenants before deducting any expenses. Includes base rent, late fees, pet fees, parking fees, and other recurring charges.
Gross rent:
| $7,900 | $94,800 | |
Vacancy LossExpected loss of rent due to vacancies.
Vacancy loss:
(6%)
| 6% | -$474 | -$5,688 |
Operating IncomeGross rental income minus vacancy loss. Calculation:Gross rent - Vacancy loss
Operating income:
| $7,426 | $89,112 |
Operating Expenses
| % Rent | Monthly | Yearly | |
|---|---|---|---|
Property TaxesAnnual taxes levied by local governments on real estate properties. These taxes fund public services like schools, roads, and emergency services. | 22% | -$1,726 | -$20,709 |
InsuranceThe costs for insurance coverage to protect against financial losses due to risks like fire, natural disasters, theft, liability, or tenant-related damages. Calculation:Assumes 7% of gross rental income, unless insurance rates are specified. | 7% | -$553 | -$6,636 |
Property ManagementThe costs associated with hiring a property manager to handle the day-to-day operations of a rental property. Includes management fees, leasing fes, eviction fees, etc. Calculation:Assumes 8% of gross rental income. | 8% | -$632 | -$7,584 |
Repairs & MaintenanceOngoing costs for routine upkeep and minor fixes needed to keep a property in good working condition. Calculation:Assumes 5% of gross rental income. Varies by property age and condition. | 5% | -$395 | -$4,740 |
Capital ExpensesLarge, infrequent costs for major improvements or replacements, like a new roof, HVAC system, or appliances. Calculation:Assumes 5% of gross rental income. Varies by property age. | 5% | -$395 | -$4,740 |
HOA FeesRegular dues paid to a Homeowners Association for community maintenance, amenities, and management. Similar fees include: Condo Association Fees, Co-op Maintenance Fees, etc. | n/a | n/a | n/a |
Operating ExpensesRecurring costs required to maintain and manage a rental property, including property taxes, insurance, maintenance, repairs, utilities (if paid by the owner), property management fees, and other day-to-day expenses. Calculation:Insurance + Property Taxes + Property Management + Repairs & Maintenance + Capital Expenditures + HOA Fees | 47% | -$3,701 | -$44,409 |
Cash Flow
| Monthly | Yearly | |
|---|---|---|
Net Operating Income (NOI)The income generated from a property after deducting all operating expenses but before deducting mortgage payments, taxes, and capital expenditures. Calculation:Gross Operating Income - Operating Expenses
Net operating income:
| $3,725 | $44,700 |
Mortgage PaymentThe fixed amount a borrower pays each month to repay a loan. It typically includes principal and interest (P&I) and may also cover property taxes, insurance, HOA fees, and PMI if escrowed. | -$9,441 | -$113,292 |
Cash FlowNet Operating Income (NOI) minus mortgage payments. Calculation:NOI - Mortgage Payments | $5,716 | $68,592 |