
$2,190,000
Investment Summary
- Monthly Cash Flow
- -$9,458
- Cap Rate
- 1.0%
- Cash-on-Cash Return
- -22.5%
- Debt Coverage Ratio
- 0.16
- Internal Rate of Return (5 years)
- -17.7%
Cash Flow
Net Operating Income (NOI) minus mortgage payments.
Calculation:
NOI - Mortgage Payments
Cap Rate (Market Value)
Capitalization Rate is a rate of return that compares the yearly Net Operating Income (NOI) to the market value.
Calculation:
NOI / Market Value
Cash-on-Cash Return (CoC)
Annual Cash Flow / Cash Invested
Calculation:
Annual cash flow divided by initial cash invested.
Debt Coverage Ratio (DCR)
Net Operating Income (NOI) divided by total debt payments.
Calculation:
NOI / Total Debt Payments
Internal Rate of Return (IRR)
A metric for assessing profitability over time. IRR is the discount rate at which the net present value (NPV) of all future cash flows (positive and negative) from an investment equals zero — including both periodic cash flow (such as rent) and a projected sale at the end of the holding period. It represents the expected annualized return, accounting for income, expenses, and the recovery of capital through a future sale.
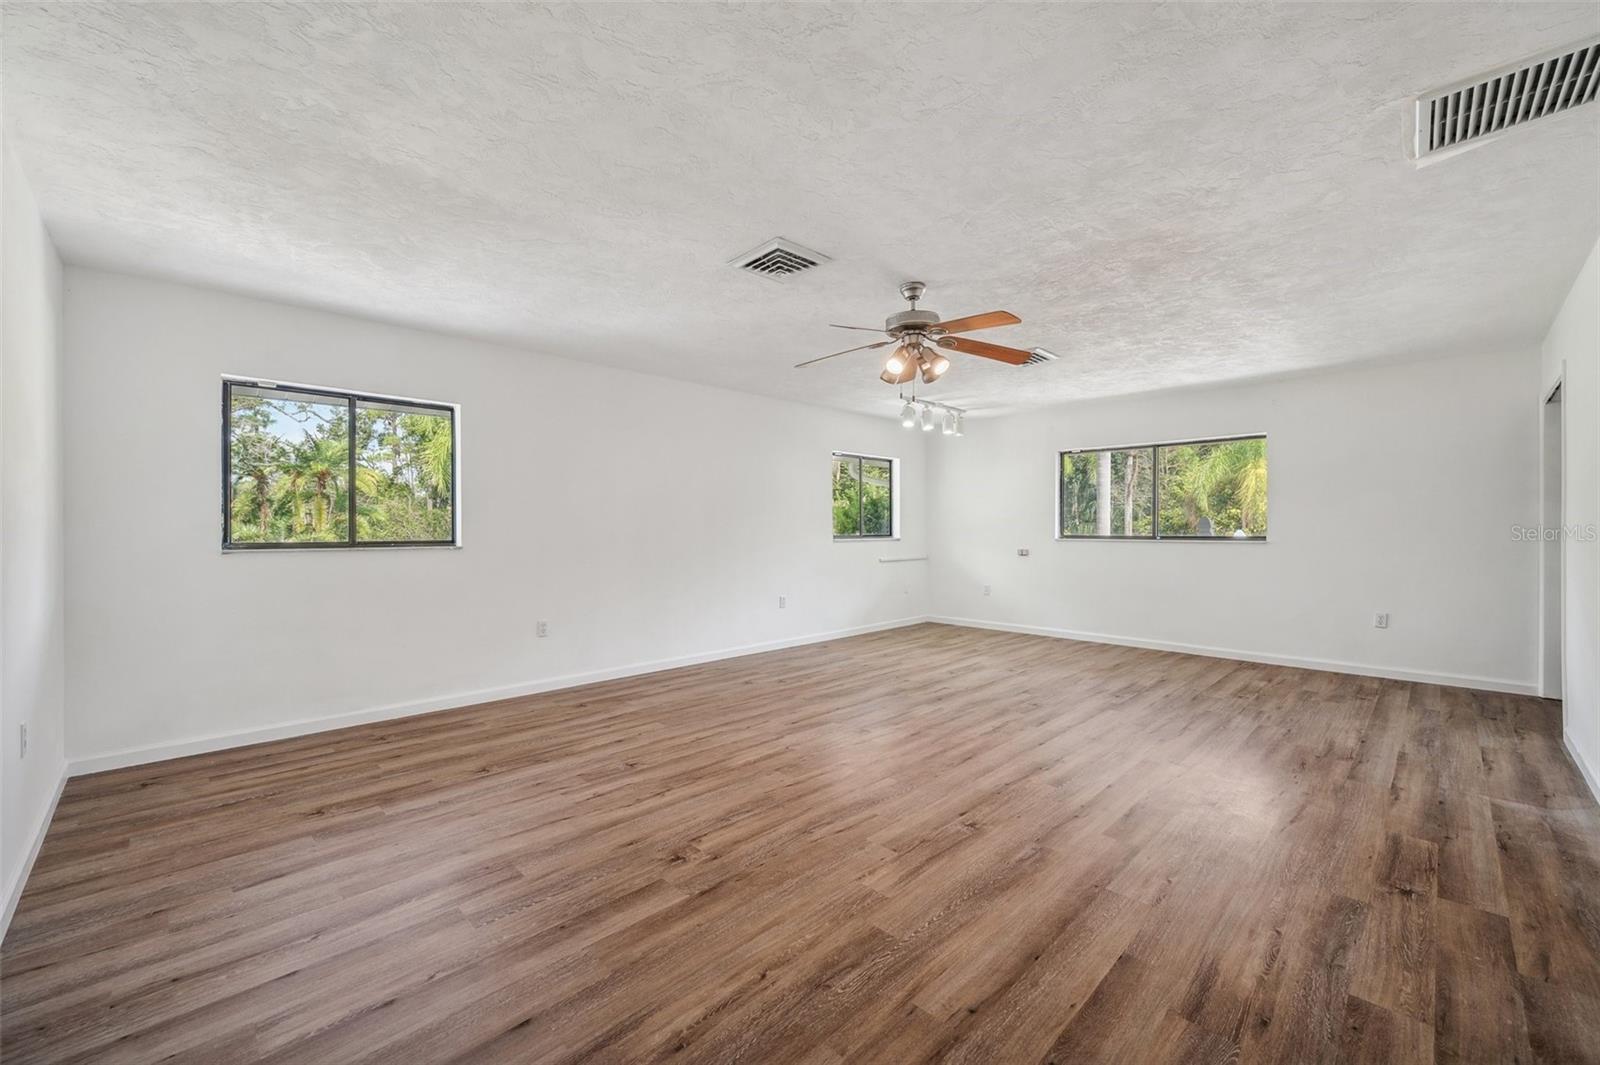
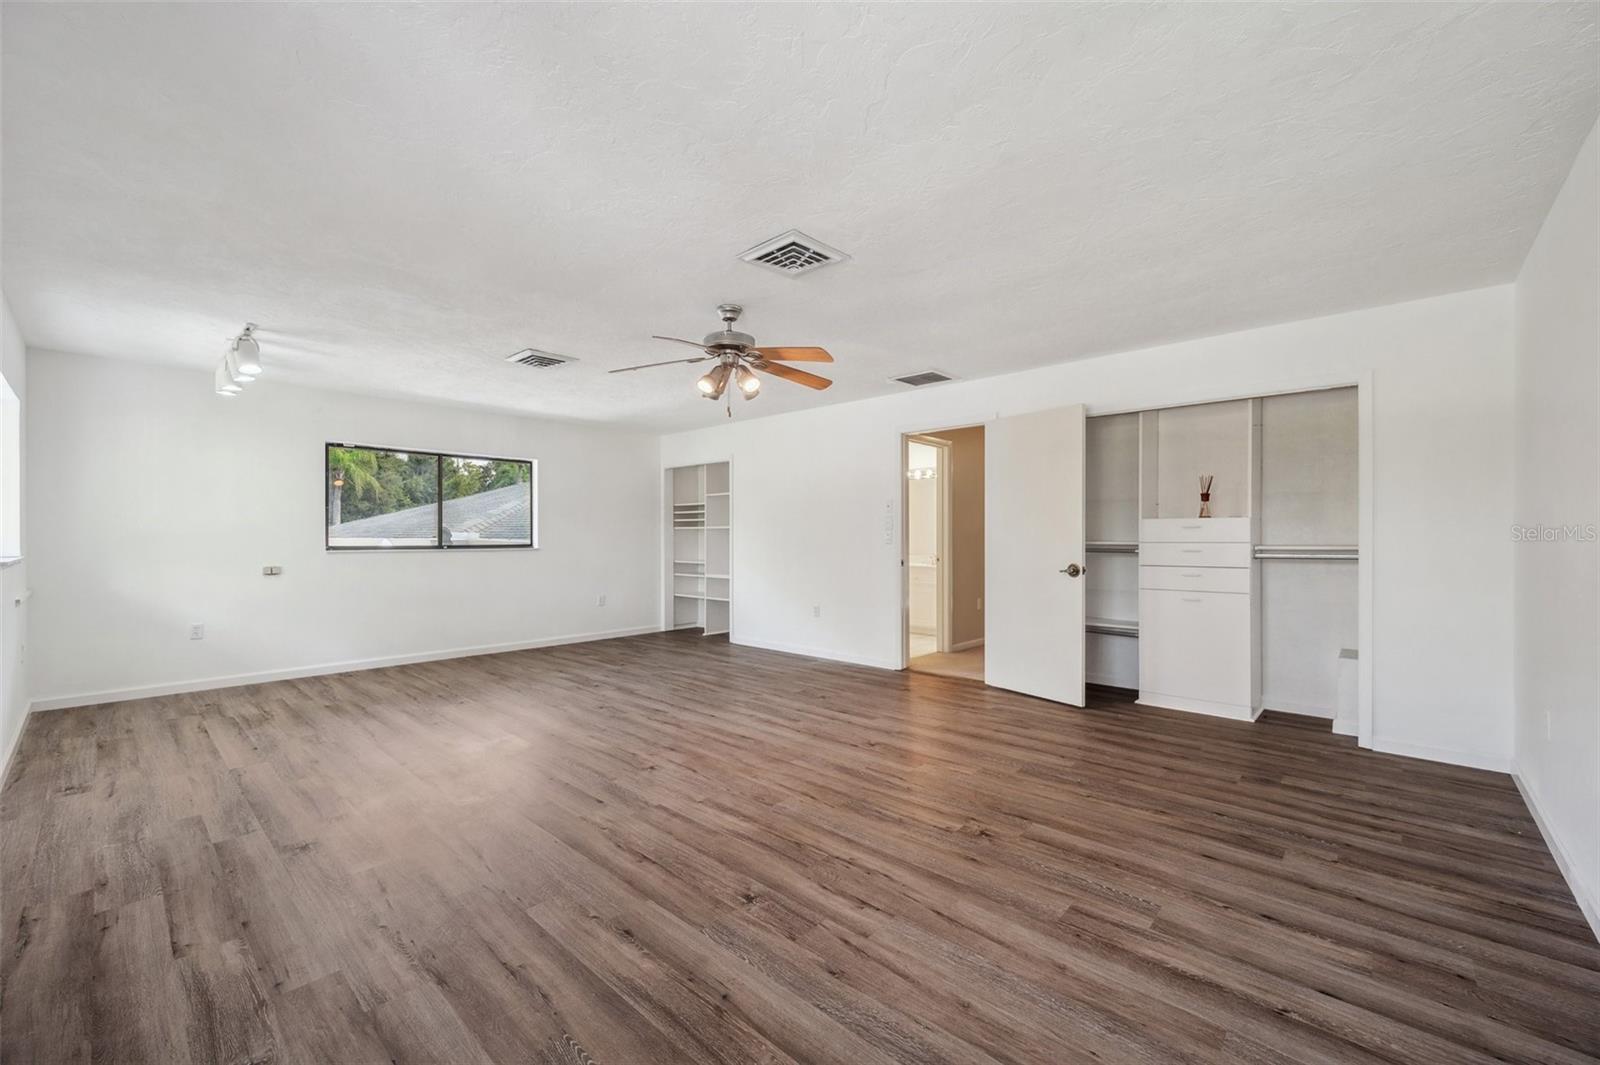
Property Description
One or more photo(s) has been virtually staged. This rare estate size mid-century modern split level home on 5 wooded acres seamlessly blends minimalist elegance with natural surroundings offering a peaceful private retreat. The main house is approx. 7,000 sqft of expansive living space with 5 bedrooms/5 baths that includes 4 en suites, each over 500 sqft. The front doors open to the 2d level living room with a view through the center of the home to the pool and backyard blurring the lines between indoor and outdoor living, reminiscent of the Sarasota School of Modern Architect embracing natural elements with old Florida charm. The back of the house has over 50 feet of ceiling to floor glass doors and windows filling the house with light. The 1st and 3rd levels open directly onto the large pool deck. The 1st level kitchen/dining room is approx 840 sqft and opens to the 810 sqft family room with a large wet bar with space for another full refrigerator. Centering the room is a travertine fireplace that warms the heart of the home in the winter. The en suite bedroom on the 1st level can also be used as a home gym. The 3rd level has 2 en suite bedrooms, including the primary, both with access to the balcony that stretches the length of the house, a great spot to enjoy morning coffee while watching the sun rise or for the band, choir, or music ensemble to entertain at your outdoor parties. There is also a built in office on the 3rd level that can easily be converted to a master dressing room or nursery. The 2d level faces the front of the house and has 2 more bedrooms, one an en suite and the other has a bathroom just outside its door to be shared with guests. An additional storage room and large laundry room are also on the 2d level. All of the bedrooms are large enough for king beds, sitting/study areas, with lots of storage. Each of the levels has a living room and library. The large front circular driveway can easily park 20 cars; has a basketball area; and an attached 3 car garage with a covered breezeway to enter the main house kitchen. The property is wrapped in trees offering privacy in a park like setting teeming with Florida wildlife and has several fruit trees and a large pond. Behind the main house is a separate, detached, 1 bedroom/1 bath cottage, approx. 1,000 sqft, with a fireplace/pizza oven and 30ft of glass doors. Further back is a separate detached workshop/storage building that can be converted to a barn. Horses are welcomed! Located in coveted Timberland Ranchettes, a neighborhood of 13 homes just 3 miles east of 75 and only 10 miles to Siesta Key, across from Skye Ranch. This exceptional property is ready for you to add your personal touches and create your own retreat.
Build Your Team
Quickly find investor-friendly professionals who can help you succeed in real estate investing at any stage of the investing journey.


Agents
Match with investor-friendly agents who can help you find, analyze, and close your next deal


Lenders
Get the best funding…find investor-friendly lenders who specialize in your deal strategy


Property Managers
Transition to passive investing. Find a trusted property management partnership that lasts.


Tax Pros & Accountants
Taxes and financial reporting made easy—find experts to create tax savings strategies, file taxes, and more
Location
Property Details
Parking
- Description: Circular Driveway, Driveway
- Details: Circular Driveway, Driveway
- Garage Spaces: 3
- Spaces Total: 0
Bedroom Information
- # of Bedrooms: 5
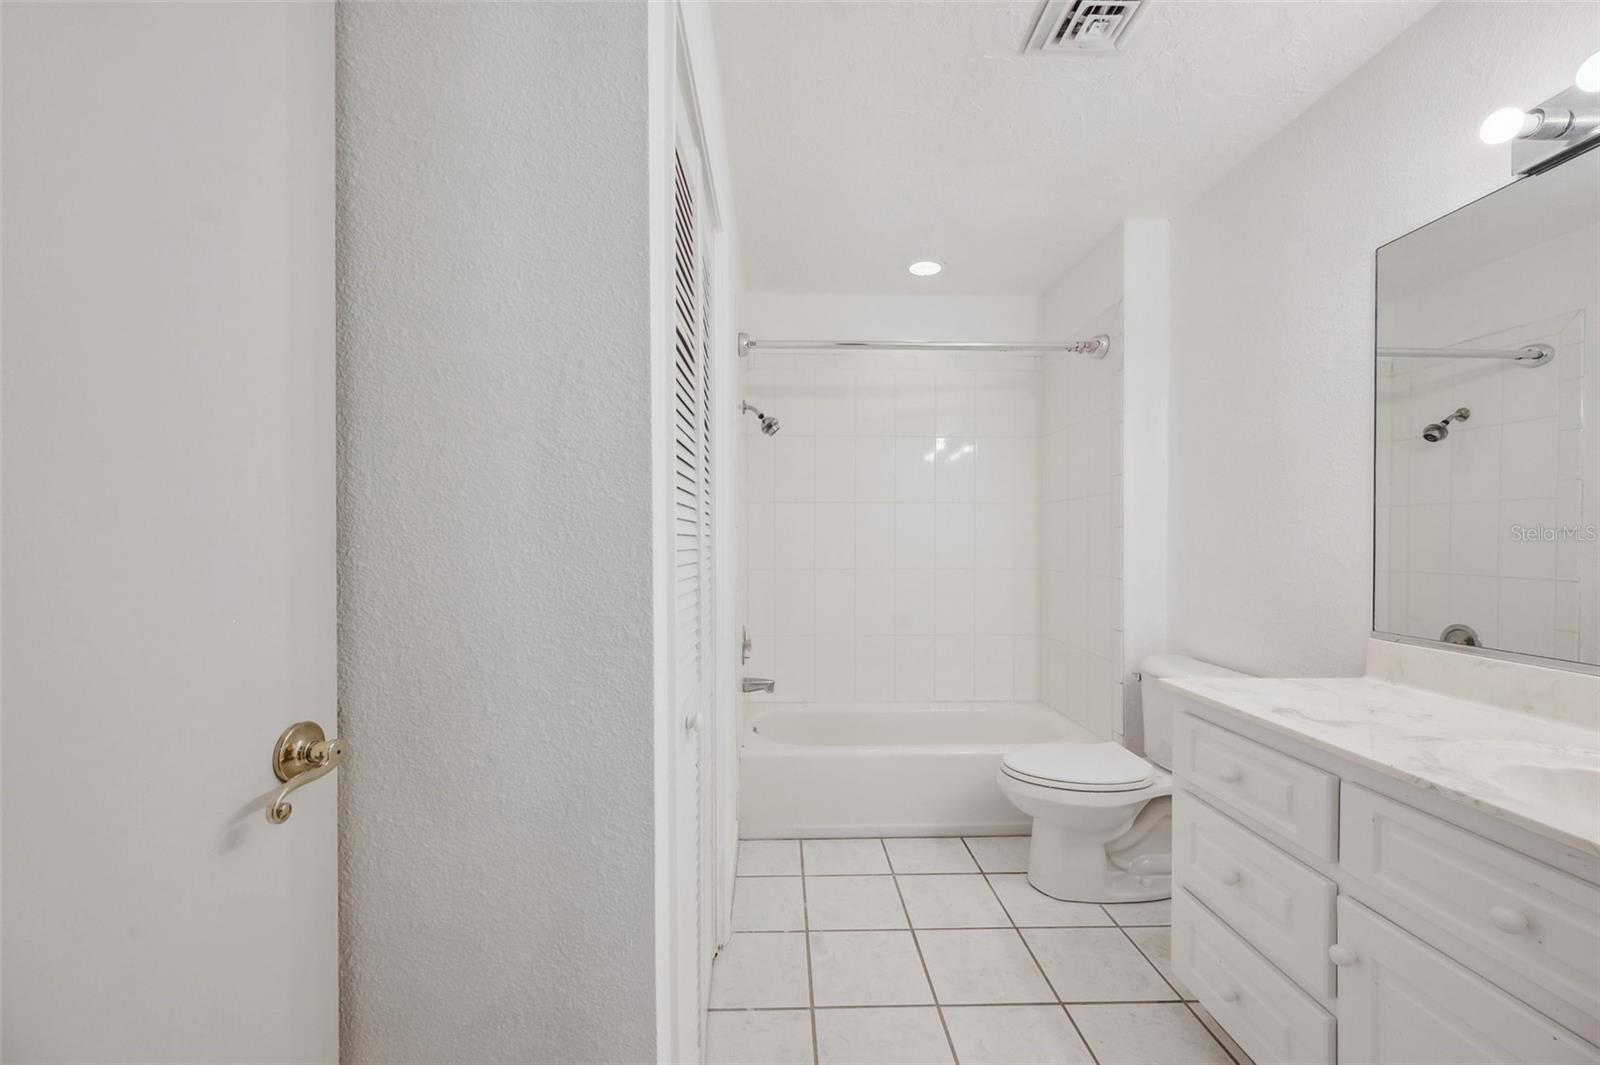
Bathroom Information
- # of Baths (Full): 5
- # of Baths (Total): 5.0
Interior Features
- # of Rooms: 15
- # of Stories: 3
- Fireplace: Yes
Exterior Features
- Exterior Walls Materials: Stucco
- Foundation: Block, Slab
- Roof Type: Hip
- Roof Material: Shingle
- Pool: Yes
HOA
- Has HOA: Yes
- Association: Frances Morgan
- HOA Fee: $375/quarterly
Land Information
- Land Use: Residential
- Land Use Subtype: Multi-Family Dwellings (any combination 2+)
Lot Information
- Parcel ID: 0282010110
- Lot Size: 217803 sqft
Property Information
- Property Type: Single Family Residence
- Style: Mid-Century Modern
- Year Built: 1977
Tax Information
- Annual Tax: $9,676
Utilities
- Water & Sewer: Private, Well
- Heating: Central, Electric, Zoned
- Cooling: Central Air, Zoned
Location
- County: Sarasota
Listing Details
Investment Summary
- Monthly Cash Flow
- -$9,458
- Cap Rate
- 1.0%
- Cash-on-Cash Return
- -22.5%
- Debt Coverage Ratio
- 0.16
- Internal Rate of Return (5 years)
- -17.7%
Cash Flow
Net Operating Income (NOI) minus mortgage payments.
Calculation:
NOI - Mortgage Payments
Cap Rate (Market Value)
Capitalization Rate is a rate of return that compares the yearly Net Operating Income (NOI) to the market value.
Calculation:
NOI / Market Value
Cash-on-Cash Return (CoC)
Annual Cash Flow / Cash Invested
Calculation:
Annual cash flow divided by initial cash invested.
Debt Coverage Ratio (DCR)
Net Operating Income (NOI) divided by total debt payments.
Calculation:
NOI / Total Debt Payments
Internal Rate of Return (IRR)
A metric for assessing profitability over time. IRR is the discount rate at which the net present value (NPV) of all future cash flows (positive and negative) from an investment equals zero — including both periodic cash flow (such as rent) and a projected sale at the end of the holding period. It represents the expected annualized return, accounting for income, expenses, and the recovery of capital through a future sale.
Purchase Details
Purchase PriceThe price paid for the property. Purchase price:
| $2,190,000 |
|---|---|
Amount FinancedThe amount of the purchase financed through a loan. Amount financed:
| -$1,752,000 |
Down paymentThe initial payment made towards the purchase. Down payment:
| $438,000 |
Closing CostsFees and expenses associated with purchasing a property, typically ranging from 2% to 5% of the home’s purchase price, paid at the end of a home purchase to cover services like lending, title transfer, and taxes. Closing costs:
| $65,700 |
Rehab CostsCosts incurred to repair or improve the property, including: roof, flooring, exterior siding, kitchen, exterior paint, bathrooms, etc. Rehab costs:
| $0 |
Initial Cash InvestedThe total initial cash invested in the property. Calculation:Down payment + Buying costs + Rehab costs Initial cash invested:
| $503,700 |
Square Feet (SQFT)The total square footage of the property. Square feet:
| 7,544 |
Cost Per Square FootCost per square foot of the property. Calculation:Purchase Price / Square Feet Cost per square foot:
| $290 |
Monthly Rent Per Square FootMonthly rent divided by the number of square feet. This ratio helps investors compare rental income efficiency across properties, markets, and unit sizes Calculation:Monthly Rent / Square Feet Monthly rent per square foot:
| $0.52 |
Financing Details
Loan AmountThe total sum of money borrowed from a lender to finance a property purchase. Calculation:Purchase Price - Down Payment
Loan amount:
| $1,752,000 |
|---|---|
Loan to Value Ratio (LTV)Loan amount divided by the market value of the property. Calculation:Loan Amount / Market Value
Loan to value ratio:
| 80.0% |
Loan TypeThe type of loan (e.g., fixed, adjustable).
Loan type:
| Amortizing |
TermThe loan repayment period in years.
Term:
| 30 years |
Interest RateThe percentage a lender charges on the borrowed amount of a loan, determining the cost of borrowing money.
Interest rate:
| 6.625% |
Principal & Interest (PI)The principal is the portion of the loan payment that reduces the loan balance. The interest is the lender's charge for borrowing money. Calculation:(P * r * (1 + r) ** n) / ((1 + r) ** n - 1) Where:
P = Loan amount (principal)
Principal & interest:
| $11,218 |
Property TaxesAnnual taxes levied by local governments on real estate properties. These taxes fund public services like schools, roads, and emergency services.
Property tax:
| $806 |
InsuranceThe costs for insurance coverage to protect against financial losses due to risks like fire, natural disasters, theft, liability, or tenant-related damages. Calculation:Assumes 7% of gross rental income, unless insurance rates are specified.
Insurance:
| $273 |
Private Mortgage Insurance (PMI)A fee that borrowers pay when they take out a conventional loan with a loan-to-value (LTV) ratio above 80%.
Private mortgage insurance (PMI):
| $0 |
Monthly PaymentThe fixed amount a borrower pays each month to repay a loan. It typically includes principal and interest (P&I) and may also cover property taxes, insurance, HOA fees, and PMI if escrowed. Monthly payment:
| $12,297 |
Operating Income
| % Rent | Monthly | Yearly | |
|---|---|---|---|
Gross RentThe total rental income received from tenants before deducting any expenses. Includes base rent, late fees, pet fees, parking fees, and other recurring charges.
Gross rent:
| $3,900 | $46,800 | |
Vacancy LossExpected loss of rent due to vacancies.
Vacancy loss:
(6%)
| 6% | -$234 | -$2,808 |
Operating IncomeGross rental income minus vacancy loss. Calculation:Gross rent - Vacancy loss
Operating income:
| $3,666 | $43,992 |
Operating Expenses
| % Rent | Monthly | Yearly | |
|---|---|---|---|
Property TaxesAnnual taxes levied by local governments on real estate properties. These taxes fund public services like schools, roads, and emergency services. | 21% | -$806 | -$9,676 |
InsuranceThe costs for insurance coverage to protect against financial losses due to risks like fire, natural disasters, theft, liability, or tenant-related damages. Calculation:Assumes 7% of gross rental income, unless insurance rates are specified. | 7% | -$273 | -$3,276 |
Property ManagementThe costs associated with hiring a property manager to handle the day-to-day operations of a rental property. Includes management fees, leasing fes, eviction fees, etc. Calculation:Assumes 8% of gross rental income. | 8% | -$312 | -$3,744 |
Repairs & MaintenanceOngoing costs for routine upkeep and minor fixes needed to keep a property in good working condition. Calculation:Assumes 5% of gross rental income. Varies by property age and condition. | 5% | -$195 | -$2,340 |
Capital ExpensesLarge, infrequent costs for major improvements or replacements, like a new roof, HVAC system, or appliances. Calculation:Assumes 5% of gross rental income. Varies by property age. | 5% | -$195 | -$2,340 |
HOA FeesRegular dues paid to a Homeowners Association for community maintenance, amenities, and management. Similar fees include: Condo Association Fees, Co-op Maintenance Fees, etc. | 3% | -$125 | -$1,500 |
Operating ExpensesRecurring costs required to maintain and manage a rental property, including property taxes, insurance, maintenance, repairs, utilities (if paid by the owner), property management fees, and other day-to-day expenses. Calculation:Insurance + Property Taxes + Property Management + Repairs & Maintenance + Capital Expenditures + HOA Fees | 49% | -$1,906 | -$22,876 |
Cash Flow
| Monthly | Yearly | |
|---|---|---|
Net Operating Income (NOI)The income generated from a property after deducting all operating expenses but before deducting mortgage payments, taxes, and capital expenditures. Calculation:Gross Operating Income - Operating Expenses
Net operating income:
| $1,760 | $21,120 |
Mortgage PaymentThe fixed amount a borrower pays each month to repay a loan. It typically includes principal and interest (P&I) and may also cover property taxes, insurance, HOA fees, and PMI if escrowed. | -$11,218 | -$134,616 |
Cash FlowNet Operating Income (NOI) minus mortgage payments. Calculation:NOI - Mortgage Payments | $9,458 | $113,496 |