
$3,300,000
Investment Summary
- Monthly Cash Flow
- -$14,186
- Cap Rate
- 0.5%
- Cash-on-Cash Return
- -22.4%
- Debt Coverage Ratio
- 0.09
- Internal Rate of Return (5 years)
- -17.6%
Cash Flow
Net Operating Income (NOI) minus mortgage payments.
Calculation:
NOI - Mortgage Payments
Cap Rate (Market Value)
Capitalization Rate is a rate of return that compares the yearly Net Operating Income (NOI) to the market value.
Calculation:
NOI / Market Value
Cash-on-Cash Return (CoC)
Annual Cash Flow / Cash Invested
Calculation:
Annual cash flow divided by initial cash invested.
Debt Coverage Ratio (DCR)
Net Operating Income (NOI) divided by total debt payments.
Calculation:
NOI / Total Debt Payments
Internal Rate of Return (IRR)
A metric for assessing profitability over time. IRR is the discount rate at which the net present value (NPV) of all future cash flows (positive and negative) from an investment equals zero — including both periodic cash flow (such as rent) and a projected sale at the end of the holding period. It represents the expected annualized return, accounting for income, expenses, and the recovery of capital through a future sale.
Property Description
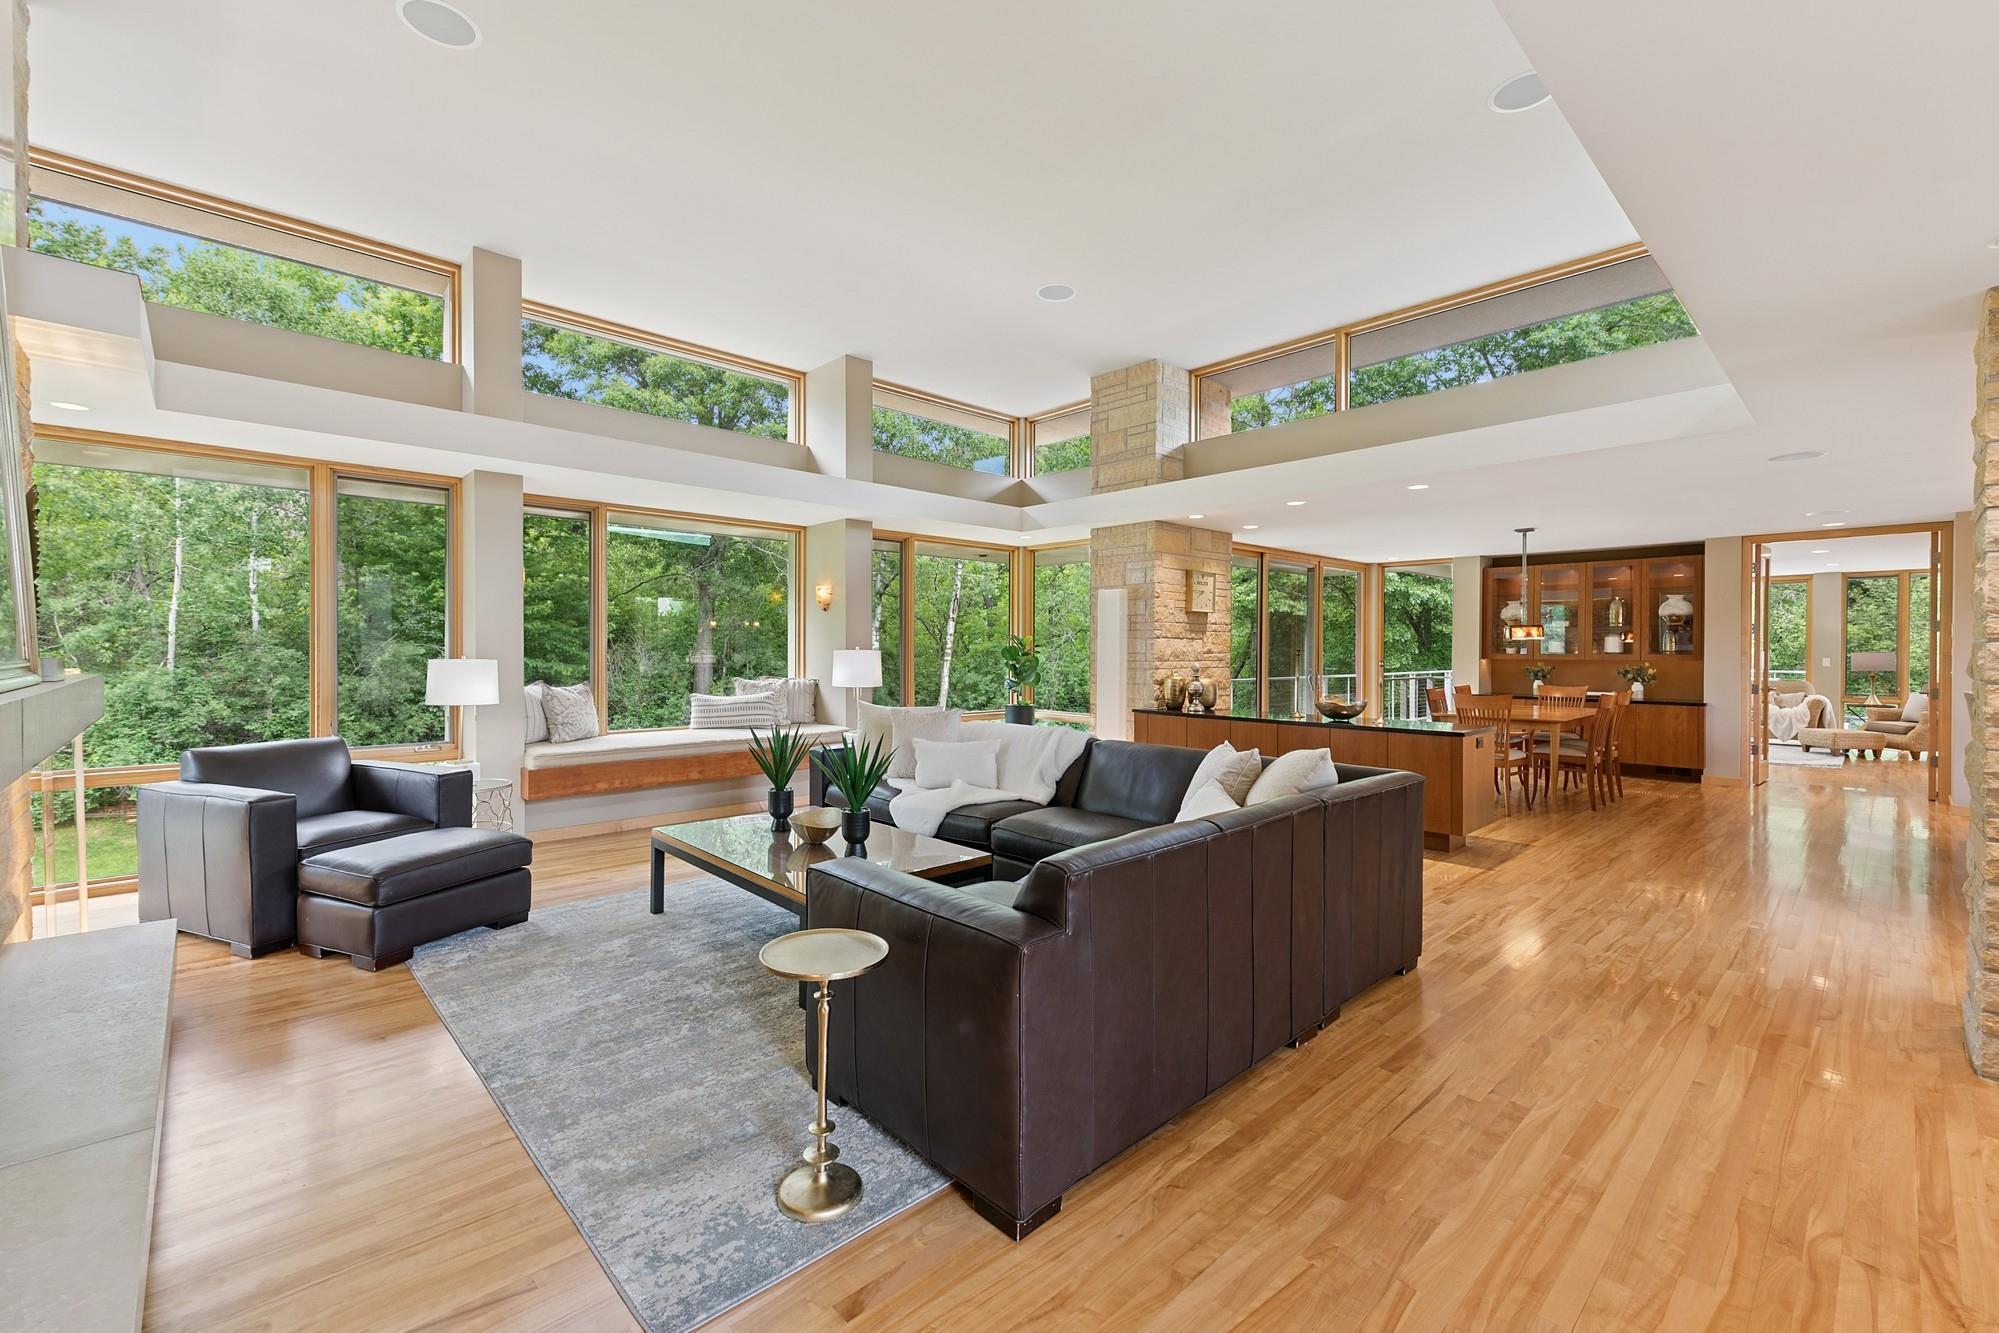
Artful Architecture that truly embraces the ample green spaces of this acreage setting. These are distinguishing aspects of this crowning achievement by an award winning Architect of international acclaim, Charles Stinson & carefully constructed by Streeter. Privacy without isolation as thoughtful placement of windows & landscape designed to assure great sightlines! Reward yourself with dual baths in a main floor owner's suite! Truly spa-inspired, both owner's baths offer remarkable & distinctly individual features. Technical brilliance by Lutron Lighting systems in multiple areas give you the ideal controls for a variety of lighting options. The clerestory great room is absolutely awe-inspiring, a daily delight for you & so impressive for guests, even Realtors have said "Wow!" here. Plus, a wealth of natural light is here, even in the lower level with multiple walk-outs. An Oscar worthy home theater is here with raked audience seating that grants 18 people a spectacular view of the very large TV screen. Acoustics in this home cinema were professionally designed for great sound throughout the theater. Ideal cinematic experiences start here & they start whenever you wish! You set the rules on phones in this cinema. Backstage, a huge finished space gives you a prep area to stage live events. Do you want an elevator? Yes, there's a space for that too, currently functioning as triple stacked walk-in closets just off hallways. In addition to a game room, another space accommodates a pool table & this flows gracefully to a family room with fireplace. Education pursuits have their place in the upstairs study, so your main floor office is just for you. Plus, there is another large room with cabinets & a walk-in closet that is currently seen as an art studio, that could become your 2nd office, a music room & more. The 4 season porch, just off the studio has independent A/c & heating, with sliding patio glass doors on 3 sides. Enjoy the great outdoors, all 4 decks, a pair of patios, a 4 season porch & the sport court all offer amazing functionality & blissful privacy. Daily ease of living is free of friction. Plus, you & your grateful guests are sure to savor fond memories made here. Your joyful celebrations have ideal spaces here! Nearby, a trio of private golf courses & one public golf course offer you extra recreation. Also, dining, shopping & a boat launch on the river lets you see the Twin Cities from a splendid perspective. With technological enhancements, strategic solar gain this private acreage estate within the city deserves your consideration. Grasp the opportunity for a private tour to see all this home & setting have to offer!
Build Your Team
Quickly find investor-friendly professionals who can help you succeed in real estate investing at any stage of the investing journey.


Agents
Match with investor-friendly agents who can help you find, analyze, and close your next deal


Lenders
Get the best funding…find investor-friendly lenders who specialize in your deal strategy


Property Managers
Transition to passive investing. Find a trusted property management partnership that lasts.


Tax Pros & Accountants
Taxes and financial reporting made easy—find experts to create tax savings strategies, file taxes, and more
Location
Property Details
Parking
- Description: Finished
- Details: Garage Door Opener, Storage, Garage
- Garage Spaces: 4
- Spaces Total: 0
Bedroom Information
- # of Bedrooms: 5
Bathroom Information
- # of Baths (Full): 4
- # of Baths (Total): 8.0
Interior Features
- # of Rooms: 23
- # of Stories: 2
- Basement: Yes
- Basement Description: Sump Pump
- Fireplace: Yes
Exterior Features
- Foundation: Concrete Perimeter
- Roof Material: Flat
HOA
- Has HOA: Yes
- HOA Fee: $1,700/annually
Land Information
- Land Use: Residential
- Land Use Subtype: Single Family Residential
Lot Information
- Parcel ID: 273250001040
- Lot Size: 58806 sqft
Property Information
- Property Type: Single Family Residence
- Style: (SF) Single Family
- Year Built: 2009
Tax Information
- Annual Tax: $23,352
Utilities
- Water & Sewer: Public
- Heating: Forced Air, Hot Water, Zoned, Other, Humidity Control, Radiant Floor
- Cooling: Zoned, Central Air, Wall Unit(s)
Location
- County: Dakota
Listing Details
Investment Summary
- Monthly Cash Flow
- -$14,186
- Cap Rate
- 0.5%
- Cash-on-Cash Return
- -22.4%
- Debt Coverage Ratio
- 0.09
- Internal Rate of Return (5 years)
- -17.6%
Cash Flow
Net Operating Income (NOI) minus mortgage payments.
Calculation:
NOI - Mortgage Payments
Cap Rate (Market Value)
Capitalization Rate is a rate of return that compares the yearly Net Operating Income (NOI) to the market value.
Calculation:
NOI / Market Value
Cash-on-Cash Return (CoC)
Annual Cash Flow / Cash Invested
Calculation:
Annual cash flow divided by initial cash invested.
Debt Coverage Ratio (DCR)
Net Operating Income (NOI) divided by total debt payments.
Calculation:
NOI / Total Debt Payments
Internal Rate of Return (IRR)
A metric for assessing profitability over time. IRR is the discount rate at which the net present value (NPV) of all future cash flows (positive and negative) from an investment equals zero — including both periodic cash flow (such as rent) and a projected sale at the end of the holding period. It represents the expected annualized return, accounting for income, expenses, and the recovery of capital through a future sale.
Purchase Details
Purchase PriceThe price paid for the property. Purchase price:
| $3,300,000 |
|---|---|
Amount FinancedThe amount of the purchase financed through a loan. Amount financed:
| -$2,640,000 |
Down paymentThe initial payment made towards the purchase. Down payment:
| $660,000 |
Closing CostsFees and expenses associated with purchasing a property, typically ranging from 2% to 5% of the home’s purchase price, paid at the end of a home purchase to cover services like lending, title transfer, and taxes. Closing costs:
| $99,000 |
Rehab CostsCosts incurred to repair or improve the property, including: roof, flooring, exterior siding, kitchen, exterior paint, bathrooms, etc. Rehab costs:
| $0 |
Initial Cash InvestedThe total initial cash invested in the property. Calculation:Down payment + Buying costs + Rehab costs Initial cash invested:
| $759,000 |
Square Feet (SQFT)The total square footage of the property. Square feet:
| 9,272 |
Cost Per Square FootCost per square foot of the property. Calculation:Purchase Price / Square Feet Cost per square foot:
| $356 |
Monthly Rent Per Square FootMonthly rent divided by the number of square feet. This ratio helps investors compare rental income efficiency across properties, markets, and unit sizes Calculation:Monthly Rent / Square Feet Monthly rent per square foot:
| $0.55 |
Financing Details
Loan AmountThe total sum of money borrowed from a lender to finance a property purchase. Calculation:Purchase Price - Down Payment
Loan amount:
| $2,640,000 |
|---|---|
Loan to Value Ratio (LTV)Loan amount divided by the market value of the property. Calculation:Loan Amount / Market Value
Loan to value ratio:
| 80.0% |
Loan TypeThe type of loan (e.g., fixed, adjustable).
Loan type:
| Amortizing |
TermThe loan repayment period in years.
Term:
| 30 years |
Interest RateThe percentage a lender charges on the borrowed amount of a loan, determining the cost of borrowing money.
Interest rate:
| 5.875% |
Principal & Interest (PI)The principal is the portion of the loan payment that reduces the loan balance. The interest is the lender's charge for borrowing money. Calculation:(P * r * (1 + r) ** n) / ((1 + r) ** n - 1) Where:
P = Loan amount (principal)
Principal & interest:
| $15,617 |
Property TaxesAnnual taxes levied by local governments on real estate properties. These taxes fund public services like schools, roads, and emergency services.
Property tax:
| $1,946 |
InsuranceThe costs for insurance coverage to protect against financial losses due to risks like fire, natural disasters, theft, liability, or tenant-related damages. Calculation:Assumes 7% of gross rental income, unless insurance rates are specified.
Insurance:
| $357 |
Private Mortgage Insurance (PMI)A fee that borrowers pay when they take out a conventional loan with a loan-to-value (LTV) ratio above 80%.
Private mortgage insurance (PMI):
| $0 |
Monthly PaymentThe fixed amount a borrower pays each month to repay a loan. It typically includes principal and interest (P&I) and may also cover property taxes, insurance, HOA fees, and PMI if escrowed. Monthly payment:
| $17,920 |
Operating Income
| % Rent | Monthly | Yearly | |
|---|---|---|---|
Gross RentThe total rental income received from tenants before deducting any expenses. Includes base rent, late fees, pet fees, parking fees, and other recurring charges.
Gross rent:
| $5,100 | $61,200 | |
Vacancy LossExpected loss of rent due to vacancies.
Vacancy loss:
(6%)
| 6% | -$306 | -$3,672 |
Operating IncomeGross rental income minus vacancy loss. Calculation:Gross rent - Vacancy loss
Operating income:
| $4,794 | $57,528 |
Operating Expenses
| % Rent | Monthly | Yearly | |
|---|---|---|---|
Property TaxesAnnual taxes levied by local governments on real estate properties. These taxes fund public services like schools, roads, and emergency services. | 38% | -$1,946 | -$23,352 |
InsuranceThe costs for insurance coverage to protect against financial losses due to risks like fire, natural disasters, theft, liability, or tenant-related damages. Calculation:Assumes 7% of gross rental income, unless insurance rates are specified. | 7% | -$357 | -$4,284 |
Property ManagementThe costs associated with hiring a property manager to handle the day-to-day operations of a rental property. Includes management fees, leasing fes, eviction fees, etc. Calculation:Assumes 8% of gross rental income. | 8% | -$408 | -$4,896 |
Repairs & MaintenanceOngoing costs for routine upkeep and minor fixes needed to keep a property in good working condition. Calculation:Assumes 5% of gross rental income. Varies by property age and condition. | 5% | -$255 | -$3,060 |
Capital ExpensesLarge, infrequent costs for major improvements or replacements, like a new roof, HVAC system, or appliances. Calculation:Assumes 5% of gross rental income. Varies by property age. | 5% | -$255 | -$3,060 |
HOA FeesRegular dues paid to a Homeowners Association for community maintenance, amenities, and management. Similar fees include: Condo Association Fees, Co-op Maintenance Fees, etc. | 3% | -$142 | -$1,704 |
Operating ExpensesRecurring costs required to maintain and manage a rental property, including property taxes, insurance, maintenance, repairs, utilities (if paid by the owner), property management fees, and other day-to-day expenses. Calculation:Insurance + Property Taxes + Property Management + Repairs & Maintenance + Capital Expenditures + HOA Fees | 66% | -$3,363 | -$40,356 |
Cash Flow
| Monthly | Yearly | |
|---|---|---|
Net Operating Income (NOI)The income generated from a property after deducting all operating expenses but before deducting mortgage payments, taxes, and capital expenditures. Calculation:Gross Operating Income - Operating Expenses
Net operating income:
| $1,431 | $17,172 |
Mortgage PaymentThe fixed amount a borrower pays each month to repay a loan. It typically includes principal and interest (P&I) and may also cover property taxes, insurance, HOA fees, and PMI if escrowed. | -$15,617 | -$187,404 |
Cash FlowNet Operating Income (NOI) minus mortgage payments. Calculation:NOI - Mortgage Payments | -$14,186 | -$170,232 |