$385,000
Investment Summary
- Monthly Cash Flow
- -$537
- Cap Rate
- 4.6%
- Cash-on-Cash Return
- -7.3%
- Debt Coverage Ratio
- 0.73
- Internal Rate of Return (5 years)
- -3.1%
Cash Flow
Net Operating Income (NOI) minus mortgage payments.
Calculation:
NOI - Mortgage Payments
Cap Rate (Market Value)
Capitalization Rate is a rate of return that compares the yearly Net Operating Income (NOI) to the market value.
Calculation:
NOI / Market Value
Cash-on-Cash Return (CoC)
Annual Cash Flow / Cash Invested
Calculation:
Annual cash flow divided by initial cash invested.
Debt Coverage Ratio (DCR)
Net Operating Income (NOI) divided by total debt payments.
Calculation:
NOI / Total Debt Payments
Internal Rate of Return (IRR)
A metric for assessing profitability over time. IRR is the discount rate at which the net present value (NPV) of all future cash flows (positive and negative) from an investment equals zero — including both periodic cash flow (such as rent) and a projected sale at the end of the holding period. It represents the expected annualized return, accounting for income, expenses, and the recovery of capital through a future sale.
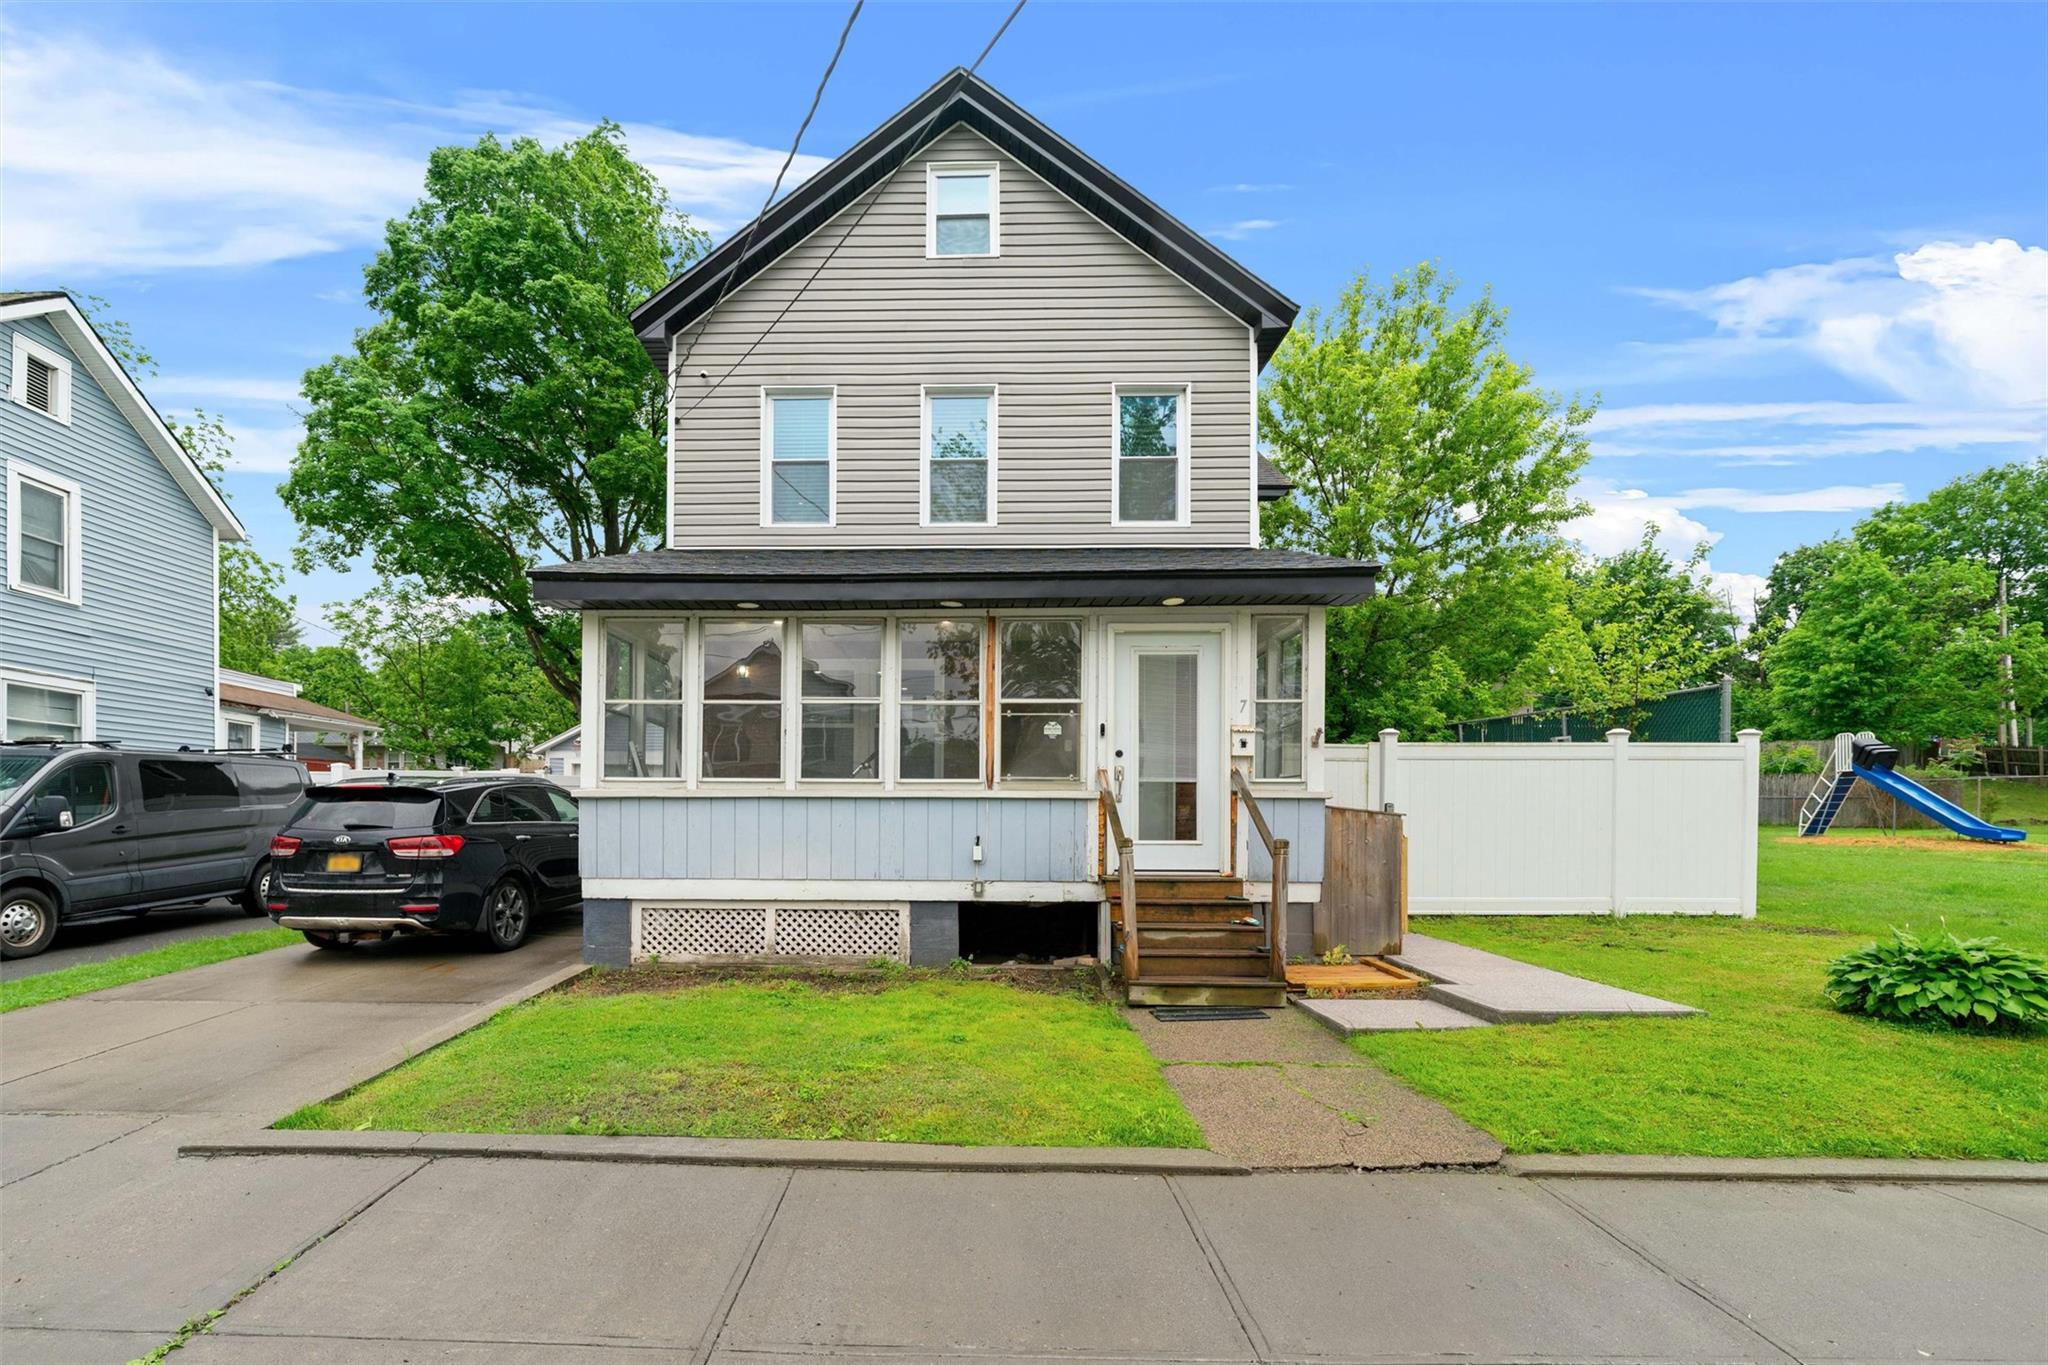
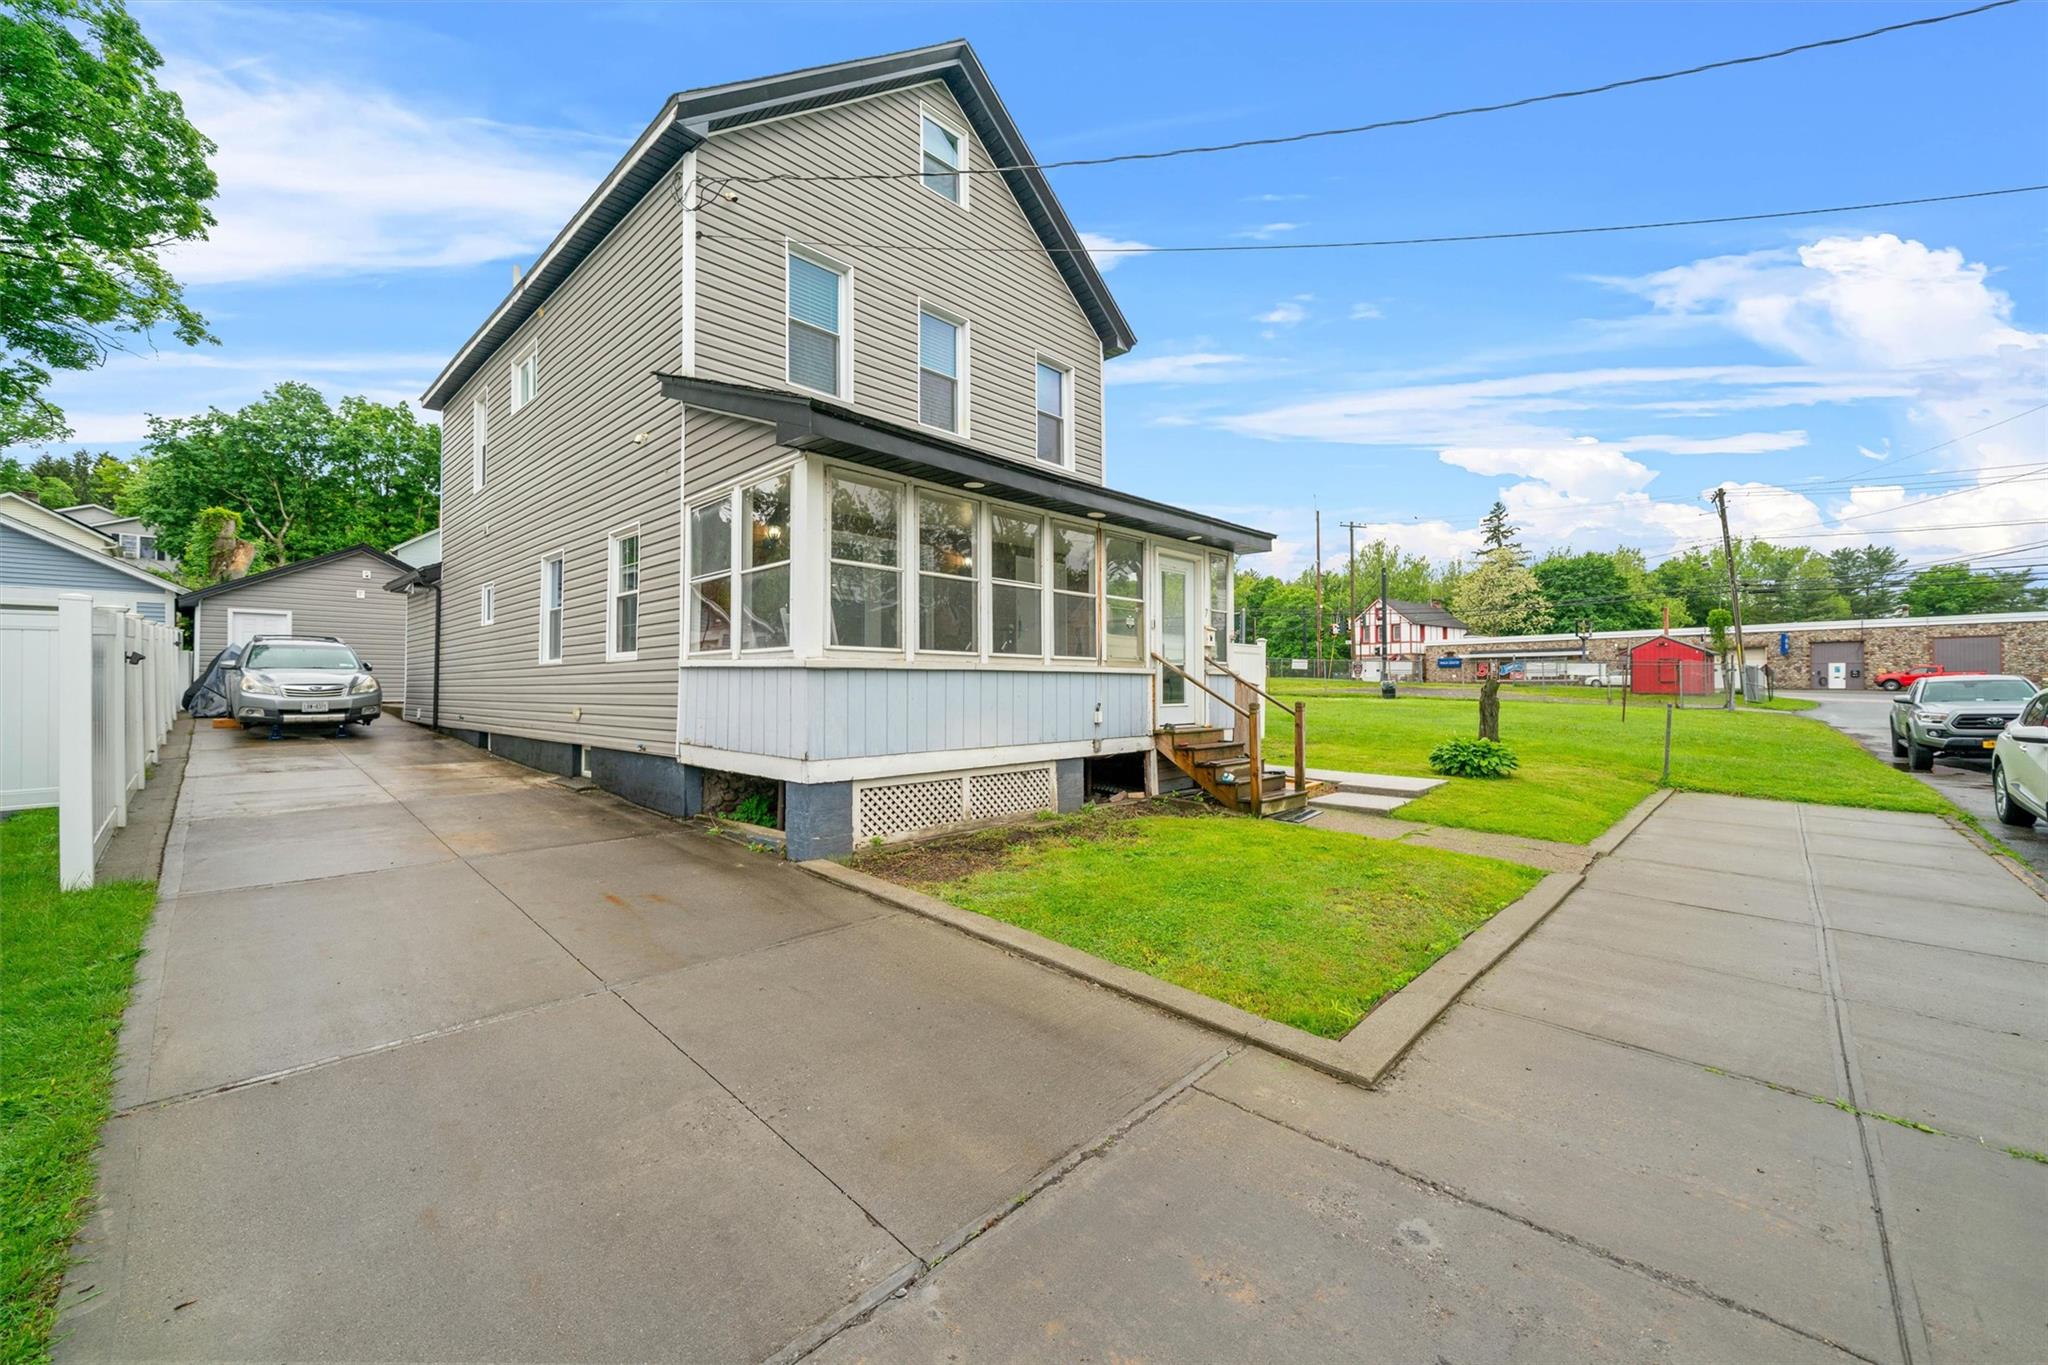
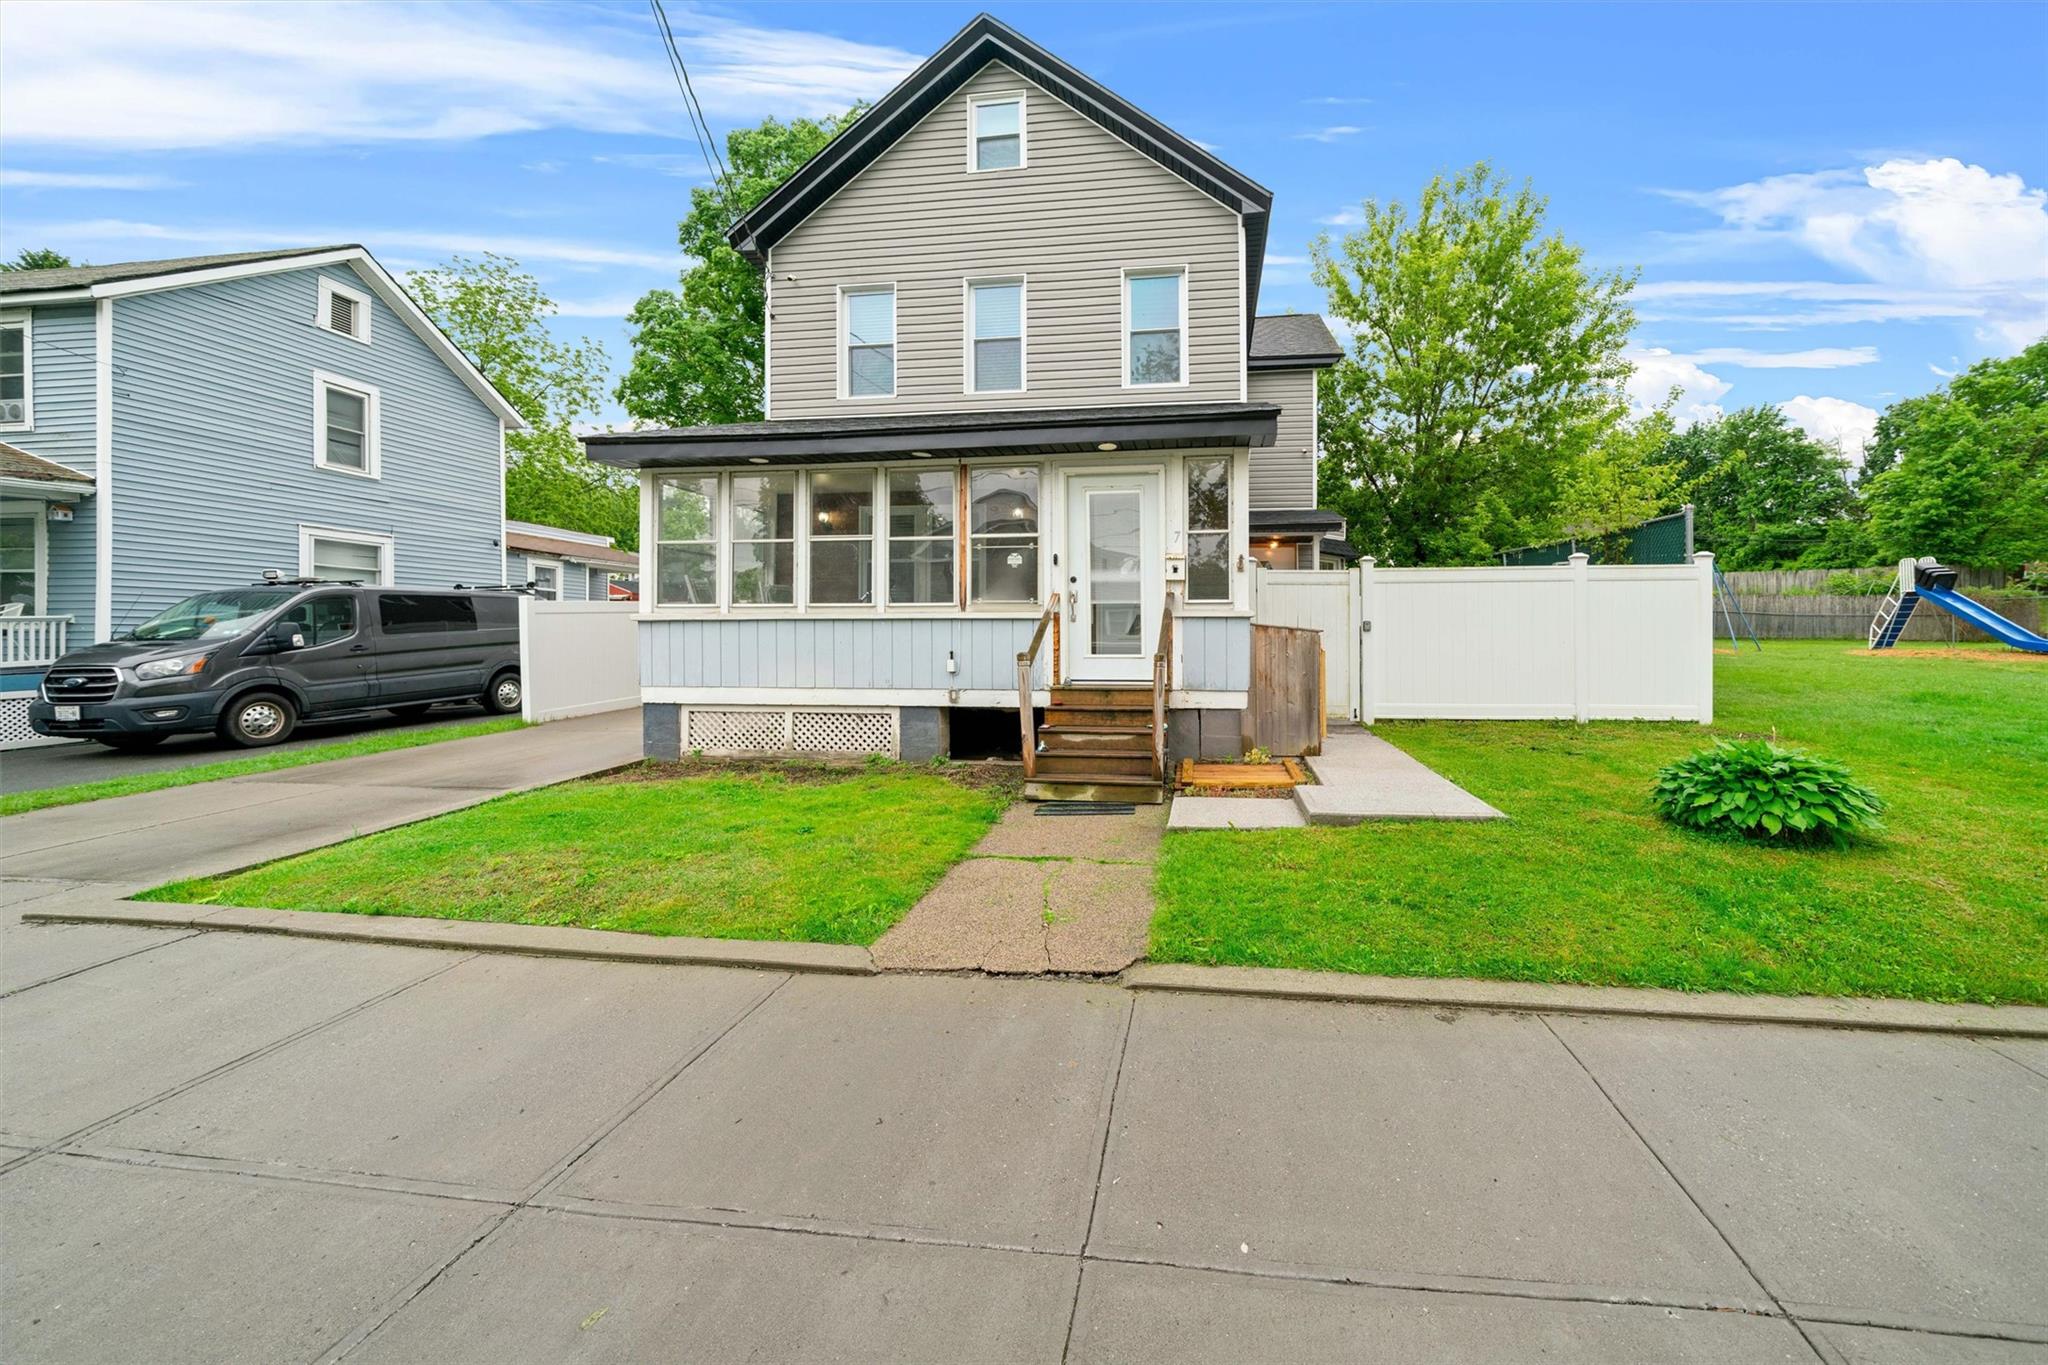
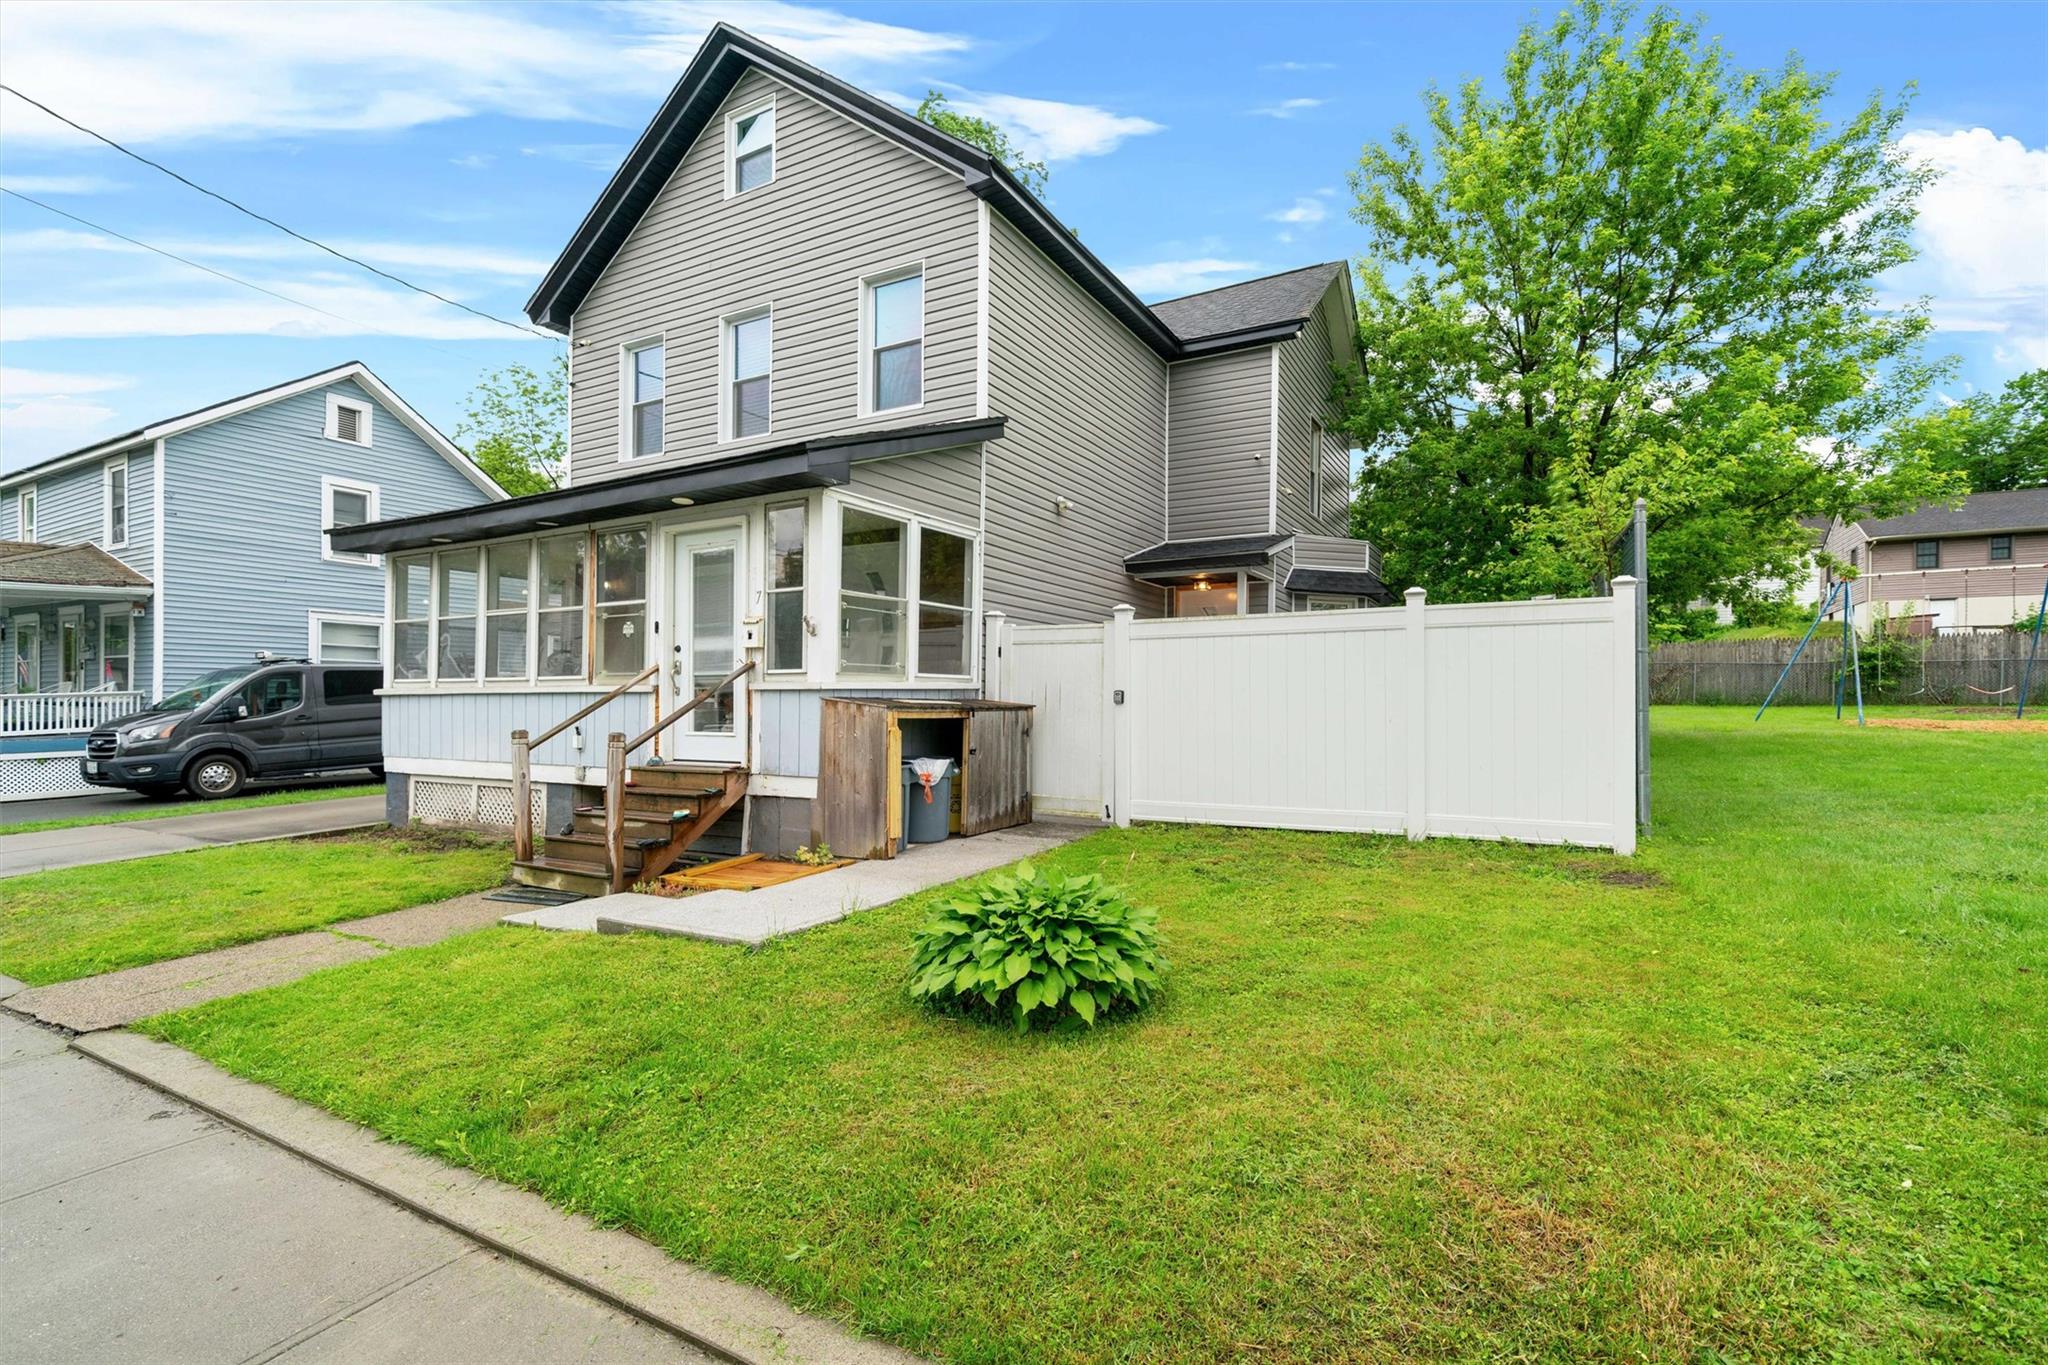
Property Description
Charming 3-Bedroom, 2.5 Bath Home with Modern Updates and Timeless Appeal Welcome to 7 Barclay Street – A beautifully reimagined residence that artfully blends classic charm with contemporary upgrades in the Heart of Port Jervis Step into timeless charm blended seamlessly with modern convenience at this beautifully updated early-1900s home in Port Jervis, NY. Located just moments from I-84, local schools, restaurants, shops, and the train, this property offers both tranquility and exceptional accessibility. From the moment you arrive, you’ll notice the pride of ownership and craftsmanship throughout. The exterior boasts updated siding and a long driveway—providing ample off-street parking—and leads to a converted garage that now serves as a versatile storage area or workshop. The fenced backyard is an entertainer’s dream, featuring a dedicated BBQ area, a cozy bar, and multiple seating spaces perfect for gatherings or relaxing evenings under the stars. Inside, the home is warm and inviting, with thoughtful design touches everywhere you look. The living room features custom built-in cabinetry, in-wall speakers, LED lighting throughout, and space for a large TV—ideal for comfortable everyday living and movie nights. Wood panel accents lend a cozy, rustic feel to select walls, while the adjacent dining room showcases a striking geometric wall design, adding a modern flair. Durable industrial-style linoleum floors that mimic rich hardwoods run through the main living areas, combining beauty and practicality. The chef’s kitchen is a true highlight, featuring quartz countertops, great appliances, including a gas range with hood, double oven, dishwasher, and a spacious refrigerator and beautiful cabinetry. The adjoining butler’s pantry offers elegant tile flooring, a bar sink, granite countertops and extra storage—perfect for entertaining. A stylish guest bathroom on the main floor includes a double vanity, a contemporary shower, and a sleek, backlit rectangular mirror for a spa-like experience. A custom-designed stair railing made of wood and metal leads upstairs to three uniquely styled bedrooms. The primary suite includes a walk-in closet and a luxurious on-suite bathroom with a jacuzzi tub and a separate shower. Downstairs, the finished basement provides a large, flexible space to suit your lifestyle—whether you envision a media room, gym, playroom, or home office. A laundry area with washer, dryer, and a fold-away ironing board cabinet adds extra convenience. Every corner of this home has been carefully curated to offer comfort, style, and functionality. Whether you're entertaining friends, working from home, or simply enjoying a peaceful retreat, 7 Barclay Street offers a rare blend of character and modern living. With Port Jervis continuing to grow and thrive, this lovingly maintained home presents not only a beautiful lifestyle but also an exceptional investment opportunity. Don’t miss your chance to own this one-of-a-kind gem—schedule your private tour today!
Build Your Team
Quickly find investor-friendly professionals who can help you succeed in real estate investing at any stage of the investing journey.


Agents
Match with investor-friendly agents who can help you find, analyze, and close your next deal


Lenders
Get the best funding…find investor-friendly lenders who specialize in your deal strategy


Property Managers
Transition to passive investing. Find a trusted property management partnership that lasts.


Tax Pros & Accountants
Taxes and financial reporting made easy—find experts to create tax savings strategies, file taxes, and more
Location
Property Details
Parking
- Description: Detached Garage
- Details: Driveway
- Garage Spaces: 0
- Spaces Total: 0
Bedroom Information
- # of Bedrooms: 3
Bathroom Information
- # of Baths (Full): 2
- # of Baths (Partial): 1
- # of Baths (Total): 3.0
Interior Features
- # of Rooms: 7
- # of Stories: 2
- Basement: Yes
- Basement Description: Finished
- Fireplace: Yes
Exterior Features
- Exterior Walls Materials: Siding (Alum/Vinyl)
Land Information
- Land Use: Residential
- Land Use Subtype: Single Family Residential
Lot Information
- Parcel ID: 33130020312
- Lot Size: 5000 sqft
Property Information
- Property Type: Single Family Residence
- Style: Other
- Year Built: 1900
Tax Information
- Annual Tax: $3,782
Utilities
- Water & Sewer: Public
- Heating: Natural Gas
- Cooling: Central Air
Location
- County: Orange
Listing Details
Investment Summary
- Monthly Cash Flow
- -$537
- Cap Rate
- 4.6%
- Cash-on-Cash Return
- -7.3%
- Debt Coverage Ratio
- 0.73
- Internal Rate of Return (5 years)
- -3.1%
Cash Flow
Net Operating Income (NOI) minus mortgage payments.
Calculation:
NOI - Mortgage Payments
Cap Rate (Market Value)
Capitalization Rate is a rate of return that compares the yearly Net Operating Income (NOI) to the market value.
Calculation:
NOI / Market Value
Cash-on-Cash Return (CoC)
Annual Cash Flow / Cash Invested
Calculation:
Annual cash flow divided by initial cash invested.
Debt Coverage Ratio (DCR)
Net Operating Income (NOI) divided by total debt payments.
Calculation:
NOI / Total Debt Payments
Internal Rate of Return (IRR)
A metric for assessing profitability over time. IRR is the discount rate at which the net present value (NPV) of all future cash flows (positive and negative) from an investment equals zero — including both periodic cash flow (such as rent) and a projected sale at the end of the holding period. It represents the expected annualized return, accounting for income, expenses, and the recovery of capital through a future sale.
Purchase Details
Purchase PriceThe price paid for the property. Purchase price:
| $385,000 |
|---|---|
Amount FinancedThe amount of the purchase financed through a loan. Amount financed:
| -$308,000 |
Down paymentThe initial payment made towards the purchase. Down payment:
| $77,000 |
Closing CostsFees and expenses associated with purchasing a property, typically ranging from 2% to 5% of the home’s purchase price, paid at the end of a home purchase to cover services like lending, title transfer, and taxes. Closing costs:
| $11,550 |
Rehab CostsCosts incurred to repair or improve the property, including: roof, flooring, exterior siding, kitchen, exterior paint, bathrooms, etc. Rehab costs:
| $0 |
Initial Cash InvestedThe total initial cash invested in the property. Calculation:Down payment + Buying costs + Rehab costs Initial cash invested:
| $88,550 |
Square Feet (SQFT)The total square footage of the property. Square feet:
| 1,658 |
Cost Per Square FootCost per square foot of the property. Calculation:Purchase Price / Square Feet Cost per square foot:
| $232 |
Monthly Rent Per Square FootMonthly rent divided by the number of square feet. This ratio helps investors compare rental income efficiency across properties, markets, and unit sizes Calculation:Monthly Rent / Square Feet Monthly rent per square foot:
| $1.57 |
Financing Details
Loan AmountThe total sum of money borrowed from a lender to finance a property purchase. Calculation:Purchase Price - Down Payment
Loan amount:
| $308,000 |
|---|---|
Loan to Value Ratio (LTV)Loan amount divided by the market value of the property. Calculation:Loan Amount / Market Value
Loan to value ratio:
| 80.0% |
Loan TypeThe type of loan (e.g., fixed, adjustable).
Loan type:
| Amortizing |
TermThe loan repayment period in years.
Term:
| 30 years |
Interest RateThe percentage a lender charges on the borrowed amount of a loan, determining the cost of borrowing money.
Interest rate:
| 6.840% |
Principal & Interest (PI)The principal is the portion of the loan payment that reduces the loan balance. The interest is the lender's charge for borrowing money. Calculation:(P * r * (1 + r) ** n) / ((1 + r) ** n - 1) Where:
P = Loan amount (principal)
Principal & interest:
| $2,016 |
Property TaxesAnnual taxes levied by local governments on real estate properties. These taxes fund public services like schools, roads, and emergency services.
Property tax:
| $315 |
InsuranceThe costs for insurance coverage to protect against financial losses due to risks like fire, natural disasters, theft, liability, or tenant-related damages. Calculation:Assumes 7% of gross rental income, unless insurance rates are specified.
Insurance:
| $182 |
Private Mortgage Insurance (PMI)A fee that borrowers pay when they take out a conventional loan with a loan-to-value (LTV) ratio above 80%.
Private mortgage insurance (PMI):
| $0 |
Monthly PaymentThe fixed amount a borrower pays each month to repay a loan. It typically includes principal and interest (P&I) and may also cover property taxes, insurance, HOA fees, and PMI if escrowed. Monthly payment:
| $2,513 |
Operating Income
| % Rent | Monthly | Yearly | |
|---|---|---|---|
Gross RentThe total rental income received from tenants before deducting any expenses. Includes base rent, late fees, pet fees, parking fees, and other recurring charges.
Gross rent:
| $2,600 | $31,200 | |
Vacancy LossExpected loss of rent due to vacancies.
Vacancy loss:
(6%)
| 6% | -$156 | -$1,872 |
Operating IncomeGross rental income minus vacancy loss. Calculation:Gross rent - Vacancy loss
Operating income:
| $2,444 | $29,328 |
Operating Expenses
| % Rent | Monthly | Yearly | |
|---|---|---|---|
Property TaxesAnnual taxes levied by local governments on real estate properties. These taxes fund public services like schools, roads, and emergency services. | 12% | -$315 | -$3,782 |
InsuranceThe costs for insurance coverage to protect against financial losses due to risks like fire, natural disasters, theft, liability, or tenant-related damages. Calculation:Assumes 7% of gross rental income, unless insurance rates are specified. | 7% | -$182 | -$2,184 |
Property ManagementThe costs associated with hiring a property manager to handle the day-to-day operations of a rental property. Includes management fees, leasing fes, eviction fees, etc. Calculation:Assumes 8% of gross rental income. | 8% | -$208 | -$2,496 |
Repairs & MaintenanceOngoing costs for routine upkeep and minor fixes needed to keep a property in good working condition. Calculation:Assumes 5% of gross rental income. Varies by property age and condition. | 5% | -$130 | -$1,560 |
Capital ExpensesLarge, infrequent costs for major improvements or replacements, like a new roof, HVAC system, or appliances. Calculation:Assumes 5% of gross rental income. Varies by property age. | 5% | -$130 | -$1,560 |
HOA FeesRegular dues paid to a Homeowners Association for community maintenance, amenities, and management. Similar fees include: Condo Association Fees, Co-op Maintenance Fees, etc. | n/a | n/a | n/a |
Operating ExpensesRecurring costs required to maintain and manage a rental property, including property taxes, insurance, maintenance, repairs, utilities (if paid by the owner), property management fees, and other day-to-day expenses. Calculation:Insurance + Property Taxes + Property Management + Repairs & Maintenance + Capital Expenditures + HOA Fees | 37% | -$965 | -$11,582 |
Cash Flow
| Monthly | Yearly | |
|---|---|---|
Net Operating Income (NOI)The income generated from a property after deducting all operating expenses but before deducting mortgage payments, taxes, and capital expenditures. Calculation:Gross Operating Income - Operating Expenses
Net operating income:
| $1,479 | $17,748 |
Mortgage PaymentThe fixed amount a borrower pays each month to repay a loan. It typically includes principal and interest (P&I) and may also cover property taxes, insurance, HOA fees, and PMI if escrowed. | -$2,016 | -$24,192 |
Cash FlowNet Operating Income (NOI) minus mortgage payments. Calculation:NOI - Mortgage Payments | $537 | $6,444 |