
$1,355,000
Investment Summary
- Monthly Cash Flow
- -$1,823
- Cap Rate
- 4.7%
- Cash-on-Cash Return
- -7.0%
- Debt Coverage Ratio
- 0.74
- Internal Rate of Return (5 years)
- -2.8%
Cash Flow
Net Operating Income (NOI) minus mortgage payments.
Calculation:
NOI - Mortgage Payments
Cap Rate (Market Value)
Capitalization Rate is a rate of return that compares the yearly Net Operating Income (NOI) to the market value.
Calculation:
NOI / Market Value
Cash-on-Cash Return (CoC)
Annual Cash Flow / Cash Invested
Calculation:
Annual cash flow divided by initial cash invested.
Debt Coverage Ratio (DCR)
Net Operating Income (NOI) divided by total debt payments.
Calculation:
NOI / Total Debt Payments
Internal Rate of Return (IRR)
A metric for assessing profitability over time. IRR is the discount rate at which the net present value (NPV) of all future cash flows (positive and negative) from an investment equals zero — including both periodic cash flow (such as rent) and a projected sale at the end of the holding period. It represents the expected annualized return, accounting for income, expenses, and the recovery of capital through a future sale.
Property Description
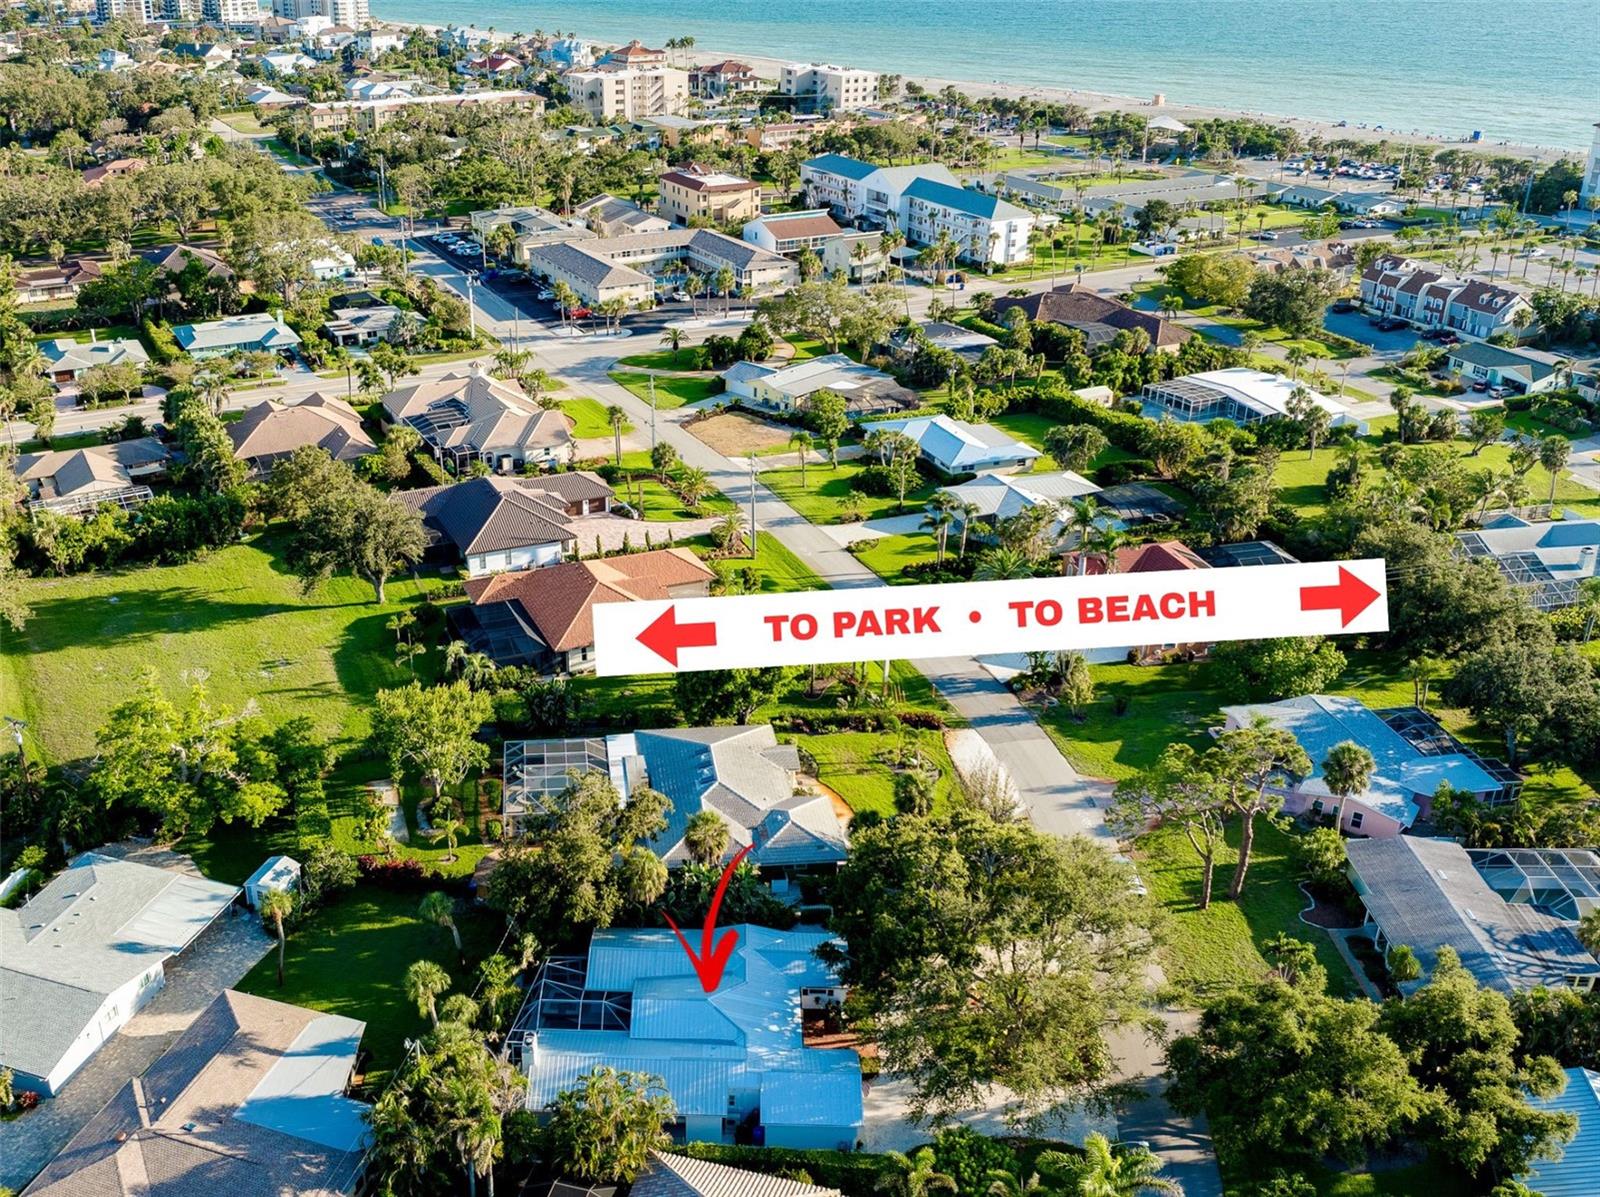
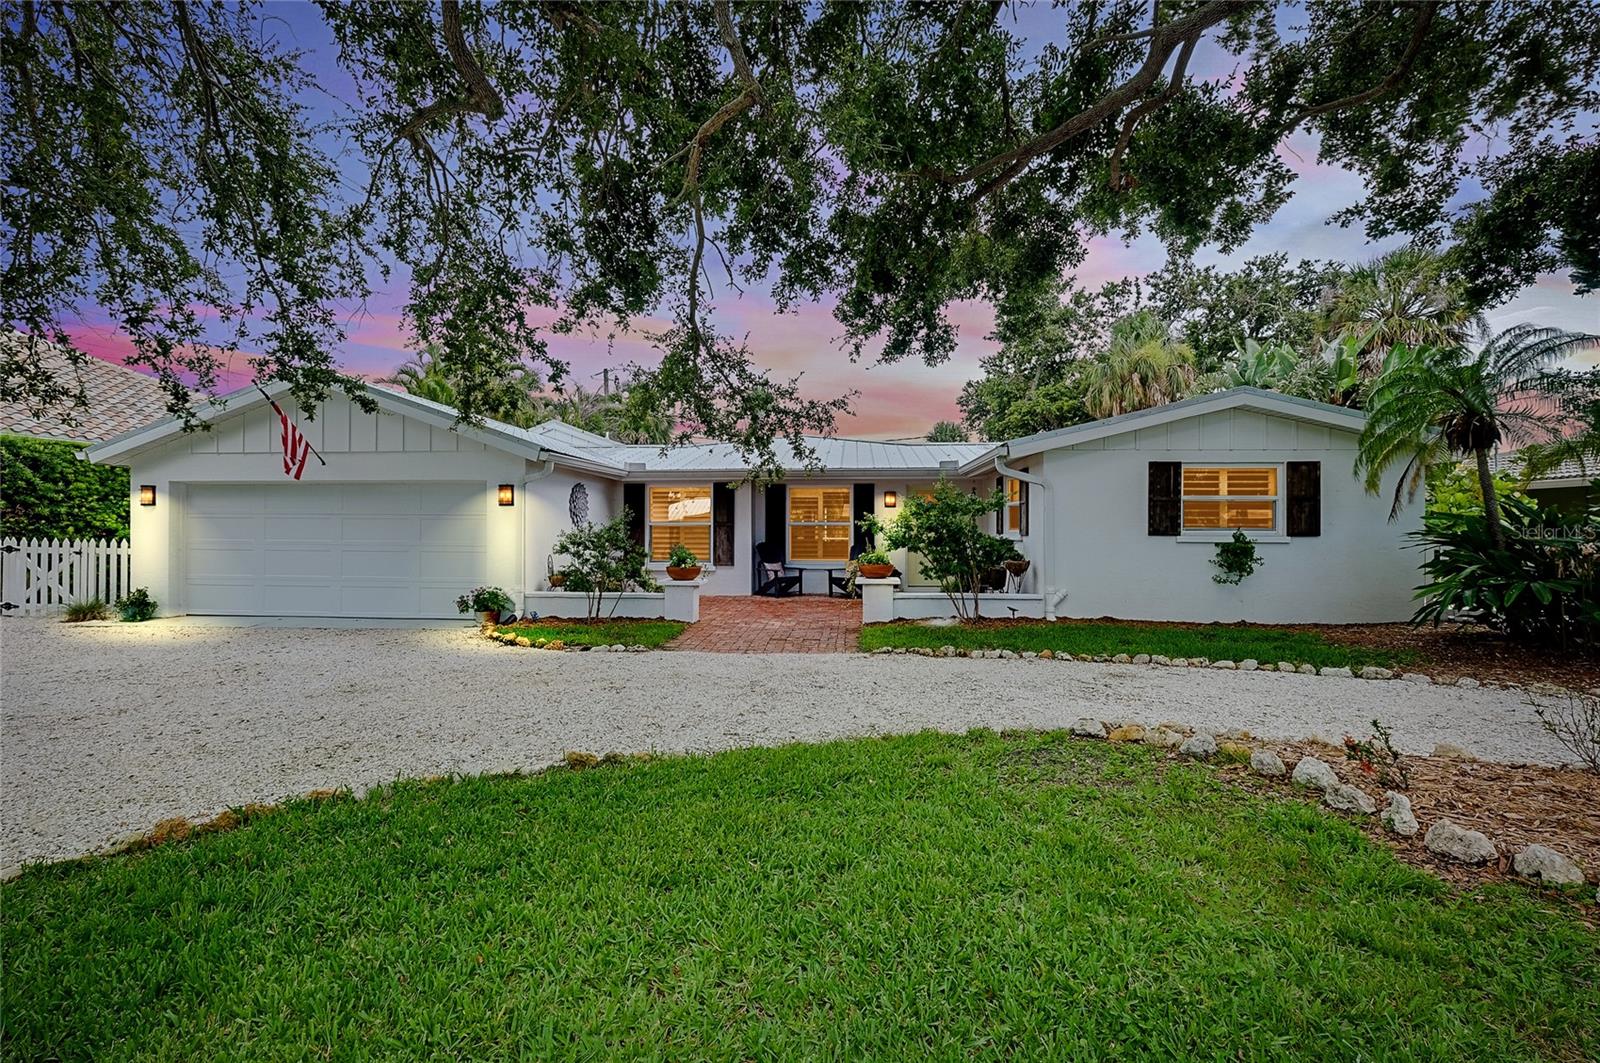
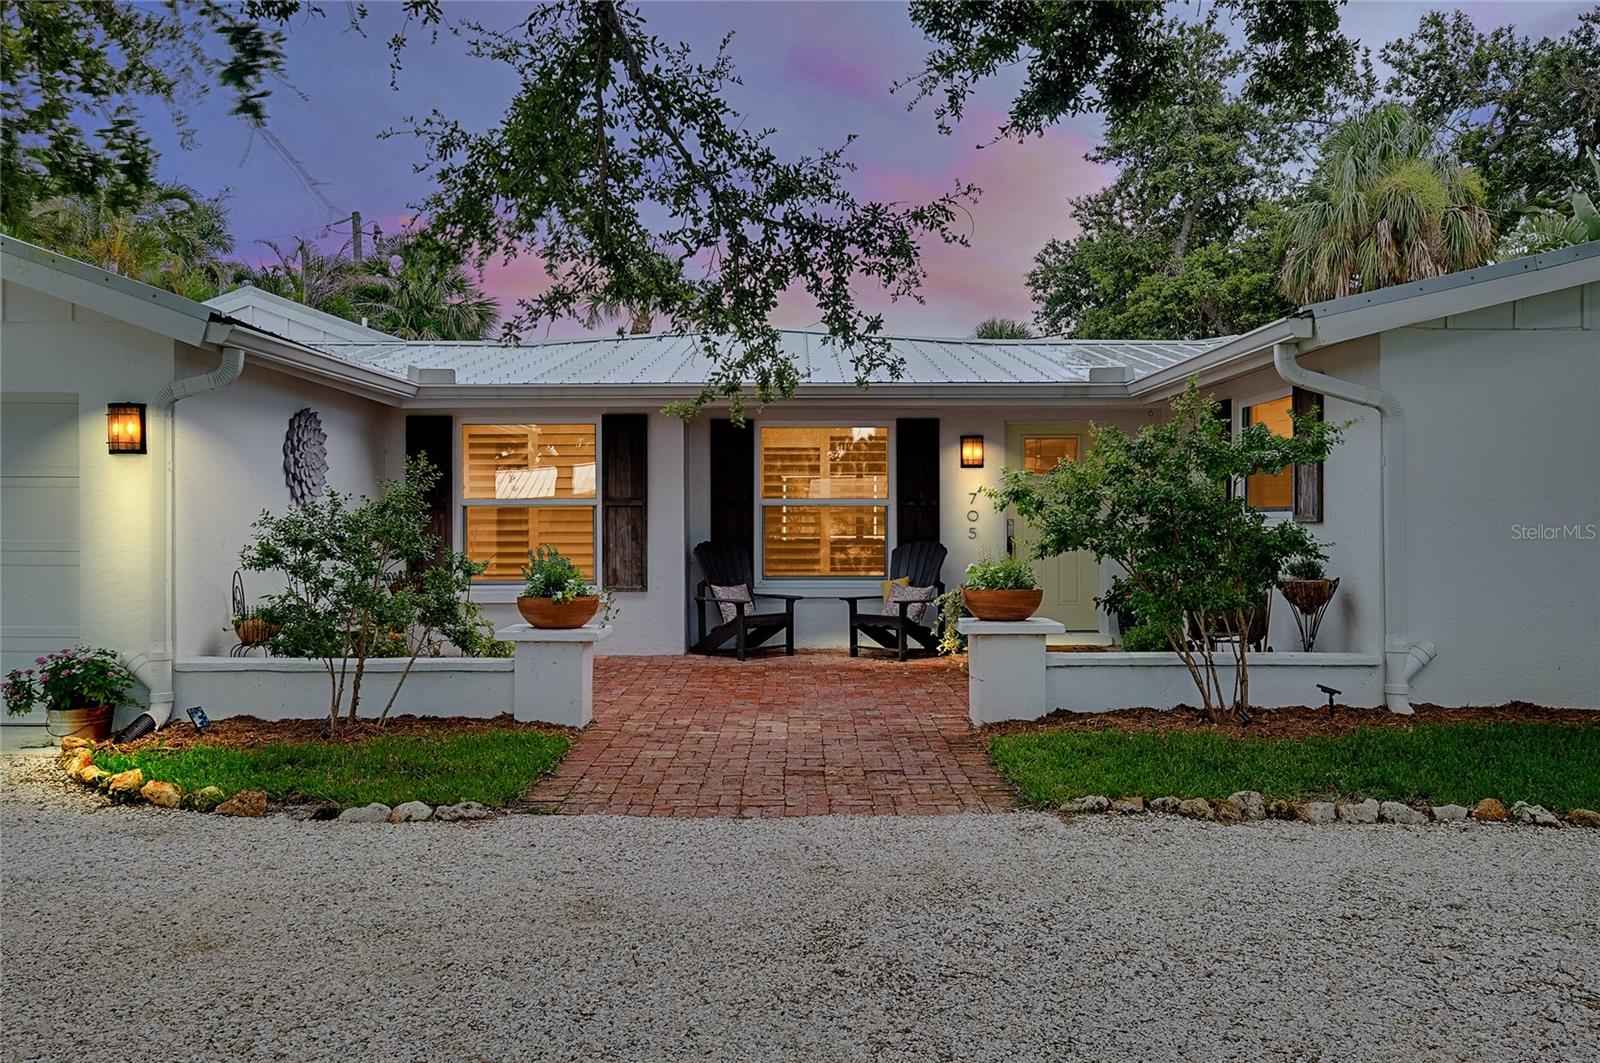
OFFERED BELOW MOST RECENT APPRAISAL! Nestled on a quiet, sought after street on VENICE ISLAND only 2 blocks from the beach is a warm and inviting home seamlessly blending old Florida design with exceptional modern comfort. Move-in-ready, low maintenance, in FLOOD ZONE X (no flood insurance required), this home has gone through EXTENSIVE UPGRADES/RENOVATIONS inside and out. All original WATER LINES having been removed and replaced to meet current standards. SEWER RE-LINING to like-new condition. 25-year METAL ROOF was added in 2022. Owner added a HEATED SALT-WATER POOL and SPA in 2021. Garage was enlarged and is now a 2 CAR GARAGE. You will see a second attic access above the pool area roof gable which provides additional and significant storage capacity eXtending over the living room. The SPRINKLER SYSTEM has been converted from well to public water. The driveway is now a semi-circular crushed shell driveway, which surrounds three amazing live oak trees providing a canopy of priceless shade and cool breezes and welcomes you onto an Old Chicago brick front patio, where summer lounging meets a winter night firepit. Step inside via the NEW hurricane rated metal Craftsman-style front door and be wowed by the attention to detail including all-new 24 x 24 ITALIAN PORCELAIN TILING throughout and a beautiful relaxing color scheme. Chefs will love this modern beautifully redesigned L-shaped kitchen with expansive QUARTZ COUNTER SPACE, boasting NEW STAINLESS STEEL (mostly BOSCH) appliances plus a built-in bar fridge. There’s storage abound with floor-to-ceiling and under-island wood cabinetry. A built-in desk area, under-cabinet lighting, tiled backsplashes, and pantry add to the conveniences. The kitchen now is open to the living room with views through the new hurricane sliders to the back pool. Walking through a pair of French doors, you will find a very large family room that could be another bedroom or in-law suite featuring a beautiful CORAL stone surround WOOD-BURNING FIREPLACE, VAULTED CEILING, office nook and a redesigned 3rd full bathroom. A very private and well-sized master bedroom and en suite bathroom features an large integral closet, natural light from multiple windows, and a view of the pool/spa. The completely remodeled master bath includes a double vanity, granite counter, above and below cabinetry, and a walk-in tiled shower. The guest bedroom closets and bathroom retain the old Florida charm from that era incorporating original hand-crafted cabinets. The garage comes with storage cabinets, pull-down access to attic space, epoxy flooring and a direct-drive garage door opener. Other important upgrade includes replacement of many WINDOWS WITH HURRICANE RATING and PLANTATION SHUTTERS. This home is only 50-yds from a rare 1920 designed Venice pocket park to exercise your pets. Only a few blocks to the historic Venice downtown on this golf cart & biking friendly island. Close to airports, plenty of restaurants, boutique shopping and the arts. An absolute must see. Please call to arrange your private showing or for further information.
Build Your Team
Quickly find investor-friendly professionals who can help you succeed in real estate investing at any stage of the investing journey.


Agents
Match with investor-friendly agents who can help you find, analyze, and close your next deal


Lenders
Get the best funding…find investor-friendly lenders who specialize in your deal strategy


Property Managers
Transition to passive investing. Find a trusted property management partnership that lasts.


Tax Pros & Accountants
Taxes and financial reporting made easy—find experts to create tax savings strategies, file taxes, and more
Location
Property Details
Parking
- Description: Attached Garage
- Details: Attached
- Garage Spaces: 2
- Spaces Total: 0
Bedroom Information
- # of Bedrooms: 3
Bathroom Information
- # of Baths (Full): 3
- # of Baths (Partial): 1
- # of Baths (Total): 3.0
Interior Features
- # of Rooms: 6
- # of Stories: 2
- Fireplace: Yes
Exterior Features
- Exterior Walls Materials: Stucco
- Foundation: Slab
- Roof Type: Hip
- Roof Material: Metal
- Pool: Yes
Land Information
- Land Use: Residential
- Land Use Subtype: Single Family Residential
Lot Information
- Parcel ID: 0176100029
- Lot Size: 9884 sqft
Property Information
- Property Type: Single Family Residence
- Year Built: 1967
Tax Information
- Annual Tax: $9,021
Utilities
- Water & Sewer: Public
- Heating: Electric, Other
- Cooling: Ductless
Location
- County: Sarasota
Listing Details
Investment Summary
- Monthly Cash Flow
- -$1,823
- Cap Rate
- 4.7%
- Cash-on-Cash Return
- -7.0%
- Debt Coverage Ratio
- 0.74
- Internal Rate of Return (5 years)
- -2.8%
Cash Flow
Net Operating Income (NOI) minus mortgage payments.
Calculation:
NOI - Mortgage Payments
Cap Rate (Market Value)
Capitalization Rate is a rate of return that compares the yearly Net Operating Income (NOI) to the market value.
Calculation:
NOI / Market Value
Cash-on-Cash Return (CoC)
Annual Cash Flow / Cash Invested
Calculation:
Annual cash flow divided by initial cash invested.
Debt Coverage Ratio (DCR)
Net Operating Income (NOI) divided by total debt payments.
Calculation:
NOI / Total Debt Payments
Internal Rate of Return (IRR)
A metric for assessing profitability over time. IRR is the discount rate at which the net present value (NPV) of all future cash flows (positive and negative) from an investment equals zero — including both periodic cash flow (such as rent) and a projected sale at the end of the holding period. It represents the expected annualized return, accounting for income, expenses, and the recovery of capital through a future sale.
Purchase Details
Purchase PriceThe price paid for the property. Purchase price:
| $1,355,000 |
|---|---|
Amount FinancedThe amount of the purchase financed through a loan. Amount financed:
| -$1,084,000 |
Down paymentThe initial payment made towards the purchase. Down payment:
| $271,000 |
Closing CostsFees and expenses associated with purchasing a property, typically ranging from 2% to 5% of the home’s purchase price, paid at the end of a home purchase to cover services like lending, title transfer, and taxes. Closing costs:
| $40,650 |
Rehab CostsCosts incurred to repair or improve the property, including: roof, flooring, exterior siding, kitchen, exterior paint, bathrooms, etc. Rehab costs:
| $0 |
Initial Cash InvestedThe total initial cash invested in the property. Calculation:Down payment + Buying costs + Rehab costs Initial cash invested:
| $311,650 |
Square Feet (SQFT)The total square footage of the property. Square feet:
| 2,497 |
Cost Per Square FootCost per square foot of the property. Calculation:Purchase Price / Square Feet Cost per square foot:
| $543 |
Monthly Rent Per Square FootMonthly rent divided by the number of square feet. This ratio helps investors compare rental income efficiency across properties, markets, and unit sizes Calculation:Monthly Rent / Square Feet Monthly rent per square foot:
| $3.48 |
Financing Details
Loan AmountThe total sum of money borrowed from a lender to finance a property purchase. Calculation:Purchase Price - Down Payment
Loan amount:
| $1,084,000 |
|---|---|
Loan to Value Ratio (LTV)Loan amount divided by the market value of the property. Calculation:Loan Amount / Market Value
Loan to value ratio:
| 80.0% |
Loan TypeThe type of loan (e.g., fixed, adjustable).
Loan type:
| Amortizing |
TermThe loan repayment period in years.
Term:
| 30 years |
Interest RateThe percentage a lender charges on the borrowed amount of a loan, determining the cost of borrowing money.
Interest rate:
| 6.810% |
Principal & Interest (PI)The principal is the portion of the loan payment that reduces the loan balance. The interest is the lender's charge for borrowing money. Calculation:(P * r * (1 + r) ** n) / ((1 + r) ** n - 1) Where:
P = Loan amount (principal)
Principal & interest:
| $7,074 |
Property TaxesAnnual taxes levied by local governments on real estate properties. These taxes fund public services like schools, roads, and emergency services.
Property tax:
| $752 |
InsuranceThe costs for insurance coverage to protect against financial losses due to risks like fire, natural disasters, theft, liability, or tenant-related damages. Calculation:Assumes 7% of gross rental income, unless insurance rates are specified.
Insurance:
| $609 |
Private Mortgage Insurance (PMI)A fee that borrowers pay when they take out a conventional loan with a loan-to-value (LTV) ratio above 80%.
Private mortgage insurance (PMI):
| $0 |
Monthly PaymentThe fixed amount a borrower pays each month to repay a loan. It typically includes principal and interest (P&I) and may also cover property taxes, insurance, HOA fees, and PMI if escrowed. Monthly payment:
| $8,435 |
Operating Income
| % Rent | Monthly | Yearly | |
|---|---|---|---|
Gross RentThe total rental income received from tenants before deducting any expenses. Includes base rent, late fees, pet fees, parking fees, and other recurring charges.
Gross rent:
| $8,700 | $104,400 | |
Vacancy LossExpected loss of rent due to vacancies.
Vacancy loss:
(6%)
| 6% | -$522 | -$6,264 |
Operating IncomeGross rental income minus vacancy loss. Calculation:Gross rent - Vacancy loss
Operating income:
| $8,178 | $98,136 |
Operating Expenses
| % Rent | Monthly | Yearly | |
|---|---|---|---|
Property TaxesAnnual taxes levied by local governments on real estate properties. These taxes fund public services like schools, roads, and emergency services. | 9% | -$752 | -$9,021 |
InsuranceThe costs for insurance coverage to protect against financial losses due to risks like fire, natural disasters, theft, liability, or tenant-related damages. Calculation:Assumes 7% of gross rental income, unless insurance rates are specified. | 7% | -$609 | -$7,308 |
Property ManagementThe costs associated with hiring a property manager to handle the day-to-day operations of a rental property. Includes management fees, leasing fes, eviction fees, etc. Calculation:Assumes 8% of gross rental income. | 8% | -$696 | -$8,352 |
Repairs & MaintenanceOngoing costs for routine upkeep and minor fixes needed to keep a property in good working condition. Calculation:Assumes 5% of gross rental income. Varies by property age and condition. | 5% | -$435 | -$5,220 |
Capital ExpensesLarge, infrequent costs for major improvements or replacements, like a new roof, HVAC system, or appliances. Calculation:Assumes 5% of gross rental income. Varies by property age. | 5% | -$435 | -$5,220 |
HOA FeesRegular dues paid to a Homeowners Association for community maintenance, amenities, and management. Similar fees include: Condo Association Fees, Co-op Maintenance Fees, etc. | n/a | n/a | n/a |
Operating ExpensesRecurring costs required to maintain and manage a rental property, including property taxes, insurance, maintenance, repairs, utilities (if paid by the owner), property management fees, and other day-to-day expenses. Calculation:Insurance + Property Taxes + Property Management + Repairs & Maintenance + Capital Expenditures + HOA Fees | 34% | -$2,927 | -$35,121 |
Cash Flow
| Monthly | Yearly | |
|---|---|---|
Net Operating Income (NOI)The income generated from a property after deducting all operating expenses but before deducting mortgage payments, taxes, and capital expenditures. Calculation:Gross Operating Income - Operating Expenses
Net operating income:
| $5,251 | $63,012 |
Mortgage PaymentThe fixed amount a borrower pays each month to repay a loan. It typically includes principal and interest (P&I) and may also cover property taxes, insurance, HOA fees, and PMI if escrowed. | -$7,074 | -$84,888 |
Cash FlowNet Operating Income (NOI) minus mortgage payments. Calculation:NOI - Mortgage Payments | $1,823 | $21,876 |