$1,049,000
Investment Summary
- Monthly Cash Flow
- -$3,430
- Cap Rate
- 2.2%
- Cash-on-Cash Return
- -17.1%
- Debt Coverage Ratio
- 0.36
- Internal Rate of Return (5 years)
- -12.5%
Cash Flow
Net Operating Income (NOI) minus mortgage payments.
Calculation:
NOI - Mortgage Payments
Cap Rate (Market Value)
Capitalization Rate is a rate of return that compares the yearly Net Operating Income (NOI) to the market value.
Calculation:
NOI / Market Value
Cash-on-Cash Return (CoC)
Annual Cash Flow / Cash Invested
Calculation:
Annual cash flow divided by initial cash invested.
Debt Coverage Ratio (DCR)
Net Operating Income (NOI) divided by total debt payments.
Calculation:
NOI / Total Debt Payments
Internal Rate of Return (IRR)
A metric for assessing profitability over time. IRR is the discount rate at which the net present value (NPV) of all future cash flows (positive and negative) from an investment equals zero — including both periodic cash flow (such as rent) and a projected sale at the end of the holding period. It represents the expected annualized return, accounting for income, expenses, and the recovery of capital through a future sale.
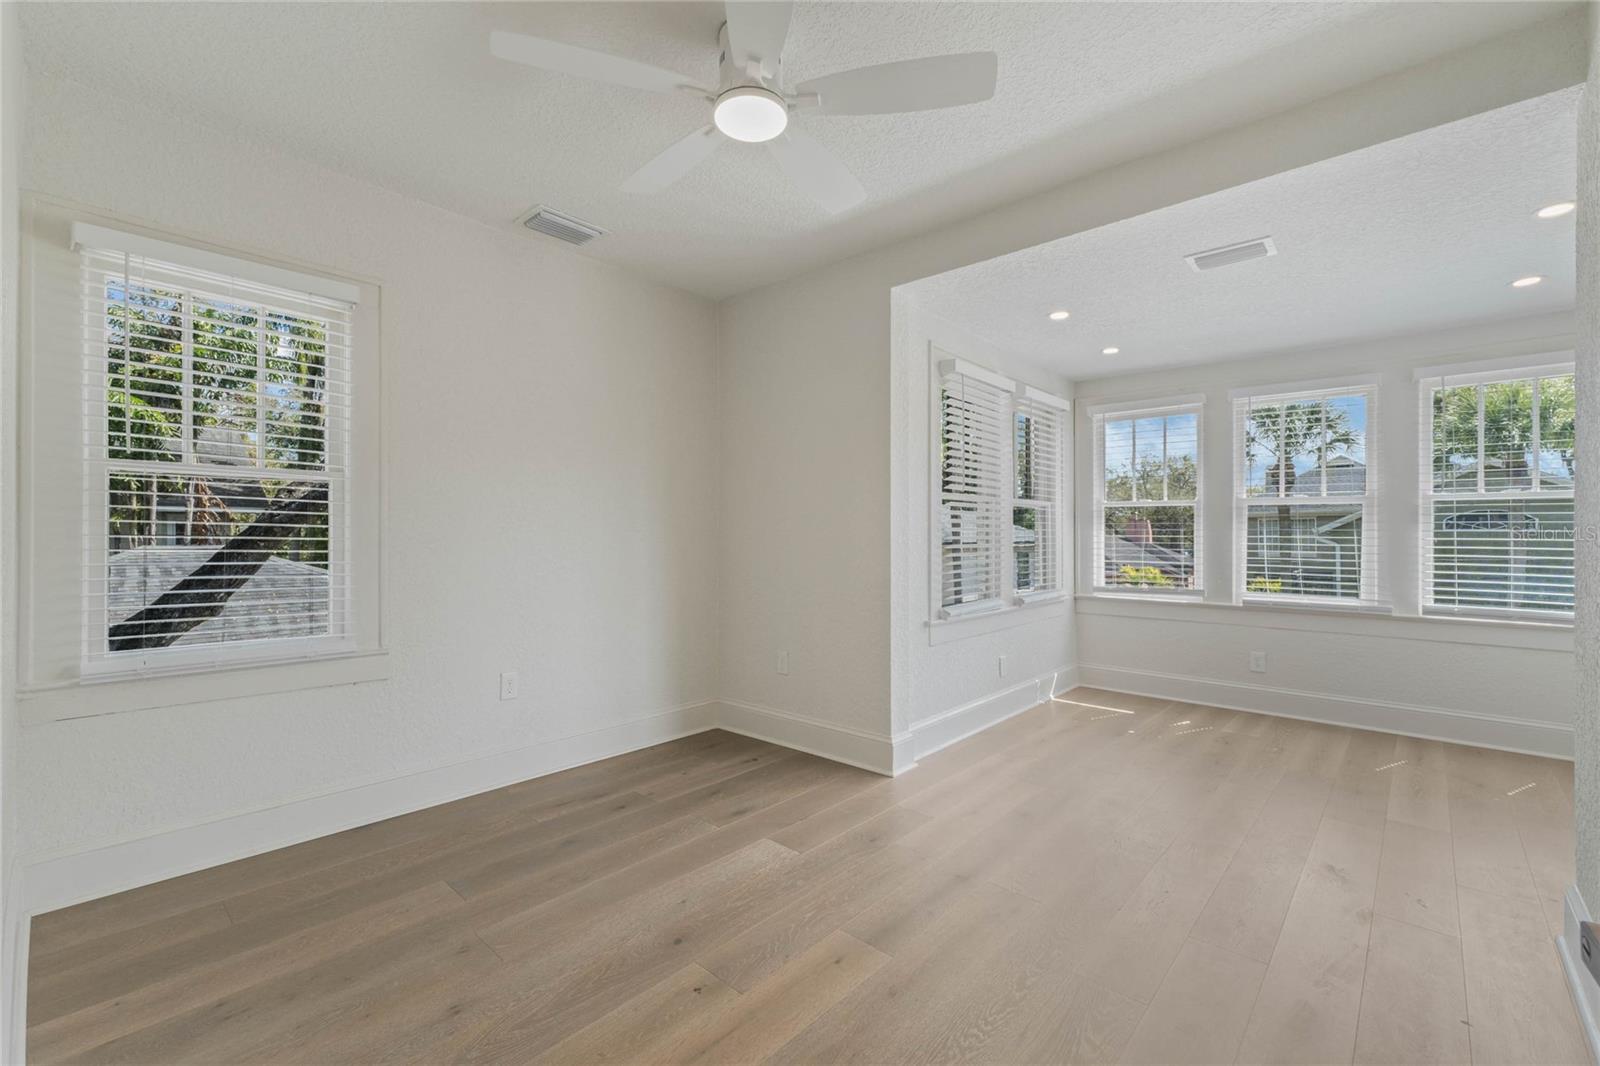
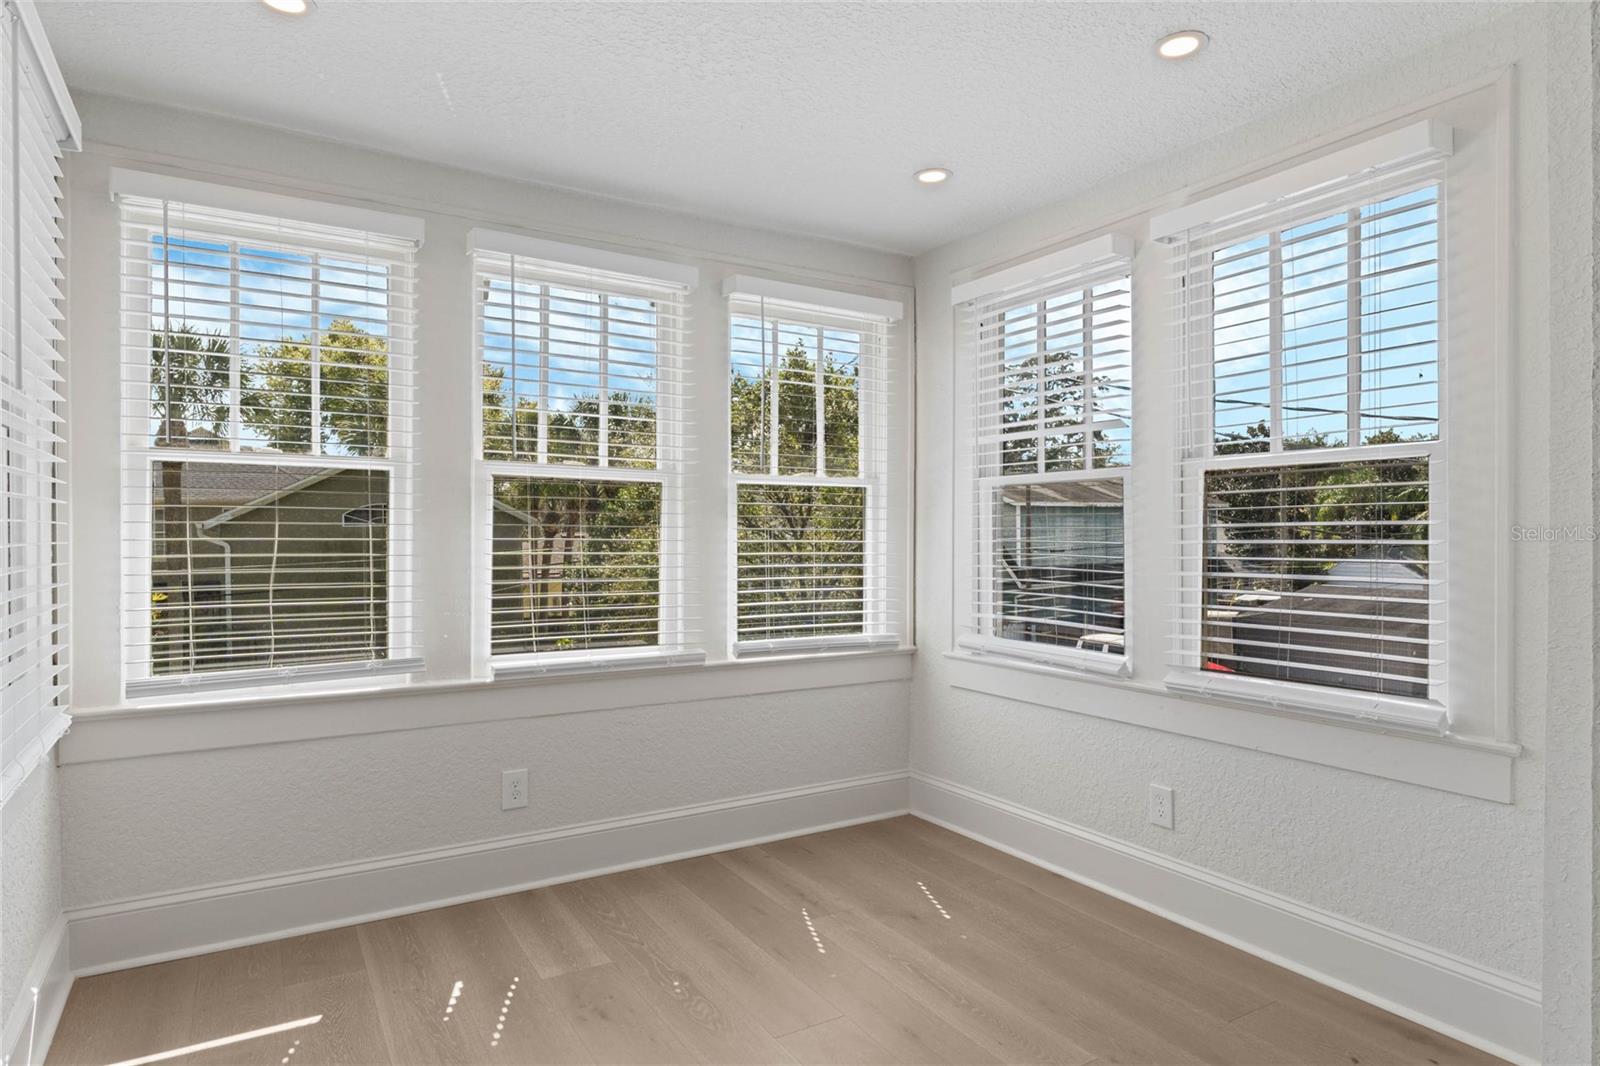
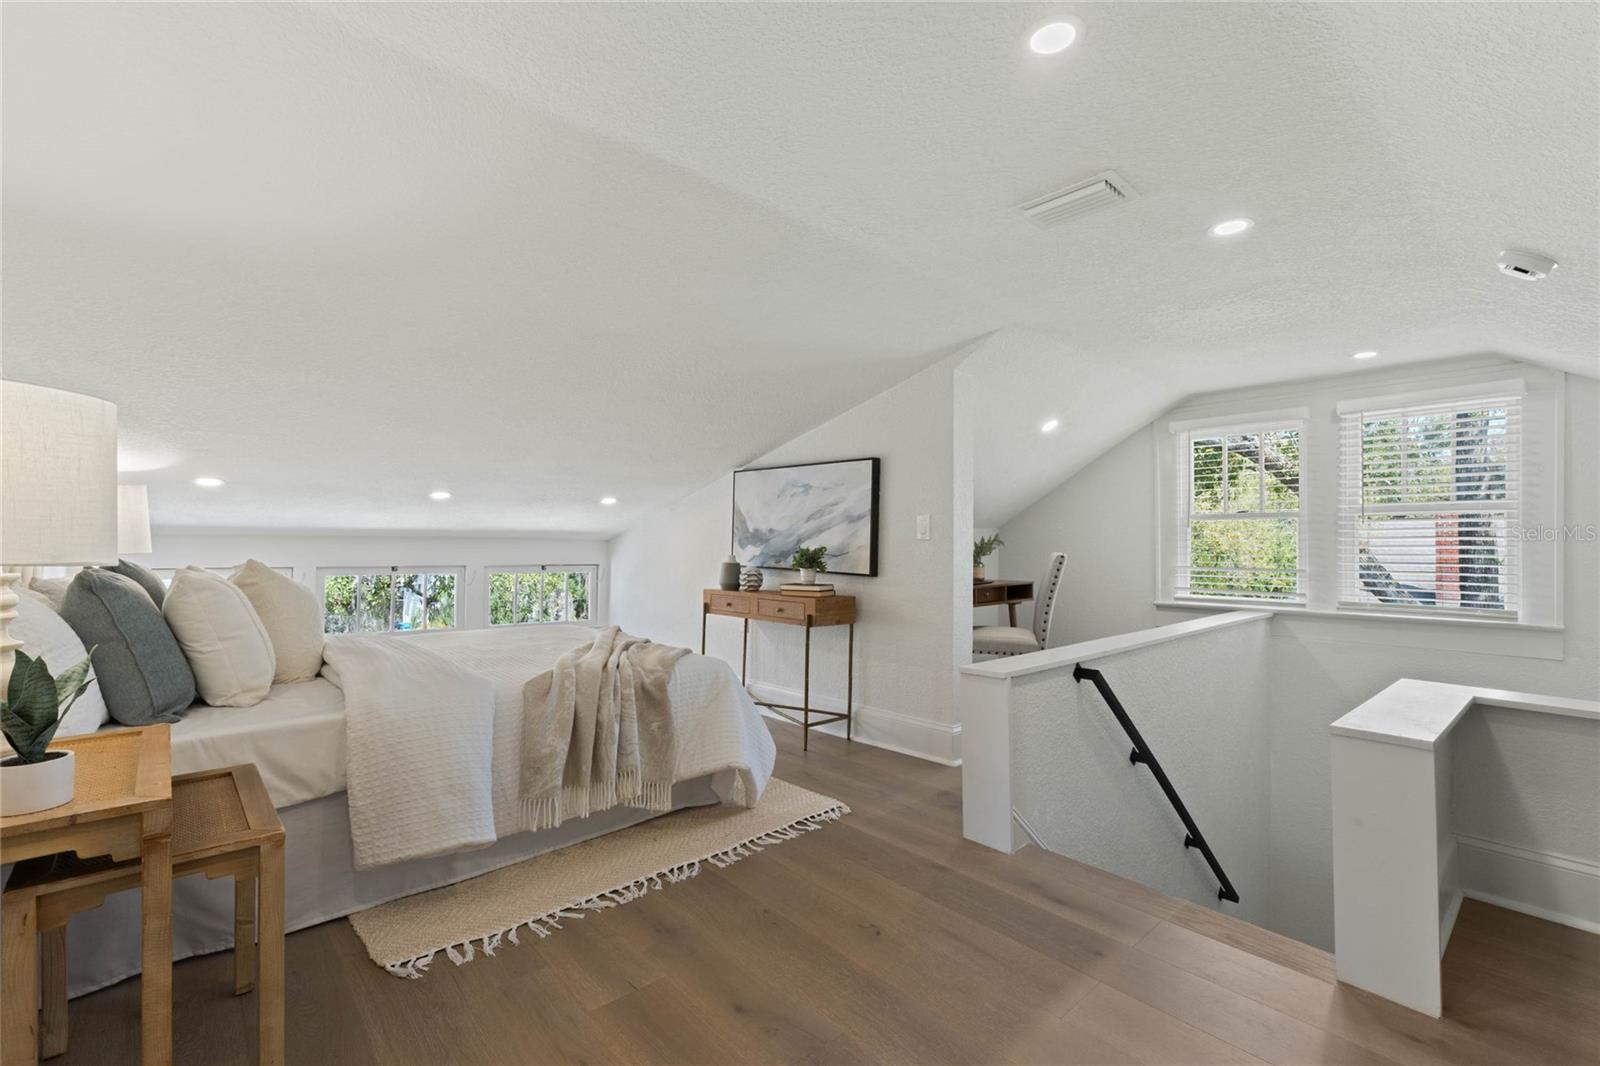
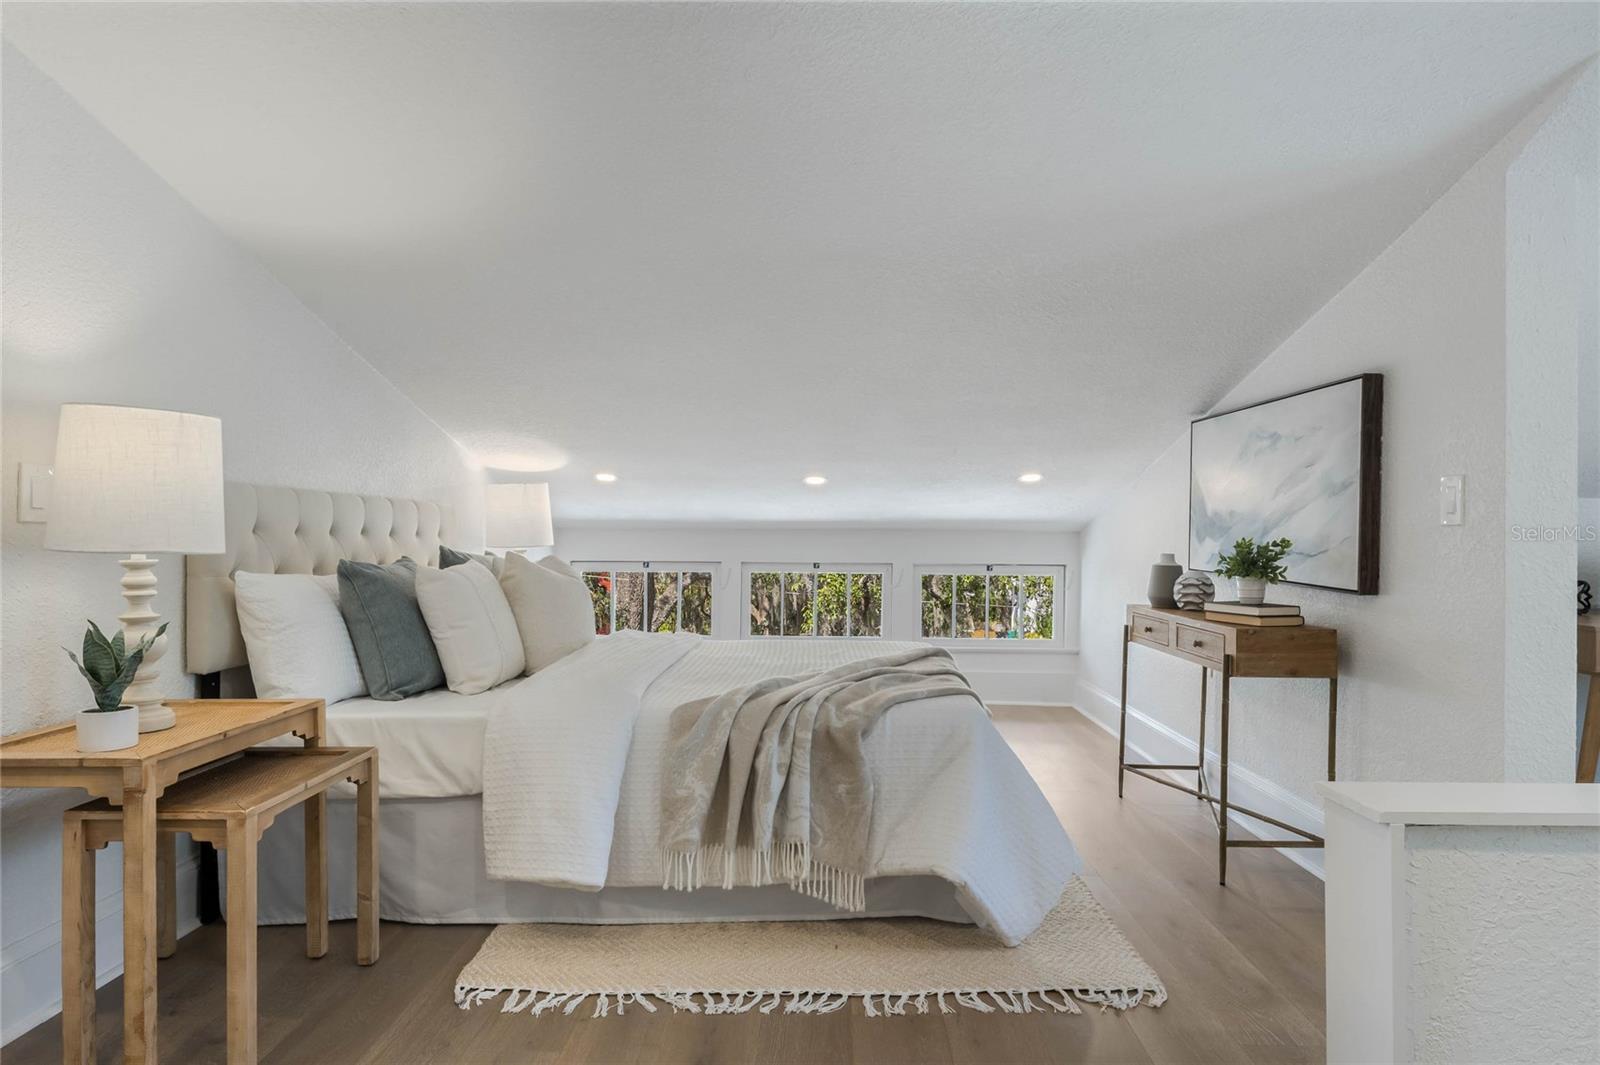
Property Description
Under contract-accepting backup offers. Welcome to the Lake Eola Heights Historic District in Downtown Orlando. Nestled in one of the most desirable neighborhoods, this FULLY RENOVATED historic pool home, with 2,268 sq ft of living space and a 145 sq ft finished basement / wine lounge, combines timeless charm with modern conveniences and beautiful upgrades, both inside and out. This stunning home, just two blocks from Lake Eola, is sure to leave a lasting impression! As you arrive, the home's curb appeal immediately catches your eye, complemented by an oversized front porch—an inviting spot to enjoy your morning coffee. As you step through the front door, you are welcomed into a spacious foyer and living room, featuring brand-new white oak flooring, a cozy wood-burning fireplace, original built-in cabinets, and an abundance of natural light. Head to the spacious dining room, where timeless elegance meets historic charm. Featuring original built-in bench seating and a beautifully crafted built-in buffet, this space is perfect for hosting unforgettable gatherings. The brand new kitchen features beautiful custom calcutta quartz countertops, solid wood white shaker cabinets, a six burner Forno gas range and Bosch dishwasher. After preparing your meal, step into the sunroom, an ideal space for relaxed dining, while enjoying picturesque views of the beautifully landscaped backyard and sparkling pool. Your expansive, private and fully fenced backyard includes an oversized pool and a large pool deck, perfect for hosting friends and family, enjoying a relaxing day poolside. It’s the perfect place to unwind before heading out for a night on the town to many of the entertainment venues within walking distance. Or take advantage of Ride DTO, which will take you anywhere in the Downtown Central Business District for only $1! When you return home, wow your guests with your very own wine lounge and cellar, conveniently located on the ground floor. This inviting space is perfect place for a nightcap and sharing stories. As the evening winds down, retreat to your primary suite, featuring a spacious, custom ensuite bath with a dual sink vanity, glass enclosed shower and a soaking tub for the ultimate relaxation. On the same floor, you’ll find two additional bedrooms and a beautifully upgraded full bathroom located in the hallway. Make your way to the third floor, and you'll find a secluded sanctuary, complete with a full bathroom, making this the perfect 4th bedroom or bonus room. Other features of the home include a NEW roof, two NEW Carrier A/C units, fresh interior and exterior paint, NEW electrical system and NEW plumbing, including a NEW Navien gas tankless water heater, NEW irrigation, Kasa smart dimmer switches throughout the house, all NEW doors and hardware, and the original built-ins have been fully restored. You’re located just 2 blocks from Lake Eola Park, and a 6 minute walk to the local neighborhood favorite, Eola General, and the Lake Eola Heights Community Garden. This welcoming community features neighborhood happy hours, and annual events like the Community Garden Harvest Pot Luck Dinner and National Night Out. Experience the downtown lifestyle in this incredible home! Call for your showing today!
Build Your Team
Quickly find investor-friendly professionals who can help you succeed in real estate investing at any stage of the investing journey.


Agents
Match with investor-friendly agents who can help you find, analyze, and close your next deal


Lenders
Get the best funding…find investor-friendly lenders who specialize in your deal strategy


Property Managers
Transition to passive investing. Find a trusted property management partnership that lasts.


Tax Pros & Accountants
Taxes and financial reporting made easy—find experts to create tax savings strategies, file taxes, and more
Location
Property Details
Parking
- Garage Spaces: 0
- Spaces Total: 0
Bedroom Information
- # of Bedrooms: 4
Bathroom Information
- # of Baths (Full): 4
- # of Baths (Total): 4.0
Interior Features
- # of Rooms: 13
- # of Stories: 3
- Attic: Yes
- Basement Description: Crawl Space
- Fireplace: Yes
Exterior Features
- Exterior Walls Materials: Siding (Alum/Vinyl)
- Roof Type: Gable or Hip
- Roof Material: Shingle
- Pool: Yes
Land Information
- Land Use: Residential
- Land Use Subtype: Single Family Residential
Lot Information
- Parcel ID: 252229250804050
- Lot Size: 6875 sqft
Property Information
- Property Type: Single Family Residence
- Year Built: 1925
Tax Information
- Annual Tax: $6,490
Utilities
- Water & Sewer: Public
- Heating: Central
- Cooling: Central Air
Location
- County: Orange
Listing Details
Investment Summary
- Monthly Cash Flow
- -$3,430
- Cap Rate
- 2.2%
- Cash-on-Cash Return
- -17.1%
- Debt Coverage Ratio
- 0.36
- Internal Rate of Return (5 years)
- -12.5%
Cash Flow
Net Operating Income (NOI) minus mortgage payments.
Calculation:
NOI - Mortgage Payments
Cap Rate (Market Value)
Capitalization Rate is a rate of return that compares the yearly Net Operating Income (NOI) to the market value.
Calculation:
NOI / Market Value
Cash-on-Cash Return (CoC)
Annual Cash Flow / Cash Invested
Calculation:
Annual cash flow divided by initial cash invested.
Debt Coverage Ratio (DCR)
Net Operating Income (NOI) divided by total debt payments.
Calculation:
NOI / Total Debt Payments
Internal Rate of Return (IRR)
A metric for assessing profitability over time. IRR is the discount rate at which the net present value (NPV) of all future cash flows (positive and negative) from an investment equals zero — including both periodic cash flow (such as rent) and a projected sale at the end of the holding period. It represents the expected annualized return, accounting for income, expenses, and the recovery of capital through a future sale.
Purchase Details
Purchase PriceThe price paid for the property. Purchase price:
| $1,049,000 |
|---|---|
Amount FinancedThe amount of the purchase financed through a loan. Amount financed:
| -$839,200 |
Down paymentThe initial payment made towards the purchase. Down payment:
| $209,800 |
Closing CostsFees and expenses associated with purchasing a property, typically ranging from 2% to 5% of the home’s purchase price, paid at the end of a home purchase to cover services like lending, title transfer, and taxes. Closing costs:
| $31,470 |
Rehab CostsCosts incurred to repair or improve the property, including: roof, flooring, exterior siding, kitchen, exterior paint, bathrooms, etc. Rehab costs:
| $0 |
Initial Cash InvestedThe total initial cash invested in the property. Calculation:Down payment + Buying costs + Rehab costs Initial cash invested:
| $241,270 |
Square Feet (SQFT)The total square footage of the property. Square feet:
| 2,413 |
Cost Per Square FootCost per square foot of the property. Calculation:Purchase Price / Square Feet Cost per square foot:
| $435 |
Monthly Rent Per Square FootMonthly rent divided by the number of square feet. This ratio helps investors compare rental income efficiency across properties, markets, and unit sizes Calculation:Monthly Rent / Square Feet Monthly rent per square foot:
| $1.49 |
Financing Details
Loan AmountThe total sum of money borrowed from a lender to finance a property purchase. Calculation:Purchase Price - Down Payment
Loan amount:
| $839,200 |
|---|---|
Loan to Value Ratio (LTV)Loan amount divided by the market value of the property. Calculation:Loan Amount / Market Value
Loan to value ratio:
| 80.0% |
Loan TypeThe type of loan (e.g., fixed, adjustable).
Loan type:
| Amortizing |
TermThe loan repayment period in years.
Term:
| 30 years |
Interest RateThe percentage a lender charges on the borrowed amount of a loan, determining the cost of borrowing money.
Interest rate:
| 6.625% |
Principal & Interest (PI)The principal is the portion of the loan payment that reduces the loan balance. The interest is the lender's charge for borrowing money. Calculation:(P * r * (1 + r) ** n) / ((1 + r) ** n - 1) Where:
P = Loan amount (principal)
Principal & interest:
| $5,373 |
Property TaxesAnnual taxes levied by local governments on real estate properties. These taxes fund public services like schools, roads, and emergency services.
Property tax:
| $541 |
InsuranceThe costs for insurance coverage to protect against financial losses due to risks like fire, natural disasters, theft, liability, or tenant-related damages. Calculation:Assumes 7% of gross rental income, unless insurance rates are specified.
Insurance:
| $252 |
Private Mortgage Insurance (PMI)A fee that borrowers pay when they take out a conventional loan with a loan-to-value (LTV) ratio above 80%.
Private mortgage insurance (PMI):
| $0 |
Monthly PaymentThe fixed amount a borrower pays each month to repay a loan. It typically includes principal and interest (P&I) and may also cover property taxes, insurance, HOA fees, and PMI if escrowed. Monthly payment:
| $6,166 |
Operating Income
| % Rent | Monthly | Yearly | |
|---|---|---|---|
Gross RentThe total rental income received from tenants before deducting any expenses. Includes base rent, late fees, pet fees, parking fees, and other recurring charges.
Gross rent:
| $3,600 | $43,200 | |
Vacancy LossExpected loss of rent due to vacancies.
Vacancy loss:
(6%)
| 6% | -$216 | -$2,592 |
Operating IncomeGross rental income minus vacancy loss. Calculation:Gross rent - Vacancy loss
Operating income:
| $3,384 | $40,608 |
Operating Expenses
| % Rent | Monthly | Yearly | |
|---|---|---|---|
Property TaxesAnnual taxes levied by local governments on real estate properties. These taxes fund public services like schools, roads, and emergency services. | 15% | -$541 | -$6,490 |
InsuranceThe costs for insurance coverage to protect against financial losses due to risks like fire, natural disasters, theft, liability, or tenant-related damages. Calculation:Assumes 7% of gross rental income, unless insurance rates are specified. | 7% | -$252 | -$3,024 |
Property ManagementThe costs associated with hiring a property manager to handle the day-to-day operations of a rental property. Includes management fees, leasing fes, eviction fees, etc. Calculation:Assumes 8% of gross rental income. | 8% | -$288 | -$3,456 |
Repairs & MaintenanceOngoing costs for routine upkeep and minor fixes needed to keep a property in good working condition. Calculation:Assumes 5% of gross rental income. Varies by property age and condition. | 5% | -$180 | -$2,160 |
Capital ExpensesLarge, infrequent costs for major improvements or replacements, like a new roof, HVAC system, or appliances. Calculation:Assumes 5% of gross rental income. Varies by property age. | 5% | -$180 | -$2,160 |
HOA FeesRegular dues paid to a Homeowners Association for community maintenance, amenities, and management. Similar fees include: Condo Association Fees, Co-op Maintenance Fees, etc. | n/a | n/a | n/a |
Operating ExpensesRecurring costs required to maintain and manage a rental property, including property taxes, insurance, maintenance, repairs, utilities (if paid by the owner), property management fees, and other day-to-day expenses. Calculation:Insurance + Property Taxes + Property Management + Repairs & Maintenance + Capital Expenditures + HOA Fees | 40% | -$1,441 | -$17,290 |
Cash Flow
| Monthly | Yearly | |
|---|---|---|
Net Operating Income (NOI)The income generated from a property after deducting all operating expenses but before deducting mortgage payments, taxes, and capital expenditures. Calculation:Gross Operating Income - Operating Expenses
Net operating income:
| $1,943 | $23,316 |
Mortgage PaymentThe fixed amount a borrower pays each month to repay a loan. It typically includes principal and interest (P&I) and may also cover property taxes, insurance, HOA fees, and PMI if escrowed. | -$5,373 | -$64,476 |
Cash FlowNet Operating Income (NOI) minus mortgage payments. Calculation:NOI - Mortgage Payments | $3,430 | $41,160 |