
$1,795,000
Investment Summary
- Monthly Cash Flow
- -$4,395
- Cap Rate
- 3.2%
- Cash-on-Cash Return
- -12.8%
- Debt Coverage Ratio
- 0.52
- Internal Rate of Return (5 years)
- -8.4%
Cash Flow
Net Operating Income (NOI) minus mortgage payments.
Calculation:
NOI - Mortgage Payments
Cap Rate (Market Value)
Capitalization Rate is a rate of return that compares the yearly Net Operating Income (NOI) to the market value.
Calculation:
NOI / Market Value
Cash-on-Cash Return (CoC)
Annual Cash Flow / Cash Invested
Calculation:
Annual cash flow divided by initial cash invested.
Debt Coverage Ratio (DCR)
Net Operating Income (NOI) divided by total debt payments.
Calculation:
NOI / Total Debt Payments
Internal Rate of Return (IRR)
A metric for assessing profitability over time. IRR is the discount rate at which the net present value (NPV) of all future cash flows (positive and negative) from an investment equals zero — including both periodic cash flow (such as rent) and a projected sale at the end of the holding period. It represents the expected annualized return, accounting for income, expenses, and the recovery of capital through a future sale.
Property Description
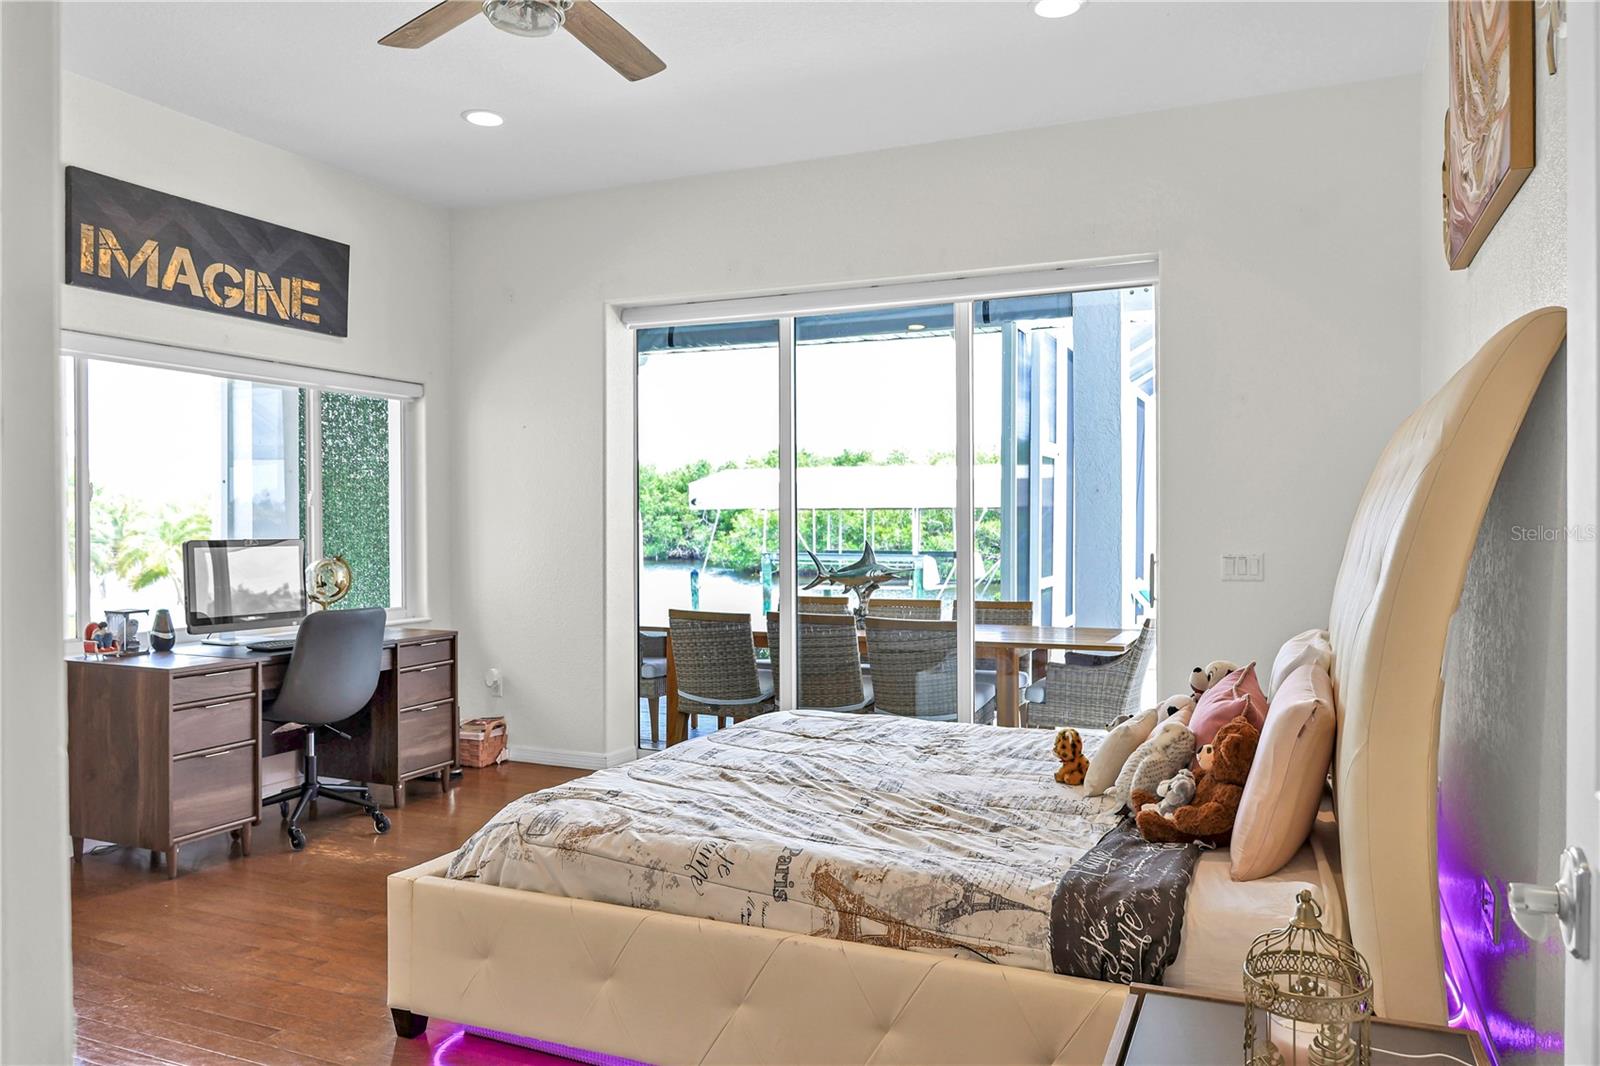
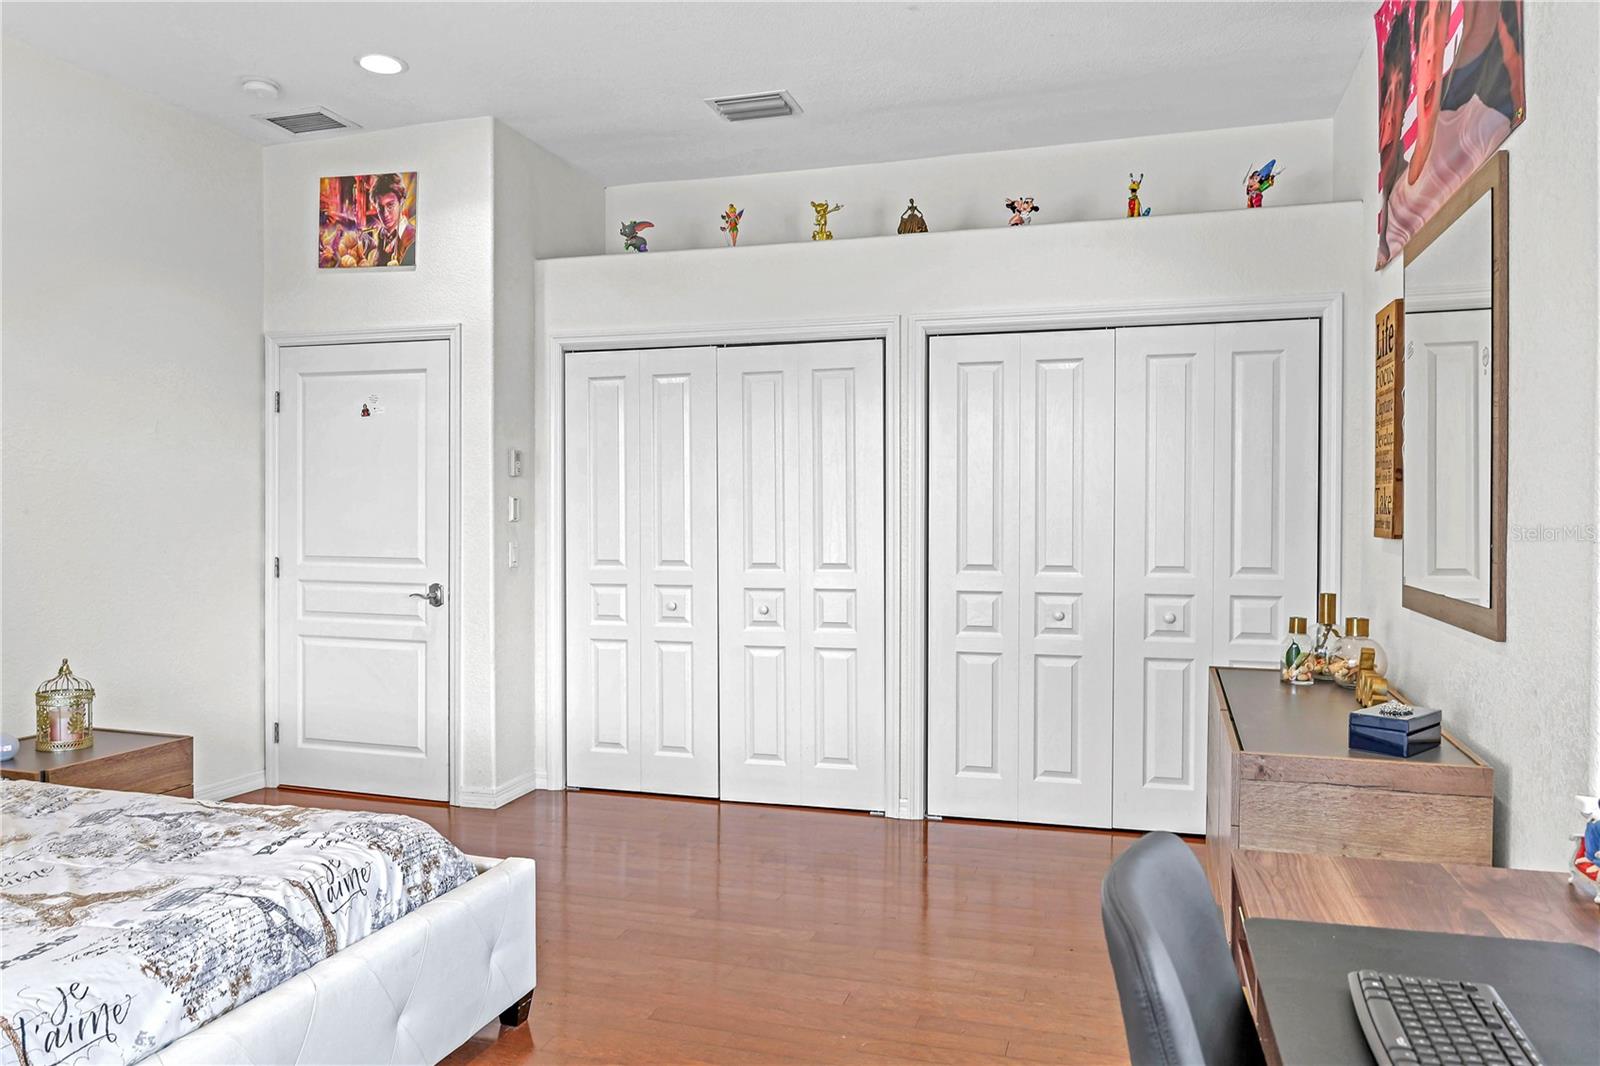
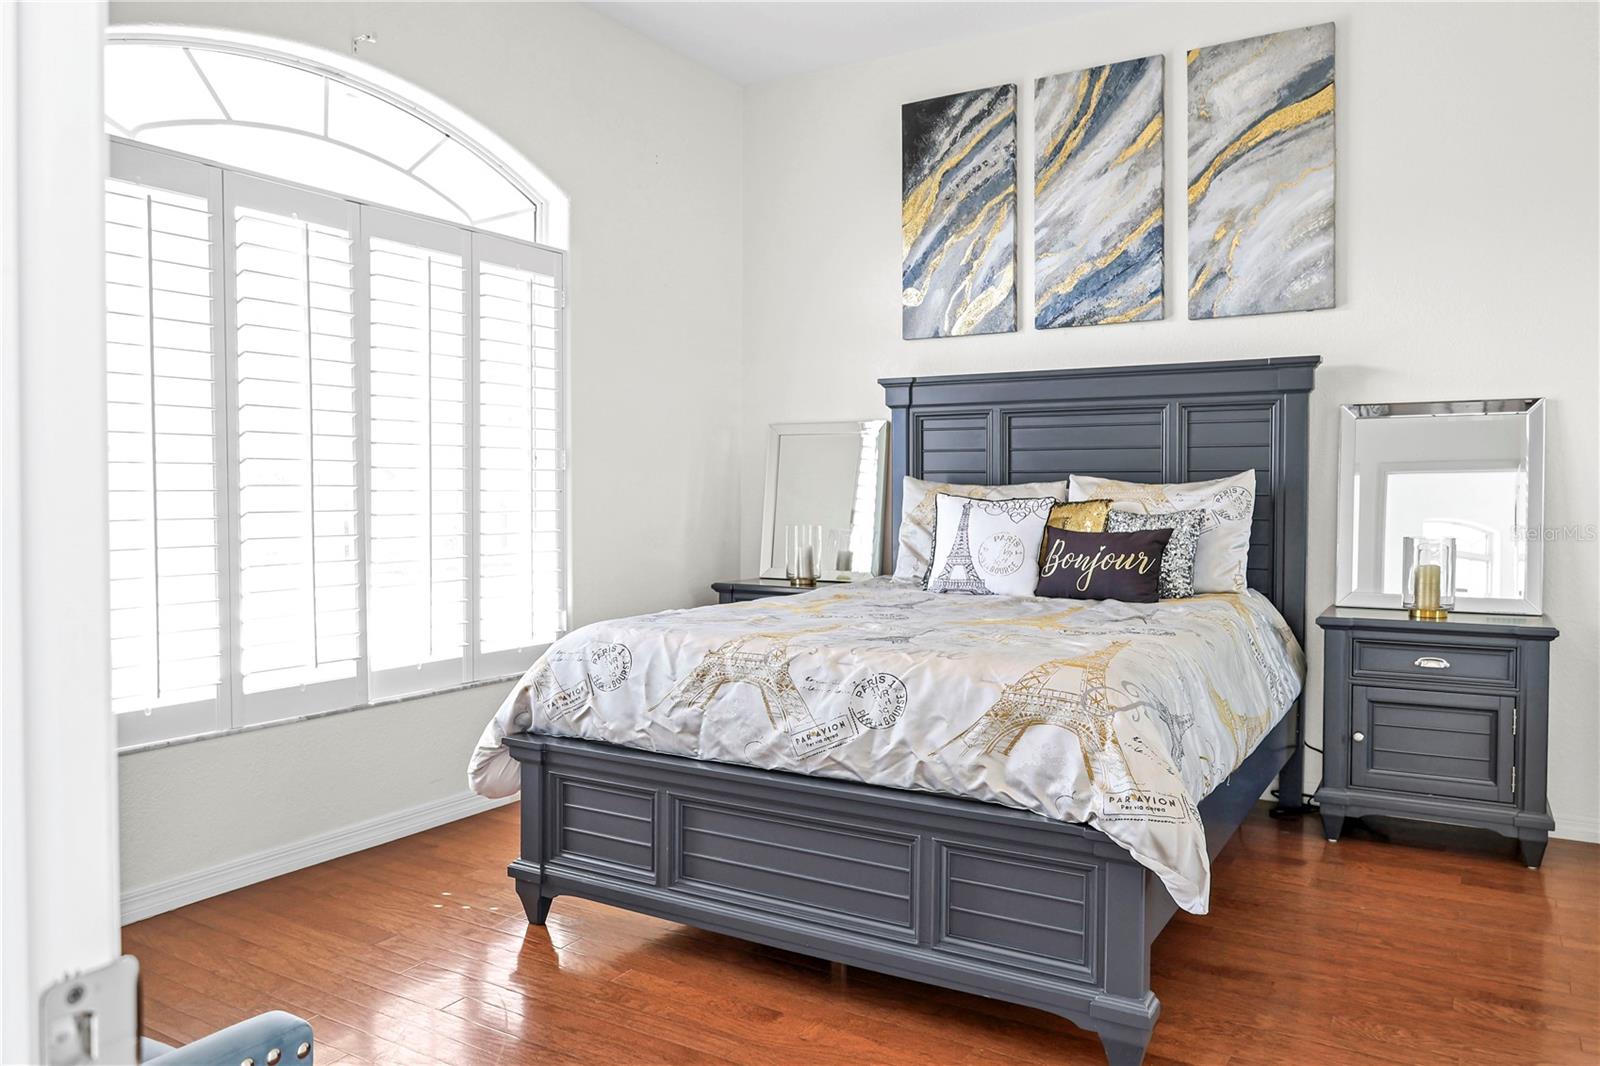
Discover an exquisite waterfront luxury estate. A gated entry welcomes you to an unparalleled blend of luxury and sophistication on an expansive 4 ACRES WITH 278' OF WATER FRONTAGE & peaceful property; all within 15 minutes from the new Punta Gorda Sunseeker Resort and DOWNTOWN PUNTA GORDA! Enjoy year round boating in DEEP WATER with ACCESS TO CHARLOTTE HARBOR which Leads to the GULF OF MEXICO while enjoying the privacy and tranquility of Peace River. This extraordinary 4,081 sqft custom-built home combines luxury, comfort and nature creating and ultimate retreat for living, working, playing, and entertaining. Offering an unparalleled and versatile living experience, this home waits for your family, pets, hobbies and toys, over 2 acres full fenced for your special friend (cows, horses….) Helicopter or just to accommodate any size event and or family gathers. Room to build separate mother-in-law homes or an investment home on property. This meticulously remodeled and reimagined home has a 2024 NEW METAL ROOF, 36”x36” tile floor in main areas, the 2.5 bath fully remodel, fresh painted (April 2025), remodeled laundry with new cabinets, farmhouse sink and Cambria quartz, new screen throughout front porch and lanai, new 2025 pool pump and 2 oversized titanium pool heated, 2025 new electric panels inside and outside. Open great room with sprawling cathedral ceilings and chandeliers, contemporary formal dining room, inviting living room with a 24' pocket slide to enjoy the serene water and preserve views, gourmet chef's kitchen boasts dual convection ovens, sub-zero refrigerator, custom cherry cabinets, marble stone counters, six-burner propane stove, ceramic floors, pass-through window to lanai, large center island and breakfast bar. Exceptional master suite, over 900 ft. with massive custom his and hers walk-in closets, sitting area, fabulous water view and spacious private ensuite with a majestic custom master bathroom, plus pool access. Guests can enjoy privacy with two guest bedrooms and a full guest bath on the opposite side of home. The bonus room can be easily converted into a 4th bedroom, media room, office or gym. Escape outdoors to resort-worthy entertaining areas that include a covered lanai with picture window screen, summer kitchen, a 40ft x 20ft pool with 10 ft at deep end, tennis court, huge deck with private boat ramp, 16,000 lb. covered lift, 2 jet ski floating docks end and a half pool bathroom to add convenience. A 600 sq. ft. barn w/electric for workshop, land keeping equipment storage is convenience situated on the side of the house with a well and the irrigation system for the full 4 acres. This home has something to offer for each family member. Wait no more contact us today to own a piece of paradise in the sunshine state.
Build Your Team
Quickly find investor-friendly professionals who can help you succeed in real estate investing at any stage of the investing journey.


Agents
Match with investor-friendly agents who can help you find, analyze, and close your next deal


Lenders
Get the best funding…find investor-friendly lenders who specialize in your deal strategy


Property Managers
Transition to passive investing. Find a trusted property management partnership that lasts.


Tax Pros & Accountants
Taxes and financial reporting made easy—find experts to create tax savings strategies, file taxes, and more
Location
Property Details
Parking
- Description: Circular Driveway, Garage Door Opener, Golf Cart Parking
- Details: Circular Driveway, Covered, Driveway, Electric Vehicle Charging Station(s), Garage Door Opener, Golf Cart Garage, Guest, Oversized, Attached
- Garage Spaces: 3
- Spaces Total: 0
Bedroom Information
- # of Bedrooms: 4
Bathroom Information
- # of Baths (Full): 2
- # of Baths (Total): 3.0
Interior Features
- # of Rooms: 11
- # of Stories: 1
- Fireplace: Yes
Exterior Features
- Exterior Walls Materials: Stucco
- Foundation: Block
- Roof Material: Metal
- Pool: Yes
Land Information
- Land Use: Residential
- Land Use Subtype: Single Family Residential
Lot Information
- Parcel ID: 402325101004
- Lot Size: 134688 sqft
Property Information
- Property Type: Single Family Residence
- Style: Contemporary
- Year Built: 1995
Tax Information
- Annual Tax: $16,088
Utilities
- Water & Sewer: Private, Public, Well
- Heating: Central
- Cooling: Central Air
Location
- County: Charlotte
Listing Details
Investment Summary
- Monthly Cash Flow
- -$4,395
- Cap Rate
- 3.2%
- Cash-on-Cash Return
- -12.8%
- Debt Coverage Ratio
- 0.52
- Internal Rate of Return (5 years)
- -8.4%
Cash Flow
Net Operating Income (NOI) minus mortgage payments.
Calculation:
NOI - Mortgage Payments
Cap Rate (Market Value)
Capitalization Rate is a rate of return that compares the yearly Net Operating Income (NOI) to the market value.
Calculation:
NOI / Market Value
Cash-on-Cash Return (CoC)
Annual Cash Flow / Cash Invested
Calculation:
Annual cash flow divided by initial cash invested.
Debt Coverage Ratio (DCR)
Net Operating Income (NOI) divided by total debt payments.
Calculation:
NOI / Total Debt Payments
Internal Rate of Return (IRR)
A metric for assessing profitability over time. IRR is the discount rate at which the net present value (NPV) of all future cash flows (positive and negative) from an investment equals zero — including both periodic cash flow (such as rent) and a projected sale at the end of the holding period. It represents the expected annualized return, accounting for income, expenses, and the recovery of capital through a future sale.
Purchase Details
Purchase PriceThe price paid for the property. Purchase price:
| $1,795,000 |
|---|---|
Amount FinancedThe amount of the purchase financed through a loan. Amount financed:
| -$1,436,000 |
Down paymentThe initial payment made towards the purchase. Down payment:
| $359,000 |
Closing CostsFees and expenses associated with purchasing a property, typically ranging from 2% to 5% of the home’s purchase price, paid at the end of a home purchase to cover services like lending, title transfer, and taxes. Closing costs:
| $53,850 |
Rehab CostsCosts incurred to repair or improve the property, including: roof, flooring, exterior siding, kitchen, exterior paint, bathrooms, etc. Rehab costs:
| $0 |
Initial Cash InvestedThe total initial cash invested in the property. Calculation:Down payment + Buying costs + Rehab costs Initial cash invested:
| $412,850 |
Square Feet (SQFT)The total square footage of the property. Square feet:
| 4,081 |
Cost Per Square FootCost per square foot of the property. Calculation:Purchase Price / Square Feet Cost per square foot:
| $440 |
Monthly Rent Per Square FootMonthly rent divided by the number of square feet. This ratio helps investors compare rental income efficiency across properties, markets, and unit sizes Calculation:Monthly Rent / Square Feet Monthly rent per square foot:
| $2.18 |
Financing Details
Loan AmountThe total sum of money borrowed from a lender to finance a property purchase. Calculation:Purchase Price - Down Payment
Loan amount:
| $1,436,000 |
|---|---|
Loan to Value Ratio (LTV)Loan amount divided by the market value of the property. Calculation:Loan Amount / Market Value
Loan to value ratio:
| 80.0% |
Loan TypeThe type of loan (e.g., fixed, adjustable).
Loan type:
| Amortizing |
TermThe loan repayment period in years.
Term:
| 30 years |
Interest RateThe percentage a lender charges on the borrowed amount of a loan, determining the cost of borrowing money.
Interest rate:
| 6.625% |
Principal & Interest (PI)The principal is the portion of the loan payment that reduces the loan balance. The interest is the lender's charge for borrowing money. Calculation:(P * r * (1 + r) ** n) / ((1 + r) ** n - 1) Where:
P = Loan amount (principal)
Principal & interest:
| $9,195 |
Property TaxesAnnual taxes levied by local governments on real estate properties. These taxes fund public services like schools, roads, and emergency services.
Property tax:
| $1,341 |
InsuranceThe costs for insurance coverage to protect against financial losses due to risks like fire, natural disasters, theft, liability, or tenant-related damages. Calculation:Assumes 7% of gross rental income, unless insurance rates are specified.
Insurance:
| $623 |
Private Mortgage Insurance (PMI)A fee that borrowers pay when they take out a conventional loan with a loan-to-value (LTV) ratio above 80%.
Private mortgage insurance (PMI):
| $0 |
Monthly PaymentThe fixed amount a borrower pays each month to repay a loan. It typically includes principal and interest (P&I) and may also cover property taxes, insurance, HOA fees, and PMI if escrowed. Monthly payment:
| $11,159 |
Operating Income
| % Rent | Monthly | Yearly | |
|---|---|---|---|
Gross RentThe total rental income received from tenants before deducting any expenses. Includes base rent, late fees, pet fees, parking fees, and other recurring charges.
Gross rent:
| $8,900 | $106,800 | |
Vacancy LossExpected loss of rent due to vacancies.
Vacancy loss:
(6%)
| 6% | -$534 | -$6,408 |
Operating IncomeGross rental income minus vacancy loss. Calculation:Gross rent - Vacancy loss
Operating income:
| $8,366 | $100,392 |
Operating Expenses
| % Rent | Monthly | Yearly | |
|---|---|---|---|
Property TaxesAnnual taxes levied by local governments on real estate properties. These taxes fund public services like schools, roads, and emergency services. | 15% | -$1,341 | -$16,089 |
InsuranceThe costs for insurance coverage to protect against financial losses due to risks like fire, natural disasters, theft, liability, or tenant-related damages. Calculation:Assumes 7% of gross rental income, unless insurance rates are specified. | 7% | -$623 | -$7,476 |
Property ManagementThe costs associated with hiring a property manager to handle the day-to-day operations of a rental property. Includes management fees, leasing fes, eviction fees, etc. Calculation:Assumes 8% of gross rental income. | 8% | -$712 | -$8,544 |
Repairs & MaintenanceOngoing costs for routine upkeep and minor fixes needed to keep a property in good working condition. Calculation:Assumes 5% of gross rental income. Varies by property age and condition. | 5% | -$445 | -$5,340 |
Capital ExpensesLarge, infrequent costs for major improvements or replacements, like a new roof, HVAC system, or appliances. Calculation:Assumes 5% of gross rental income. Varies by property age. | 5% | -$445 | -$5,340 |
HOA FeesRegular dues paid to a Homeowners Association for community maintenance, amenities, and management. Similar fees include: Condo Association Fees, Co-op Maintenance Fees, etc. | n/a | n/a | n/a |
Operating ExpensesRecurring costs required to maintain and manage a rental property, including property taxes, insurance, maintenance, repairs, utilities (if paid by the owner), property management fees, and other day-to-day expenses. Calculation:Insurance + Property Taxes + Property Management + Repairs & Maintenance + Capital Expenditures + HOA Fees | 40% | -$3,566 | -$42,789 |
Cash Flow
| Monthly | Yearly | |
|---|---|---|
Net Operating Income (NOI)The income generated from a property after deducting all operating expenses but before deducting mortgage payments, taxes, and capital expenditures. Calculation:Gross Operating Income - Operating Expenses
Net operating income:
| $4,800 | $57,600 |
Mortgage PaymentThe fixed amount a borrower pays each month to repay a loan. It typically includes principal and interest (P&I) and may also cover property taxes, insurance, HOA fees, and PMI if escrowed. | -$9,195 | -$110,340 |
Cash FlowNet Operating Income (NOI) minus mortgage payments. Calculation:NOI - Mortgage Payments | $4,395 | $52,740 |