$575,000
Investment Summary
- Monthly Cash Flow
- -$1,381
- Cap Rate
- 3.4%
- Cash-on-Cash Return
- -12.5%
- Debt Coverage Ratio
- 0.54
- Internal Rate of Return (5 years)
- -8.1%
Cash Flow
Net Operating Income (NOI) minus mortgage payments.
Calculation:
NOI - Mortgage Payments
Cap Rate (Market Value)
Capitalization Rate is a rate of return that compares the yearly Net Operating Income (NOI) to the market value.
Calculation:
NOI / Market Value
Cash-on-Cash Return (CoC)
Annual Cash Flow / Cash Invested
Calculation:
Annual cash flow divided by initial cash invested.
Debt Coverage Ratio (DCR)
Net Operating Income (NOI) divided by total debt payments.
Calculation:
NOI / Total Debt Payments
Internal Rate of Return (IRR)
A metric for assessing profitability over time. IRR is the discount rate at which the net present value (NPV) of all future cash flows (positive and negative) from an investment equals zero — including both periodic cash flow (such as rent) and a projected sale at the end of the holding period. It represents the expected annualized return, accounting for income, expenses, and the recovery of capital through a future sale.
Property Description
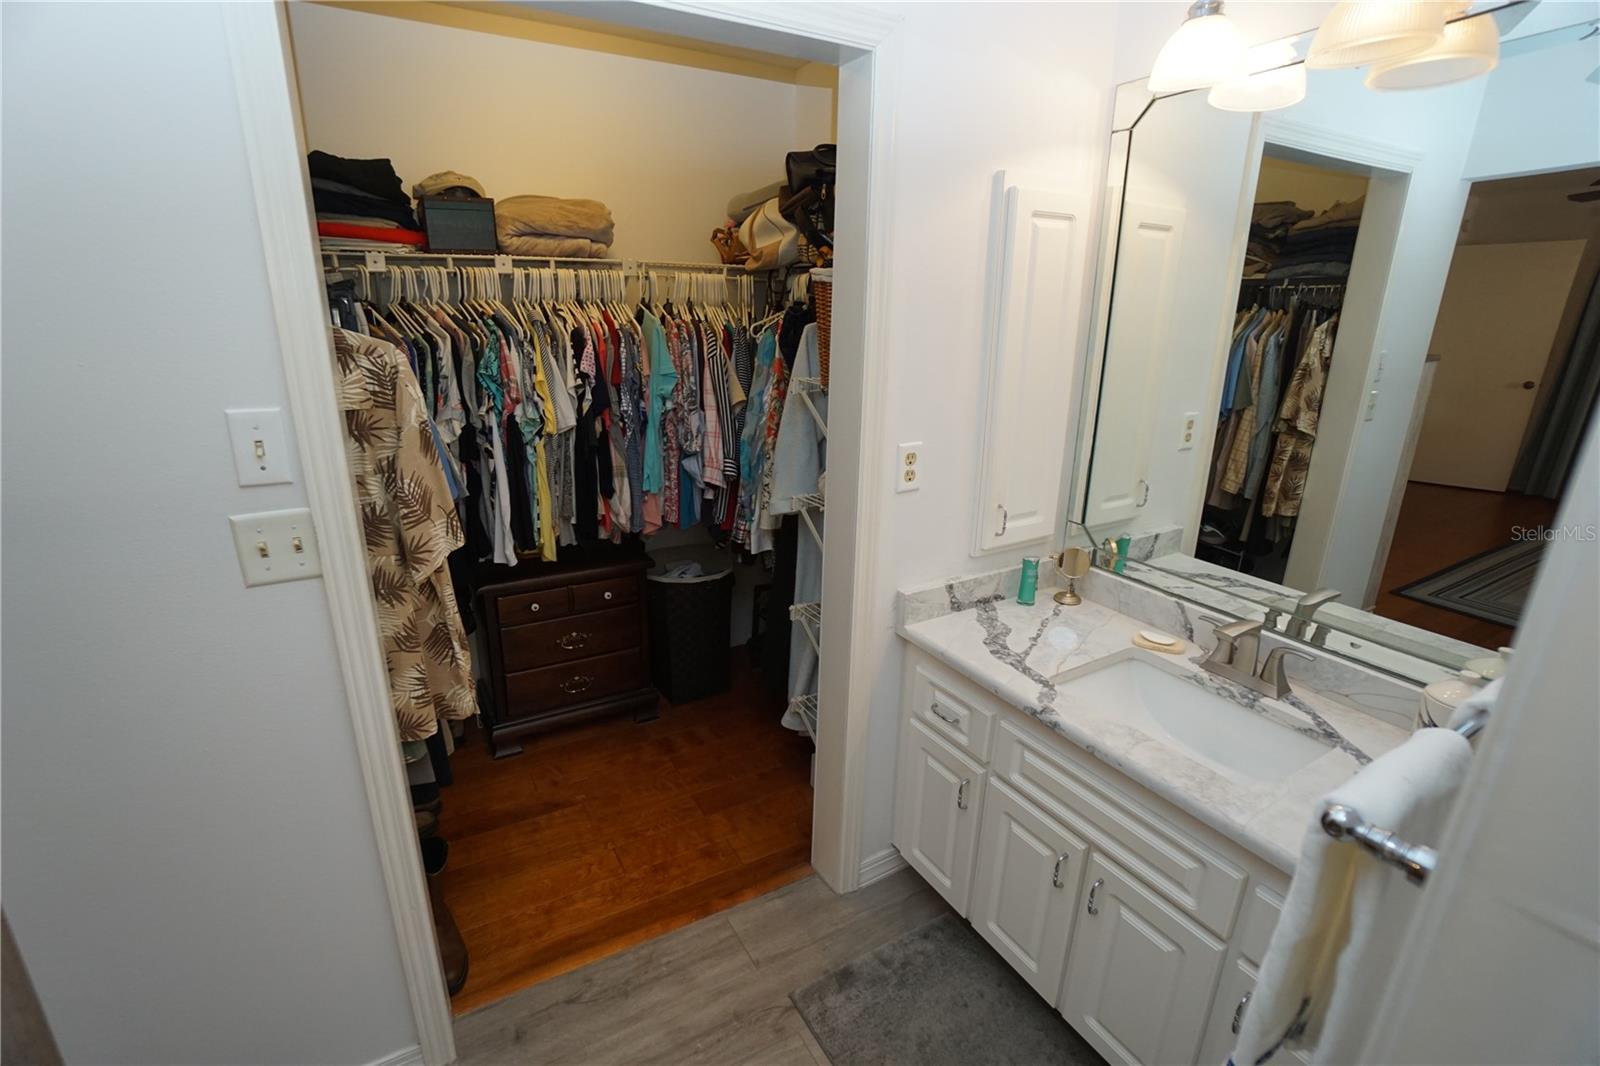
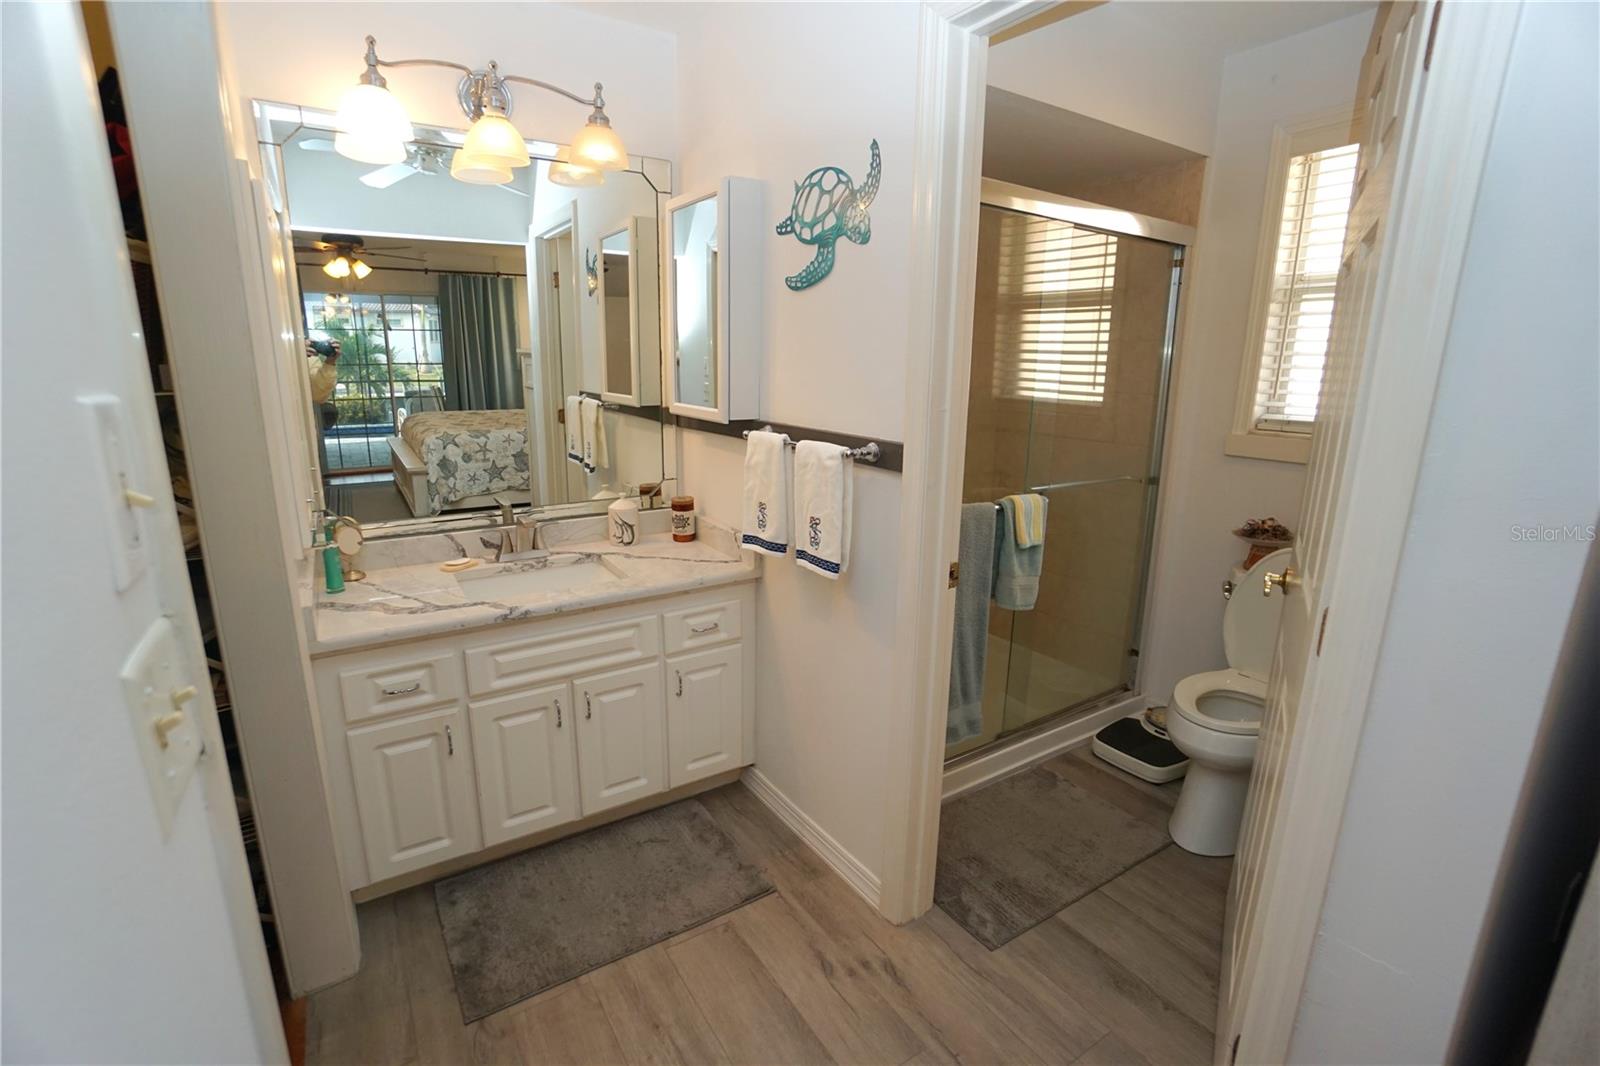
Under contract-accepting backup offers. This home looks better in person than the pictures can possibly show. It is cute as a button and the pride of ownership is obvious as soon as you pull into the driveway. This home is immaculate inside and out and you will be glad that you set up your own showing. Lets start with the 1958 sq. ft. with 3 nice size bedrooms and 2 full baths. An oversized garage that is 4 ft. wider than the average garage so you have room for extra storage or a workshop area. The circle driveway allows plenty of space for all your family and friends to come over. The pool lanai area is an extension of an additional family room while enjoying a great water view and a new pool with brick pavers in 2021. The ceiling to the lanai area had new ship-lap installed in 2021 which you will notice when you lay back and take a nap in the breeze while listening to the pool and waterway. The roof is a brand new metal roof in 2023. Sprinkler system in 2022, new sod and landscaping in 2022. New extended dock in 2023, new hot water heater in 2024, new flooring in 2022, brick pavers around the home in 2022, quartz counter tops in kitchen and bathrooms in 2022. New gutters and soffits in 2023. New air conditioning in 2021. New hurricane shutters in 2021 as well. So much has been done that you can literally just move in and start enjoying the home immediately. The layout allows all the windows on the rear of the home to enjoy a great water view and the pool area. The location is amazing as a Publix Shopping Center and Home Depot are literally at the entrance to the neighborhood. A Walmart is just minutes away. Twin Isles Golf and Country Club runs through the neighborhood and there are 8 additional golf courses within a 20 minute drive. The boat ride out to open water of Charlotte Harbor and the Gulf of Mexico is short and beautiful.This neighborhood is immaculate and has city water and city sewer with identical concrete seawalls all throughout the neighborhood. You are just minutes from downtown Punta Gorda and all the iconic and historical landmarks to visit from, like the bird sanctuary at Ponce De Leon park and boat ramp, to the view at the point and boat club on the Charlotte Harbor. Fine dining options are plentiful downtown and so are multiple pubs and sport bars for getting together with family and friends. The popular Fishermans Village is always fun to visit and browse and then get a drink or a great meal. Pickleball has become a very popular sport here and the new Pickleplex is simply awesome with leagues, instructions, and tournaments. A walking path along the Harbor that is miles long and passes a large park and playground and multiple restaurants along it path. And of course Titi's tiki hut on the water with bands playing most evenings. The saturday morning farmers market is always fun and packed with not only fruits and vegetables, but so many unique and interesting vendors on display as well. When you buy in Burnt Store Isles neighborhood, you not only are getting a beautiful home like this one, but you are also buying into a great community that has all the conveniences of a small town and a lot of the fun things to do like a large city does. So hurry now to schedule your visit for this beautiful and affordable home!
Build Your Team
Quickly find investor-friendly professionals who can help you succeed in real estate investing at any stage of the investing journey.


Agents
Match with investor-friendly agents who can help you find, analyze, and close your next deal


Lenders
Get the best funding…find investor-friendly lenders who specialize in your deal strategy


Property Managers
Transition to passive investing. Find a trusted property management partnership that lasts.


Tax Pros & Accountants
Taxes and financial reporting made easy—find experts to create tax savings strategies, file taxes, and more
Location
Property Details
Parking
- Description: Circular Driveway, Driveway, Garage Door Opener, Oversized, Workshop in Garage
- Details: Circular Driveway, Driveway, Garage Door Opener, Oversized, Workshop in Garage, Attached
- Garage Spaces: 2
- Spaces Total: 0
Bedroom Information
- # of Bedrooms: 3
Bathroom Information
- # of Baths (Full): 2
- # of Baths (Total): 2.0
Interior Features
- # of Rooms: 12
- # of Stories: 1
Exterior Features
- Exterior Walls Materials: Concrete Block
- Foundation: Slab
- Roof Material: Metal
- Pool: Yes
HOA
- Has HOA: Yes
- Association: Bill Page - President
- HOA Fee: $50/annually
Land Information
- Land Use: Residential
- Land Use Subtype: Single Family Residential
Lot Information
- Parcel ID: 412330203010
- Lot Size: 9599 sqft
Property Information
- Property Type: Single Family Residence
- Year Built: 1981
Tax Information
- Annual Tax: $9,370
Utilities
- Water & Sewer: Public
- Heating: Electric
- Cooling: Central Air
Location
- County: Charlotte
Listing Details
Investment Summary
- Monthly Cash Flow
- -$1,381
- Cap Rate
- 3.4%
- Cash-on-Cash Return
- -12.5%
- Debt Coverage Ratio
- 0.54
- Internal Rate of Return (5 years)
- -8.1%
Cash Flow
Net Operating Income (NOI) minus mortgage payments.
Calculation:
NOI - Mortgage Payments
Cap Rate (Market Value)
Capitalization Rate is a rate of return that compares the yearly Net Operating Income (NOI) to the market value.
Calculation:
NOI / Market Value
Cash-on-Cash Return (CoC)
Annual Cash Flow / Cash Invested
Calculation:
Annual cash flow divided by initial cash invested.
Debt Coverage Ratio (DCR)
Net Operating Income (NOI) divided by total debt payments.
Calculation:
NOI / Total Debt Payments
Internal Rate of Return (IRR)
A metric for assessing profitability over time. IRR is the discount rate at which the net present value (NPV) of all future cash flows (positive and negative) from an investment equals zero — including both periodic cash flow (such as rent) and a projected sale at the end of the holding period. It represents the expected annualized return, accounting for income, expenses, and the recovery of capital through a future sale.
Purchase Details
Purchase PriceThe price paid for the property. Purchase price:
| $575,000 |
|---|---|
Amount FinancedThe amount of the purchase financed through a loan. Amount financed:
| -$460,000 |
Down paymentThe initial payment made towards the purchase. Down payment:
| $115,000 |
Closing CostsFees and expenses associated with purchasing a property, typically ranging from 2% to 5% of the home’s purchase price, paid at the end of a home purchase to cover services like lending, title transfer, and taxes. Closing costs:
| $17,250 |
Rehab CostsCosts incurred to repair or improve the property, including: roof, flooring, exterior siding, kitchen, exterior paint, bathrooms, etc. Rehab costs:
| $0 |
Initial Cash InvestedThe total initial cash invested in the property. Calculation:Down payment + Buying costs + Rehab costs Initial cash invested:
| $132,250 |
Square Feet (SQFT)The total square footage of the property. Square feet:
| 1,958 |
Cost Per Square FootCost per square foot of the property. Calculation:Purchase Price / Square Feet Cost per square foot:
| $294 |
Monthly Rent Per Square FootMonthly rent divided by the number of square feet. This ratio helps investors compare rental income efficiency across properties, markets, and unit sizes Calculation:Monthly Rent / Square Feet Monthly rent per square foot:
| $1.79 |
Financing Details
Loan AmountThe total sum of money borrowed from a lender to finance a property purchase. Calculation:Purchase Price - Down Payment
Loan amount:
| $460,000 |
|---|---|
Loan to Value Ratio (LTV)Loan amount divided by the market value of the property. Calculation:Loan Amount / Market Value
Loan to value ratio:
| 80.0% |
Loan TypeThe type of loan (e.g., fixed, adjustable).
Loan type:
| Amortizing |
TermThe loan repayment period in years.
Term:
| 30 years |
Interest RateThe percentage a lender charges on the borrowed amount of a loan, determining the cost of borrowing money.
Interest rate:
| 6.840% |
Principal & Interest (PI)The principal is the portion of the loan payment that reduces the loan balance. The interest is the lender's charge for borrowing money. Calculation:(P * r * (1 + r) ** n) / ((1 + r) ** n - 1) Where:
P = Loan amount (principal)
Principal & interest:
| $3,011 |
Property TaxesAnnual taxes levied by local governments on real estate properties. These taxes fund public services like schools, roads, and emergency services.
Property tax:
| $781 |
InsuranceThe costs for insurance coverage to protect against financial losses due to risks like fire, natural disasters, theft, liability, or tenant-related damages. Calculation:Assumes 7% of gross rental income, unless insurance rates are specified.
Insurance:
| $245 |
Private Mortgage Insurance (PMI)A fee that borrowers pay when they take out a conventional loan with a loan-to-value (LTV) ratio above 80%.
Private mortgage insurance (PMI):
| $0 |
Monthly PaymentThe fixed amount a borrower pays each month to repay a loan. It typically includes principal and interest (P&I) and may also cover property taxes, insurance, HOA fees, and PMI if escrowed. Monthly payment:
| $4,037 |
Operating Income
| % Rent | Monthly | Yearly | |
|---|---|---|---|
Gross RentThe total rental income received from tenants before deducting any expenses. Includes base rent, late fees, pet fees, parking fees, and other recurring charges.
Gross rent:
| $3,500 | $42,000 | |
Vacancy LossExpected loss of rent due to vacancies.
Vacancy loss:
(6%)
| 6% | -$210 | -$2,520 |
Operating IncomeGross rental income minus vacancy loss. Calculation:Gross rent - Vacancy loss
Operating income:
| $3,290 | $39,480 |
Operating Expenses
| % Rent | Monthly | Yearly | |
|---|---|---|---|
Property TaxesAnnual taxes levied by local governments on real estate properties. These taxes fund public services like schools, roads, and emergency services. | 22% | -$781 | -$9,370 |
InsuranceThe costs for insurance coverage to protect against financial losses due to risks like fire, natural disasters, theft, liability, or tenant-related damages. Calculation:Assumes 7% of gross rental income, unless insurance rates are specified. | 7% | -$245 | -$2,940 |
Property ManagementThe costs associated with hiring a property manager to handle the day-to-day operations of a rental property. Includes management fees, leasing fes, eviction fees, etc. Calculation:Assumes 8% of gross rental income. | 8% | -$280 | -$3,360 |
Repairs & MaintenanceOngoing costs for routine upkeep and minor fixes needed to keep a property in good working condition. Calculation:Assumes 5% of gross rental income. Varies by property age and condition. | 5% | -$175 | -$2,100 |
Capital ExpensesLarge, infrequent costs for major improvements or replacements, like a new roof, HVAC system, or appliances. Calculation:Assumes 5% of gross rental income. Varies by property age. | 5% | -$175 | -$2,100 |
HOA FeesRegular dues paid to a Homeowners Association for community maintenance, amenities, and management. Similar fees include: Condo Association Fees, Co-op Maintenance Fees, etc. | 0% | -$4 | -$48 |
Operating ExpensesRecurring costs required to maintain and manage a rental property, including property taxes, insurance, maintenance, repairs, utilities (if paid by the owner), property management fees, and other day-to-day expenses. Calculation:Insurance + Property Taxes + Property Management + Repairs & Maintenance + Capital Expenditures + HOA Fees | 47% | -$1,660 | -$19,918 |
Cash Flow
| Monthly | Yearly | |
|---|---|---|
Net Operating Income (NOI)The income generated from a property after deducting all operating expenses but before deducting mortgage payments, taxes, and capital expenditures. Calculation:Gross Operating Income - Operating Expenses
Net operating income:
| $1,630 | $19,560 |
Mortgage PaymentThe fixed amount a borrower pays each month to repay a loan. It typically includes principal and interest (P&I) and may also cover property taxes, insurance, HOA fees, and PMI if escrowed. | -$3,011 | -$36,132 |
Cash FlowNet Operating Income (NOI) minus mortgage payments. Calculation:NOI - Mortgage Payments | $1,381 | $16,572 |