$1,075,000
Investment Summary
- Monthly Cash Flow
- -$3,119
- Cap Rate
- 2.7%
- Cash-on-Cash Return
- -15.1%
- Debt Coverage Ratio
- 0.43
- Internal Rate of Return (5 years)
- -10.6%
Cash Flow
Net Operating Income (NOI) minus mortgage payments.
Calculation:
NOI - Mortgage Payments
Cap Rate (Market Value)
Capitalization Rate is a rate of return that compares the yearly Net Operating Income (NOI) to the market value.
Calculation:
NOI / Market Value
Cash-on-Cash Return (CoC)
Annual Cash Flow / Cash Invested
Calculation:
Annual cash flow divided by initial cash invested.
Debt Coverage Ratio (DCR)
Net Operating Income (NOI) divided by total debt payments.
Calculation:
NOI / Total Debt Payments
Internal Rate of Return (IRR)
A metric for assessing profitability over time. IRR is the discount rate at which the net present value (NPV) of all future cash flows (positive and negative) from an investment equals zero — including both periodic cash flow (such as rent) and a projected sale at the end of the holding period. It represents the expected annualized return, accounting for income, expenses, and the recovery of capital through a future sale.
Property Description
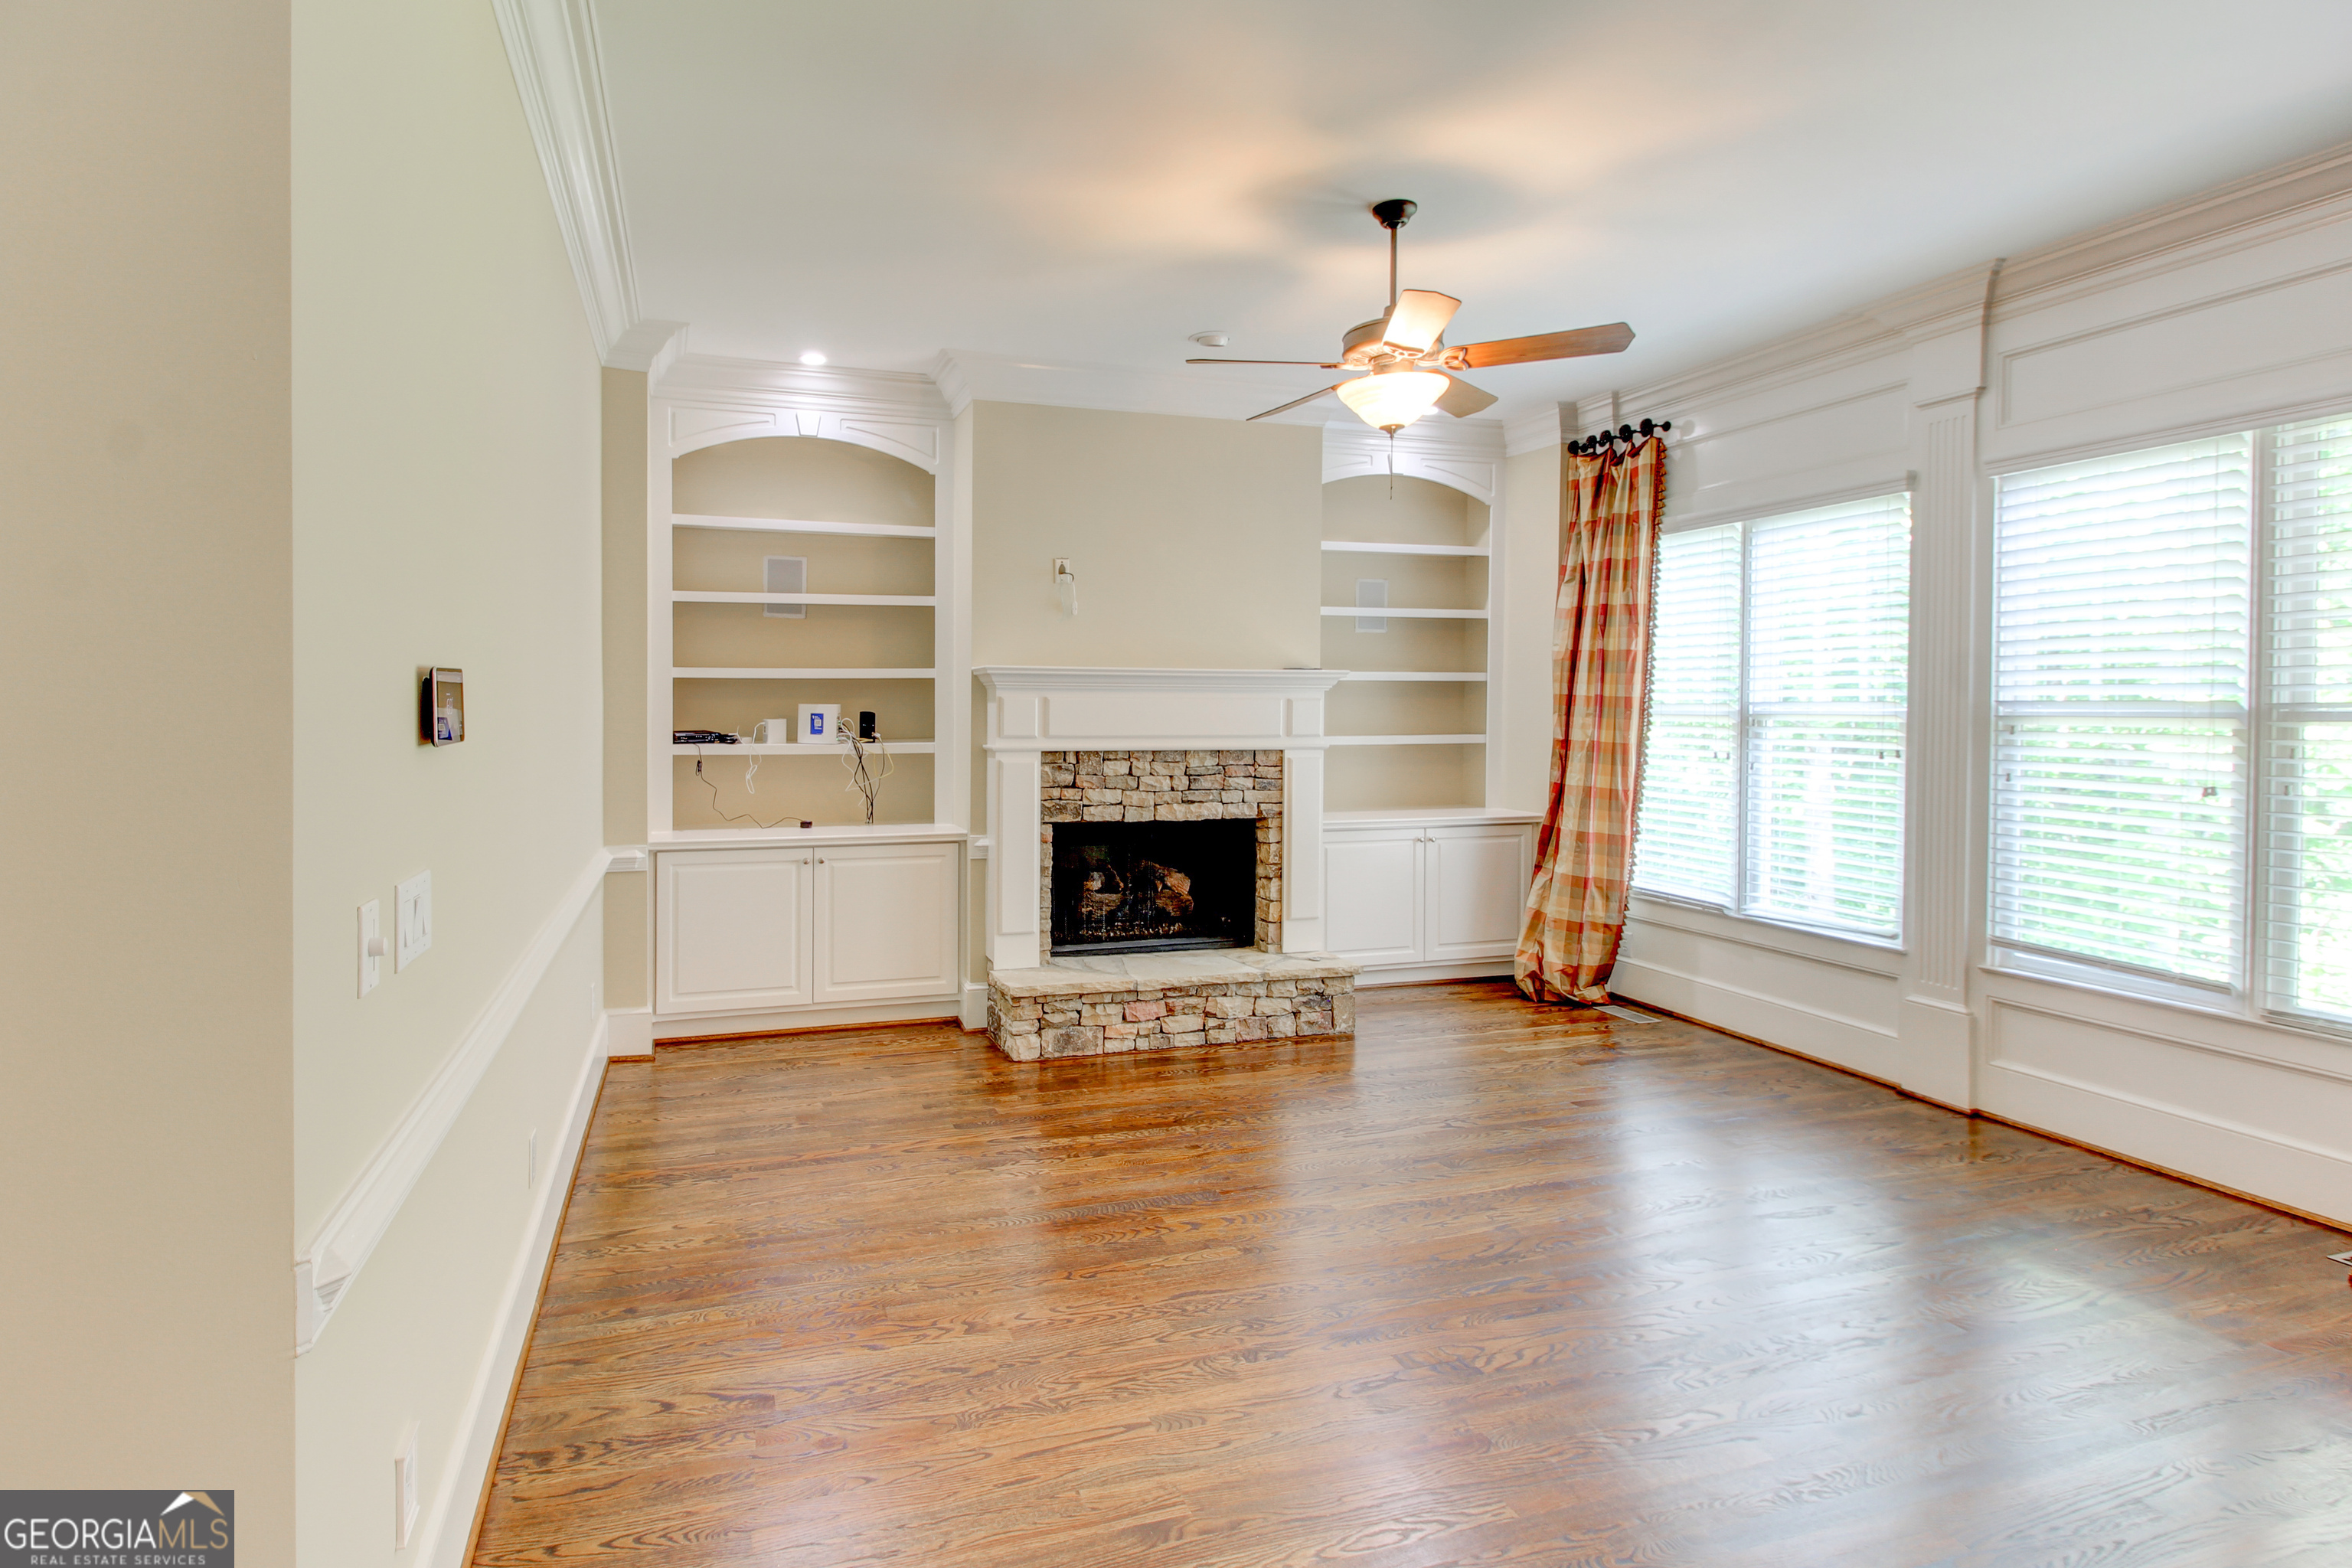
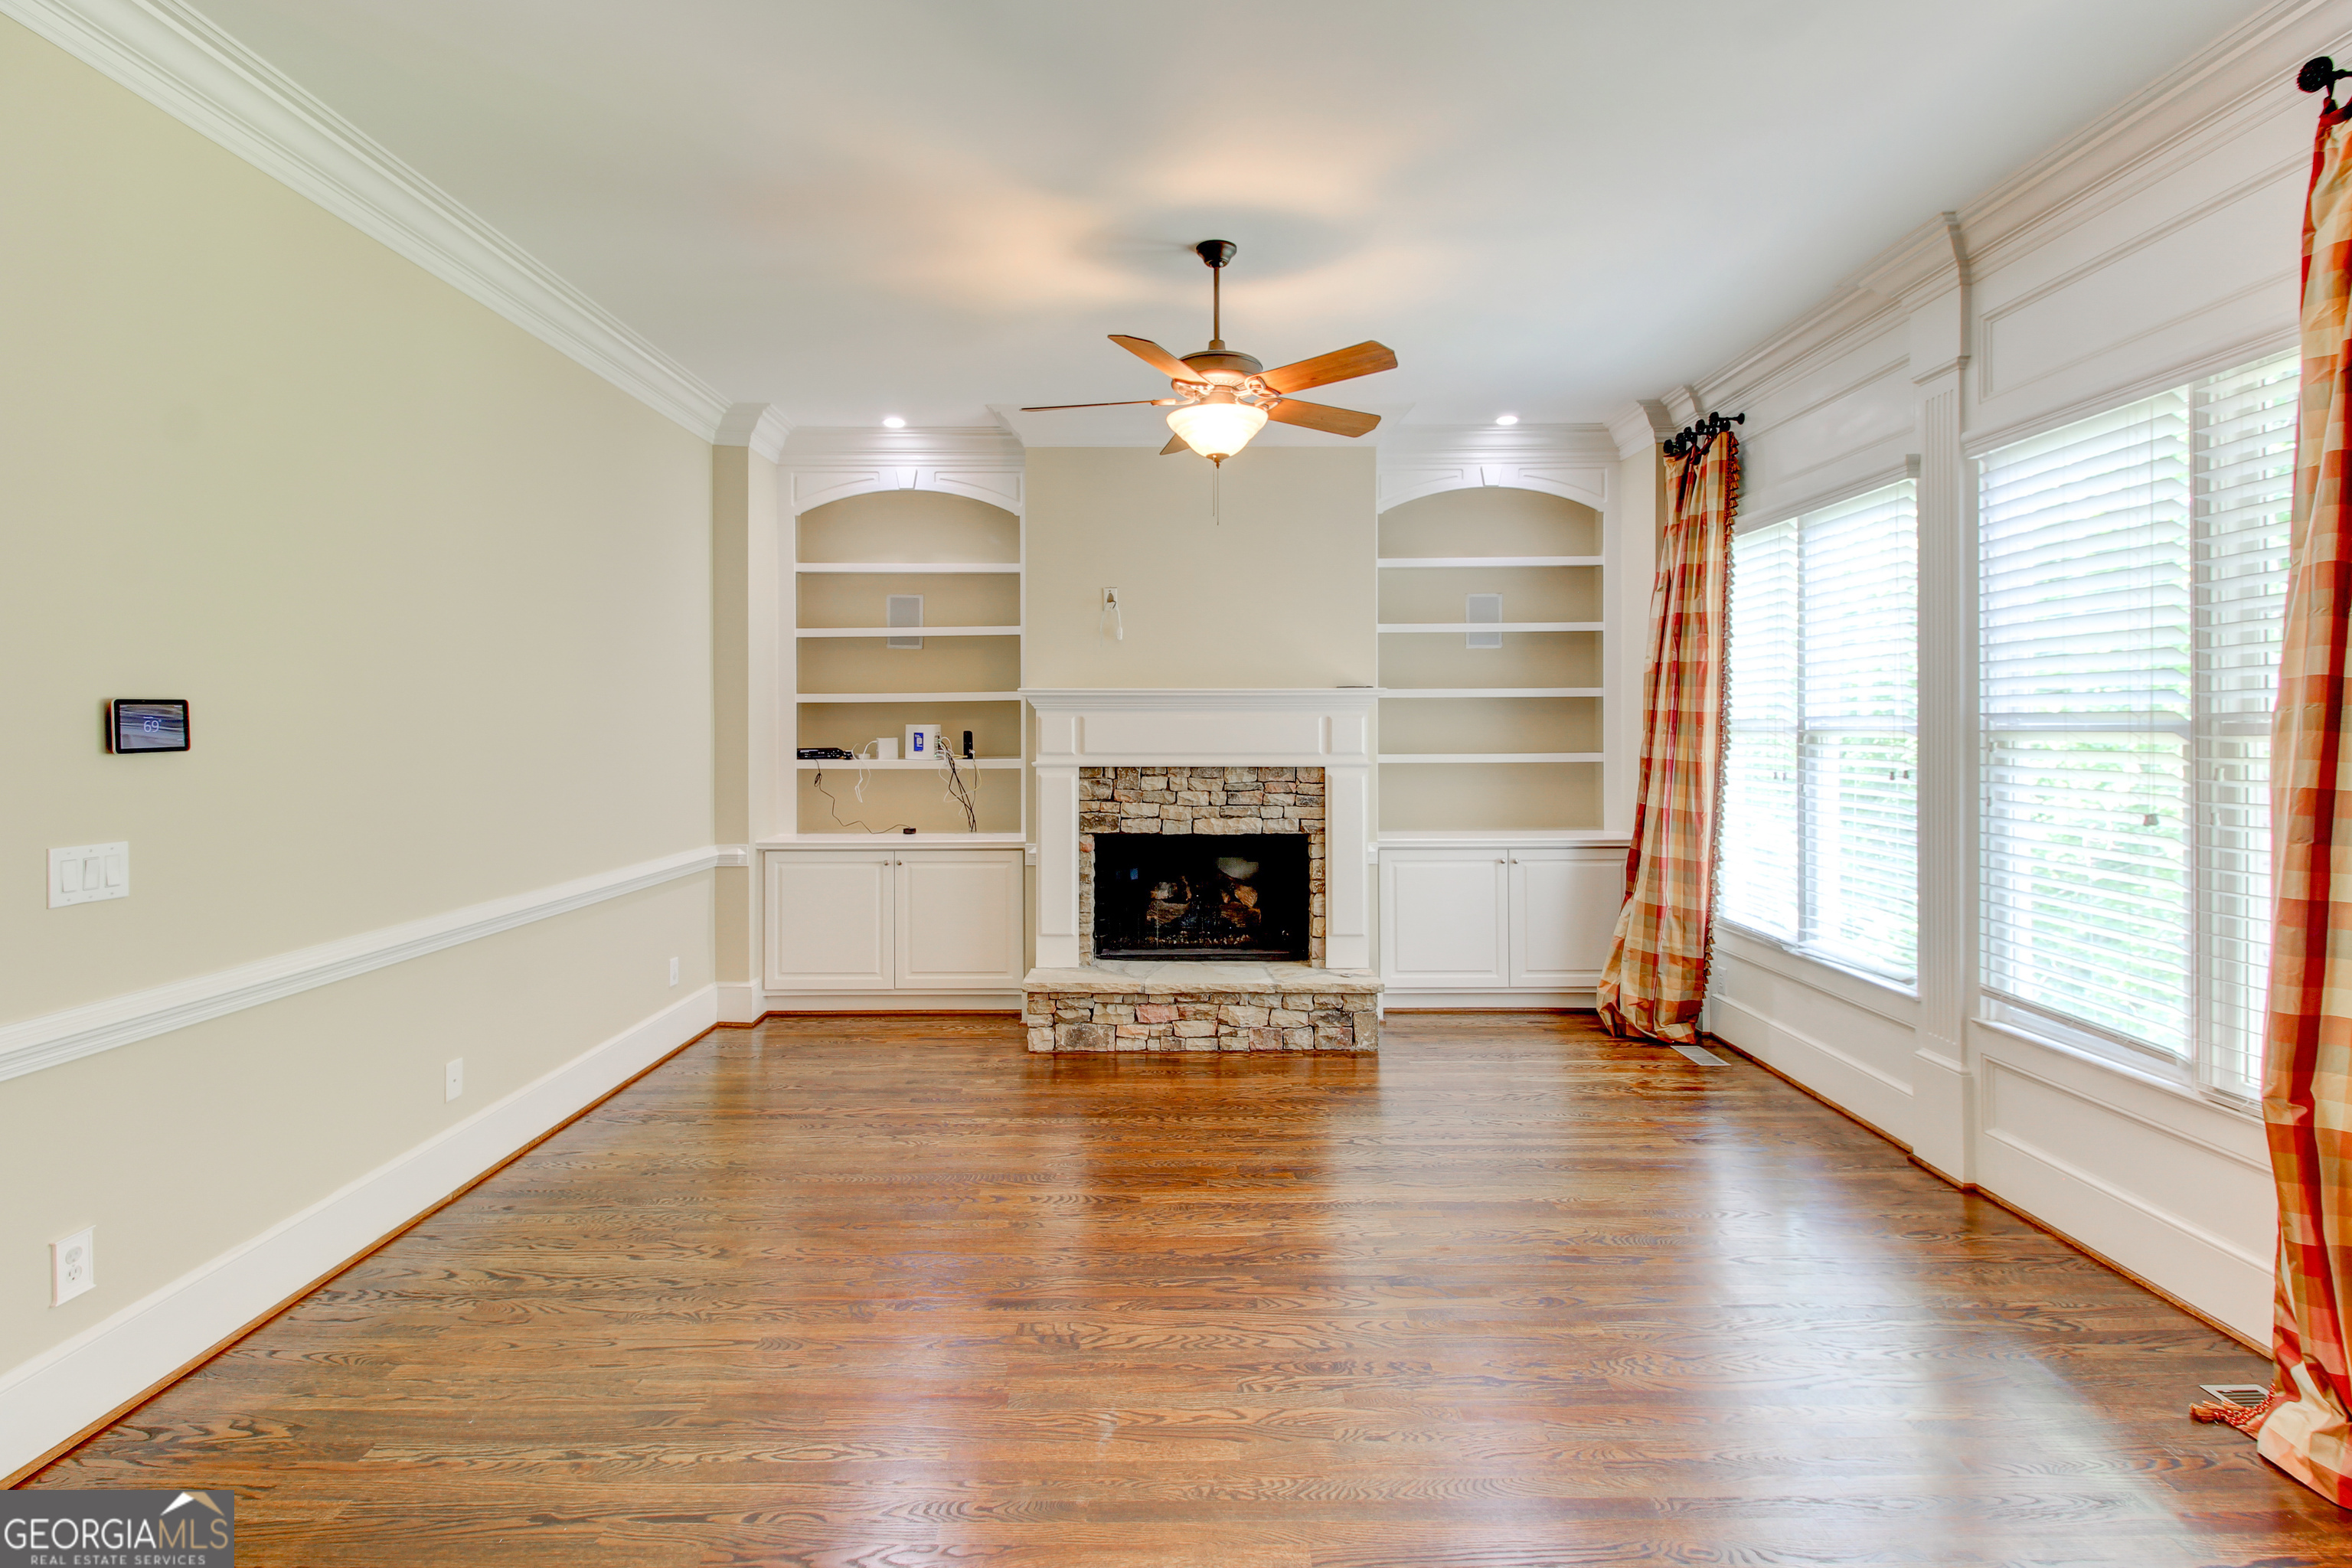
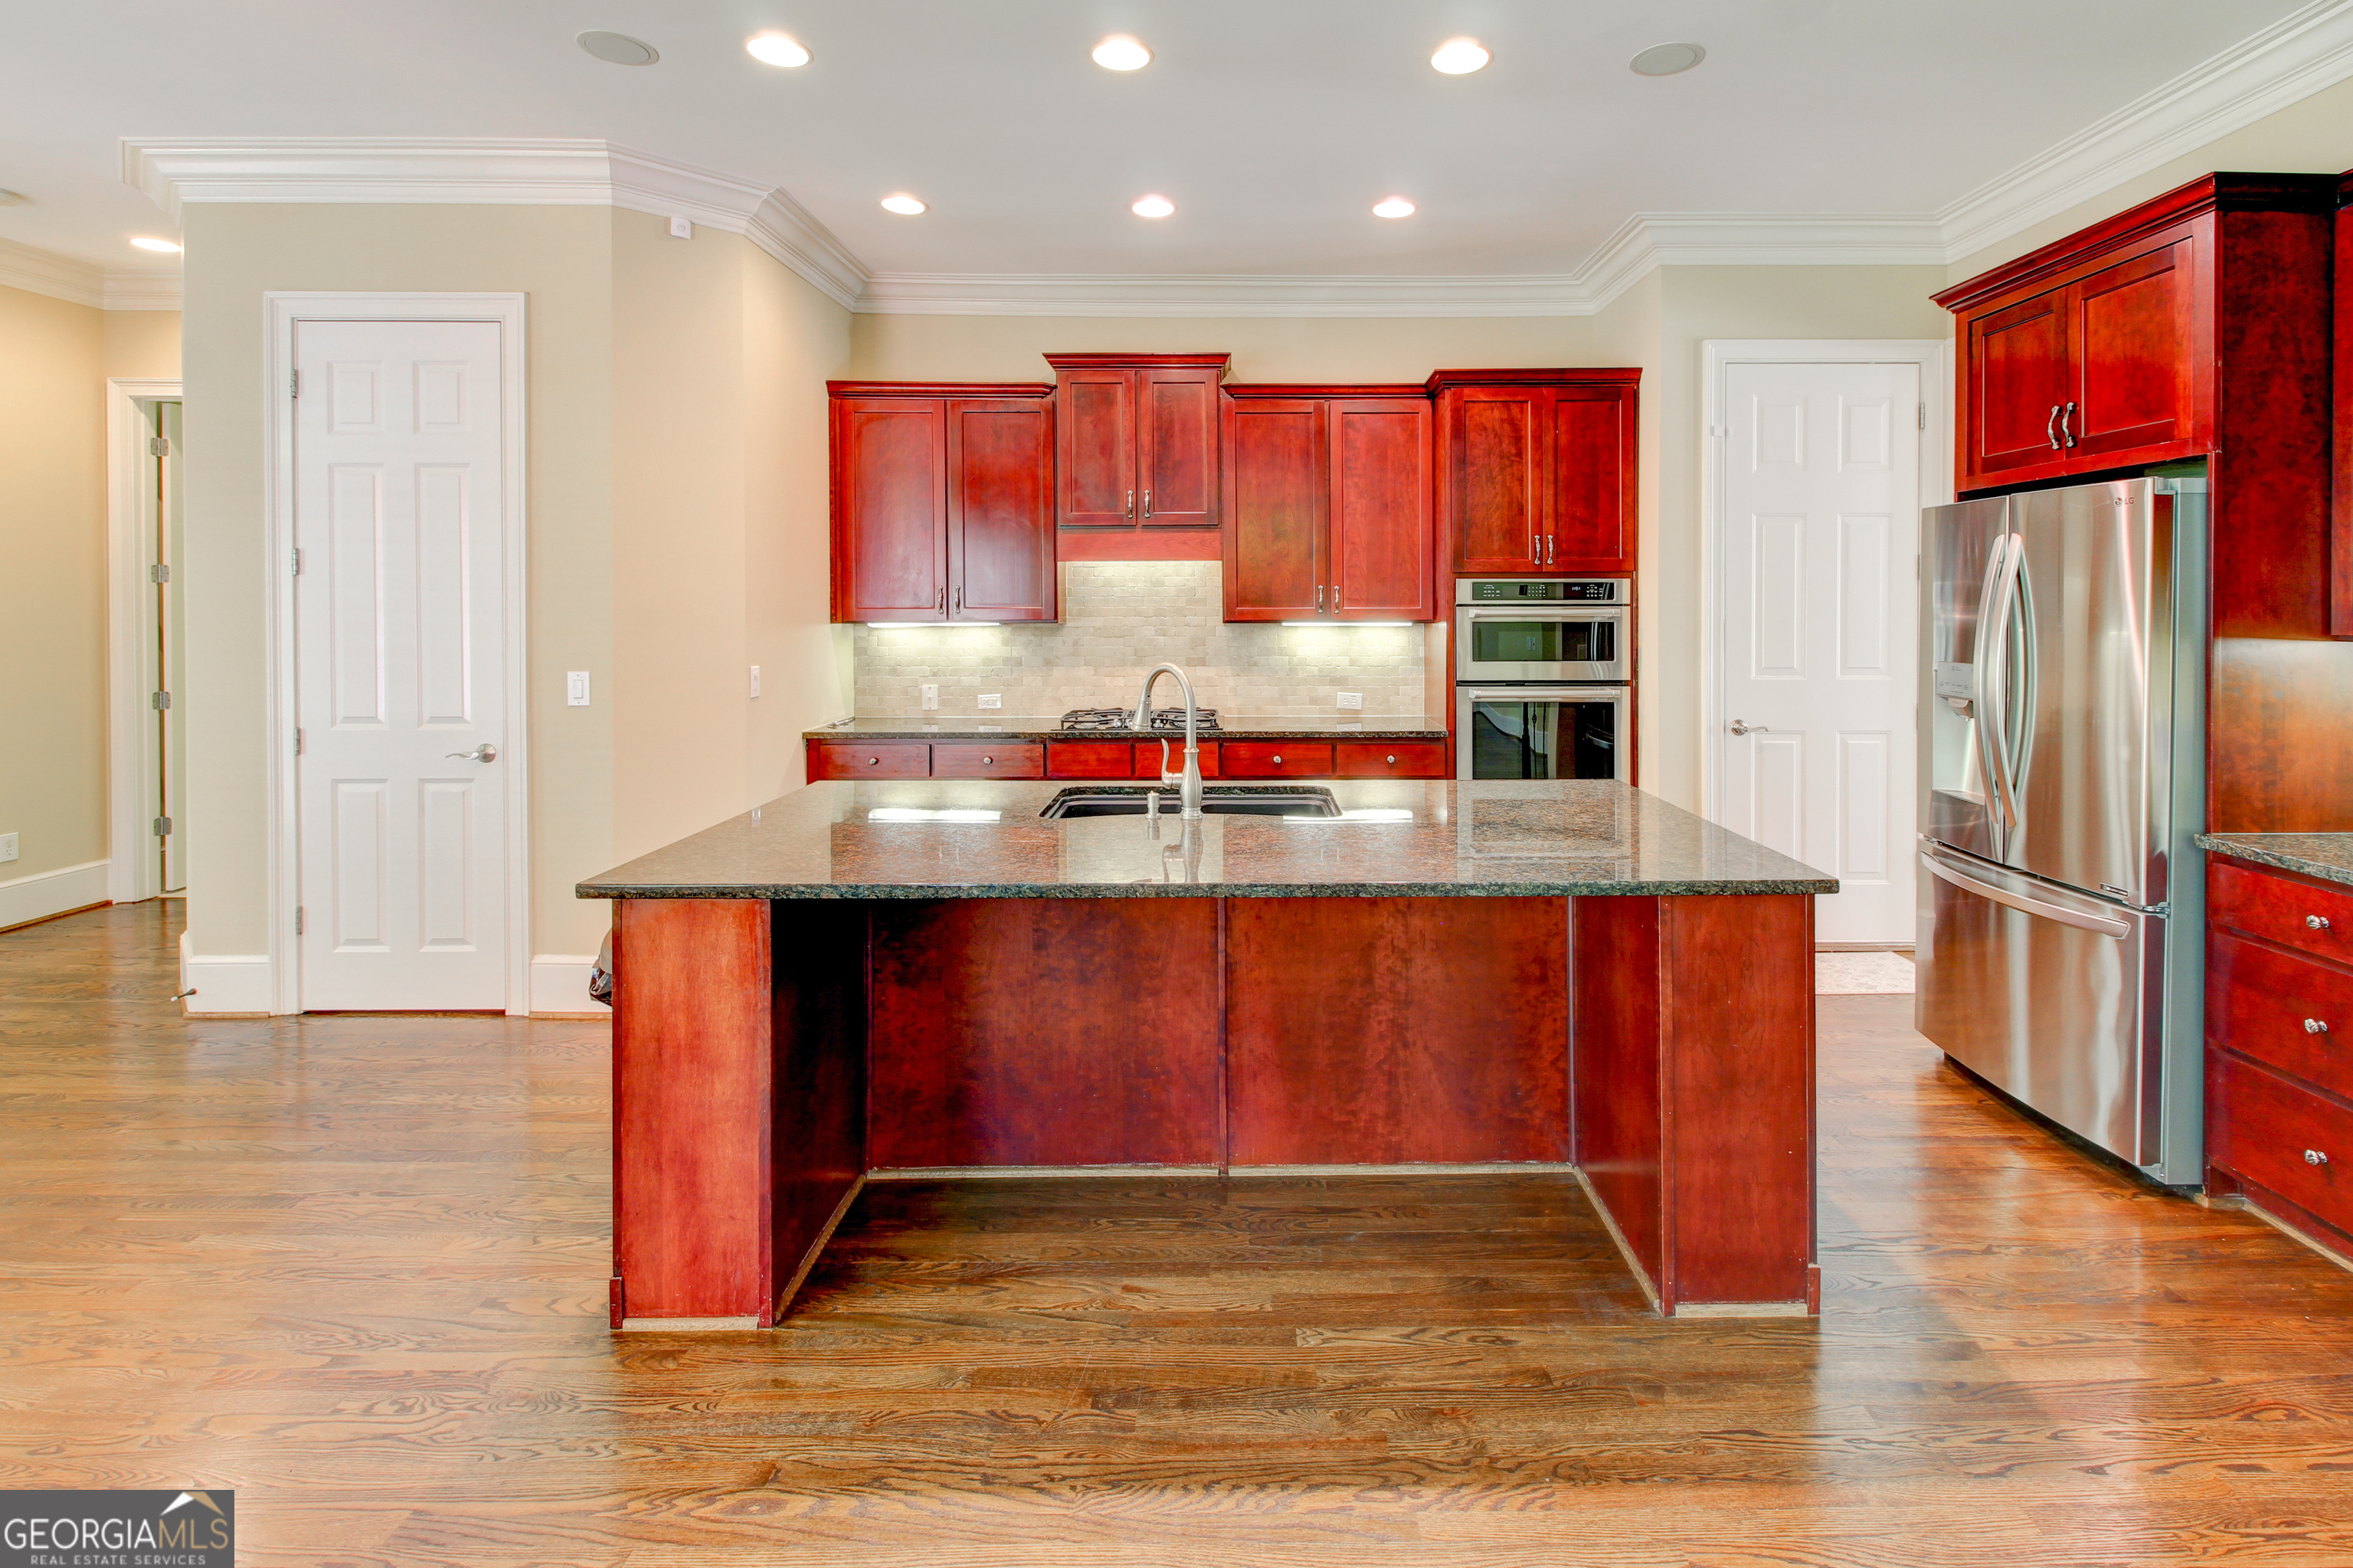
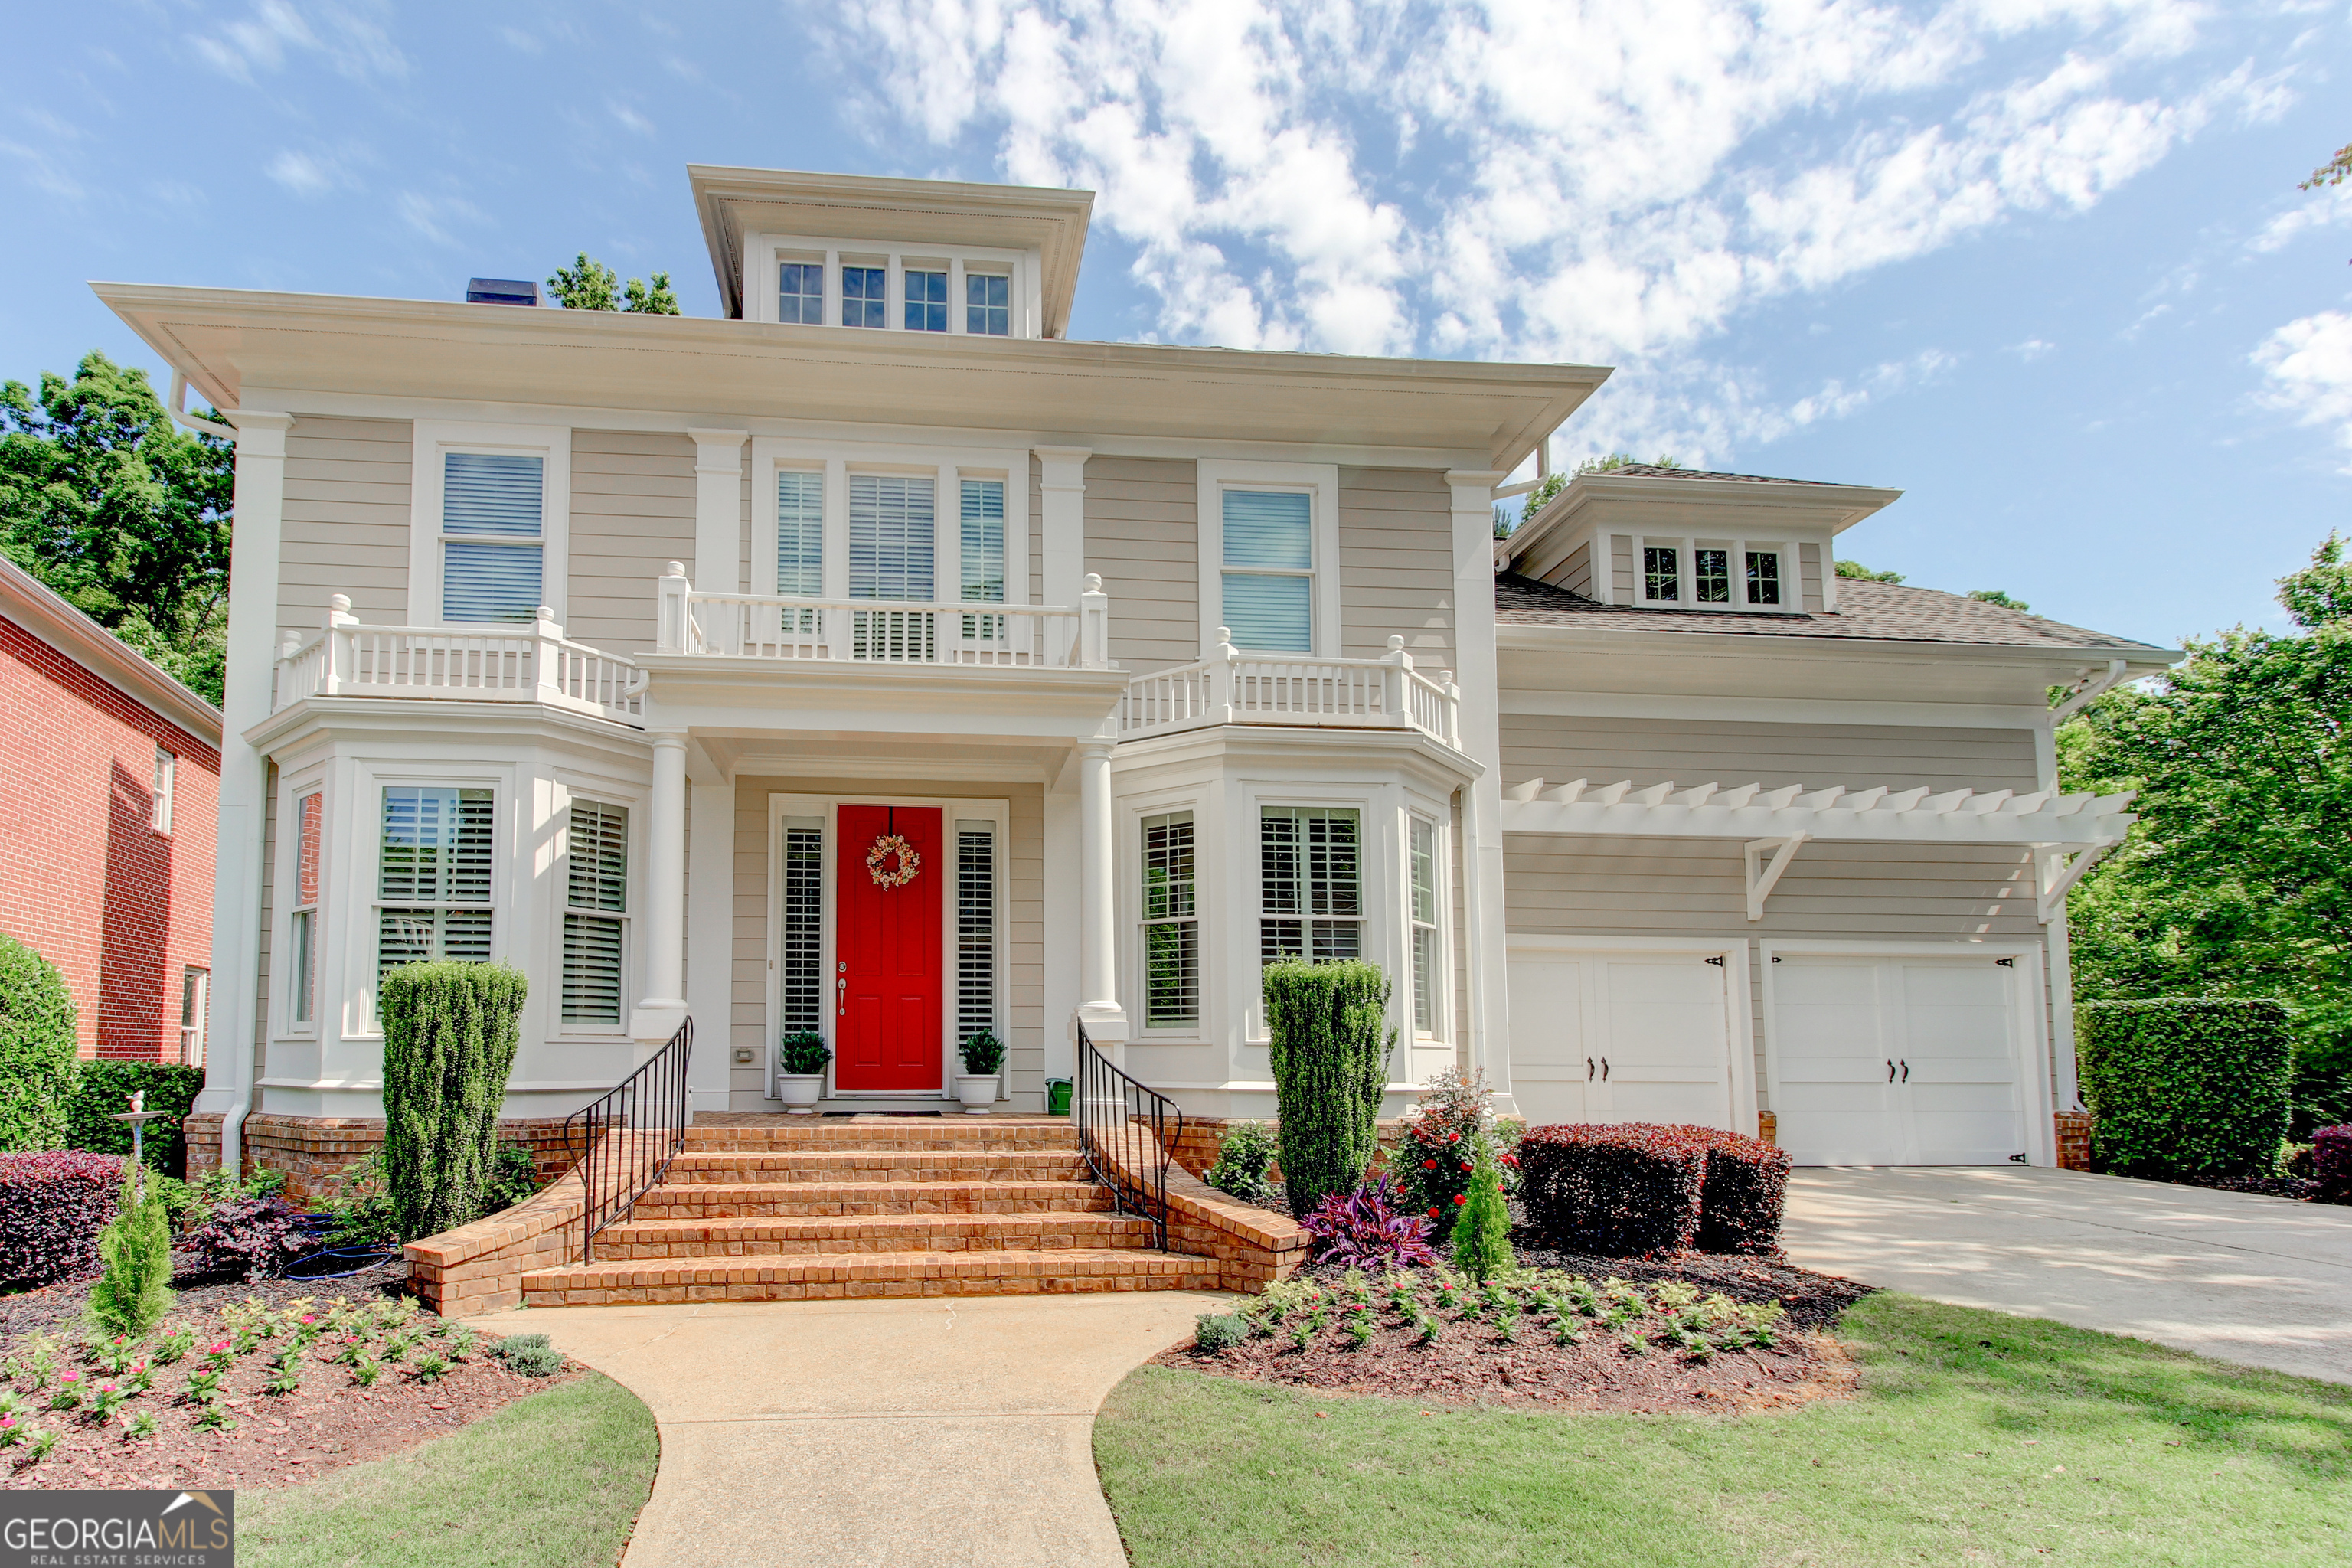
Welcome to this elegant and spacious John Wieland residence nestled in the prestigious gated Weston community. This beautifully maintained home blends timeless charm with modern convenience, featuring a curved brick stair entrance, plantation shutters, high ceilings, and extensive molding throughout, alongside an open-concept central living space for seamless entertaining or family time. Step into the heart of the home where the family room boasts built-in bookcases and a stunning stone gas log fireplace flanked by built-ins, open to a gourmet kitchen with cherry cabinets, granite countertops, and high-end finishes. The formal dining and living rooms are graced with bay windows and elegant trim, adding sophistication and warmth. The luxurious owner's suite on the main level includes a vaulted trey ceiling, his-and-hers closets (hers has been customized), a spa-like Jacuzzi soaking tub with a separate glass shower, his-and-hers vanities, and a serene retreat feel with a calming view of the private wooded backyard. Upstairs, a generous open loft area / flex space offers limitless possibilities-playroom, media room, office, home gym, etc. One of the 4 bedrooms on the second floor includes a private ensuite bath, perfect for guests or teens. The large step-down 4th bedroom is enhanced with hardwood flooring and custom built-ins, ideal as a productive home office you'll want to go to work in. The expansive finished basement is a standout feature-designed with versatility in mind. It includes a kitchenette, a large family room, and additional open space perfect for a pool table, in addition to a sizable bedroom and walk-in-closet - this space is ideal as an in-law suite or for older children needing independence and separation. Two unfinished storage rooms and a well-designed mechanical room allow easy access to all the systems as well as your less-used items. Outdoor living is just as impressive with stacked decks along with a natural gas grill, tiki torch, and stone fire pit, enveloped by a wrought iron fence and hedge which provide privacy for entertainment or relaxation. The neighborhood enhances your recreational opportunities with a clubhouse, fitness center, playground, pool, tennis courts, sidewalks, and natural areas. The interior has been freshly painted, the systems have been meticulously and consistently maintained, the "Bullet Proof" GAF roof is less than 6 years young, an irrigation system is in place for maintaining the landscape and a Water Cop system detects unusually high water flow or leaks - move in with peace of mind for years to come. This exceptional property combines luxury living, functional design, and top-tier schools-a perfect blend for modern family life. The surrounding area continues to amaze, with a nearby Medley development underway that will enhance dining, retail, and entertainment options, as well as a new interchange at I-85 and McGinnis Ferry to improve commute access.
Build Your Team
Quickly find investor-friendly professionals who can help you succeed in real estate investing at any stage of the investing journey.


Agents
Match with investor-friendly agents who can help you find, analyze, and close your next deal


Lenders
Get the best funding…find investor-friendly lenders who specialize in your deal strategy


Property Managers
Transition to passive investing. Find a trusted property management partnership that lasts.


Tax Pros & Accountants
Taxes and financial reporting made easy—find experts to create tax savings strategies, file taxes, and more
Location
Property Details
Parking
- Description: Attached, Driveway, Garage, Kitchen Level, Level Driveway
- Details: Attached, Garage, Garage Door Opener
- Garage Spaces: 2
- Spaces Total: 2
Bedroom Information
- # of Bedrooms: 6
Bathroom Information
- # of Baths (Full): 4
- # of Baths (Partial): 1
- # of Baths (Total): 4.5
Interior Features
- # of Stories: 2
- Basement: Yes
- Basement Description: Concrete, Daylight, Exterior Entry, Finished, Full, Interior Entry
- Fireplace: Yes
Exterior Features
- Exterior Walls Materials: Other
- Roof Material: Composition
HOA
- Has HOA: Yes
- HOA Fee: $1,920/annually
Land Information
- Land Use: Residential
- Land Use Subtype: Single Family Residential
Lot Information
- Parcel ID: 163145
- Lot Size: 0 sqft
Property Information
- Property Type: Single Family Residence
- Style: Brick/Frame, European, Traditional
- Year Built: 2004
Tax Information
- Annual Tax: $7,507
Utilities
- Water & Sewer: Public
- Heating: Central, Forced Air, Natural Gas, Zoned
- Cooling: Ceiling Fan(s), Central Air, Electric, Zoned
Location
- County: Forsyth
Listing Details
Investment Summary
- Monthly Cash Flow
- -$3,119
- Cap Rate
- 2.7%
- Cash-on-Cash Return
- -15.1%
- Debt Coverage Ratio
- 0.43
- Internal Rate of Return (5 years)
- -10.6%
Cash Flow
Net Operating Income (NOI) minus mortgage payments.
Calculation:
NOI - Mortgage Payments
Cap Rate (Market Value)
Capitalization Rate is a rate of return that compares the yearly Net Operating Income (NOI) to the market value.
Calculation:
NOI / Market Value
Cash-on-Cash Return (CoC)
Annual Cash Flow / Cash Invested
Calculation:
Annual cash flow divided by initial cash invested.
Debt Coverage Ratio (DCR)
Net Operating Income (NOI) divided by total debt payments.
Calculation:
NOI / Total Debt Payments
Internal Rate of Return (IRR)
A metric for assessing profitability over time. IRR is the discount rate at which the net present value (NPV) of all future cash flows (positive and negative) from an investment equals zero — including both periodic cash flow (such as rent) and a projected sale at the end of the holding period. It represents the expected annualized return, accounting for income, expenses, and the recovery of capital through a future sale.
Purchase Details
Purchase PriceThe price paid for the property. Purchase price:
| $1,075,000 |
|---|---|
Amount FinancedThe amount of the purchase financed through a loan. Amount financed:
| -$860,000 |
Down paymentThe initial payment made towards the purchase. Down payment:
| $215,000 |
Closing CostsFees and expenses associated with purchasing a property, typically ranging from 2% to 5% of the home’s purchase price, paid at the end of a home purchase to cover services like lending, title transfer, and taxes. Closing costs:
| $32,250 |
Rehab CostsCosts incurred to repair or improve the property, including: roof, flooring, exterior siding, kitchen, exterior paint, bathrooms, etc. Rehab costs:
| $0 |
Initial Cash InvestedThe total initial cash invested in the property. Calculation:Down payment + Buying costs + Rehab costs Initial cash invested:
| $247,250 |
Square Feet (SQFT)The total square footage of the property. Square feet:
| 5,543 |
Cost Per Square FootCost per square foot of the property. Calculation:Purchase Price / Square Feet Cost per square foot:
| $194 |
Monthly Rent Per Square FootMonthly rent divided by the number of square feet. This ratio helps investors compare rental income efficiency across properties, markets, and unit sizes Calculation:Monthly Rent / Square Feet Monthly rent per square foot:
| $0.83 |
Financing Details
Loan AmountThe total sum of money borrowed from a lender to finance a property purchase. Calculation:Purchase Price - Down Payment
Loan amount:
| $860,000 |
|---|---|
Loan to Value Ratio (LTV)Loan amount divided by the market value of the property. Calculation:Loan Amount / Market Value
Loan to value ratio:
| 80.0% |
Loan TypeThe type of loan (e.g., fixed, adjustable).
Loan type:
| Amortizing |
TermThe loan repayment period in years.
Term:
| 30 years |
Interest RateThe percentage a lender charges on the borrowed amount of a loan, determining the cost of borrowing money.
Interest rate:
| 6.625% |
Principal & Interest (PI)The principal is the portion of the loan payment that reduces the loan balance. The interest is the lender's charge for borrowing money. Calculation:(P * r * (1 + r) ** n) / ((1 + r) ** n - 1) Where:
P = Loan amount (principal)
Principal & interest:
| $5,507 |
Property TaxesAnnual taxes levied by local governments on real estate properties. These taxes fund public services like schools, roads, and emergency services.
Property tax:
| $626 |
InsuranceThe costs for insurance coverage to protect against financial losses due to risks like fire, natural disasters, theft, liability, or tenant-related damages. Calculation:Assumes 7% of gross rental income, unless insurance rates are specified.
Insurance:
| $322 |
Private Mortgage Insurance (PMI)A fee that borrowers pay when they take out a conventional loan with a loan-to-value (LTV) ratio above 80%.
Private mortgage insurance (PMI):
| $0 |
Monthly PaymentThe fixed amount a borrower pays each month to repay a loan. It typically includes principal and interest (P&I) and may also cover property taxes, insurance, HOA fees, and PMI if escrowed. Monthly payment:
| $6,455 |
Operating Income
| % Rent | Monthly | Yearly | |
|---|---|---|---|
Gross RentThe total rental income received from tenants before deducting any expenses. Includes base rent, late fees, pet fees, parking fees, and other recurring charges.
Gross rent:
| $4,600 | $55,200 | |
Vacancy LossExpected loss of rent due to vacancies.
Vacancy loss:
(6%)
| 6% | -$276 | -$3,312 |
Operating IncomeGross rental income minus vacancy loss. Calculation:Gross rent - Vacancy loss
Operating income:
| $4,324 | $51,888 |
Operating Expenses
| % Rent | Monthly | Yearly | |
|---|---|---|---|
Property TaxesAnnual taxes levied by local governments on real estate properties. These taxes fund public services like schools, roads, and emergency services. | 14% | -$626 | -$7,507 |
InsuranceThe costs for insurance coverage to protect against financial losses due to risks like fire, natural disasters, theft, liability, or tenant-related damages. Calculation:Assumes 7% of gross rental income, unless insurance rates are specified. | 7% | -$322 | -$3,864 |
Property ManagementThe costs associated with hiring a property manager to handle the day-to-day operations of a rental property. Includes management fees, leasing fes, eviction fees, etc. Calculation:Assumes 8% of gross rental income. | 8% | -$368 | -$4,416 |
Repairs & MaintenanceOngoing costs for routine upkeep and minor fixes needed to keep a property in good working condition. Calculation:Assumes 5% of gross rental income. Varies by property age and condition. | 5% | -$230 | -$2,760 |
Capital ExpensesLarge, infrequent costs for major improvements or replacements, like a new roof, HVAC system, or appliances. Calculation:Assumes 5% of gross rental income. Varies by property age. | 5% | -$230 | -$2,760 |
HOA FeesRegular dues paid to a Homeowners Association for community maintenance, amenities, and management. Similar fees include: Condo Association Fees, Co-op Maintenance Fees, etc. | 3% | -$160 | -$1,920 |
Operating ExpensesRecurring costs required to maintain and manage a rental property, including property taxes, insurance, maintenance, repairs, utilities (if paid by the owner), property management fees, and other day-to-day expenses. Calculation:Insurance + Property Taxes + Property Management + Repairs & Maintenance + Capital Expenditures + HOA Fees | 42% | -$1,936 | -$23,227 |
Cash Flow
| Monthly | Yearly | |
|---|---|---|
Net Operating Income (NOI)The income generated from a property after deducting all operating expenses but before deducting mortgage payments, taxes, and capital expenditures. Calculation:Gross Operating Income - Operating Expenses
Net operating income:
| $2,388 | $28,656 |
Mortgage PaymentThe fixed amount a borrower pays each month to repay a loan. It typically includes principal and interest (P&I) and may also cover property taxes, insurance, HOA fees, and PMI if escrowed. | -$5,507 | -$66,084 |
Cash FlowNet Operating Income (NOI) minus mortgage payments. Calculation:NOI - Mortgage Payments | -$3,119 | -$37,428 |