$1,850,000
Investment Summary
- Monthly Cash Flow
- -$4,072
- Cap Rate
- 3.5%
- Cash-on-Cash Return
- -11.5%
- Debt Coverage Ratio
- 0.57
- Internal Rate of Return (5 years)
- -7.1%
Cash Flow
Net Operating Income (NOI) minus mortgage payments.
Calculation:
NOI - Mortgage Payments
Cap Rate (Market Value)
Capitalization Rate is a rate of return that compares the yearly Net Operating Income (NOI) to the market value.
Calculation:
NOI / Market Value
Cash-on-Cash Return (CoC)
Annual Cash Flow / Cash Invested
Calculation:
Annual cash flow divided by initial cash invested.
Debt Coverage Ratio (DCR)
Net Operating Income (NOI) divided by total debt payments.
Calculation:
NOI / Total Debt Payments
Internal Rate of Return (IRR)
A metric for assessing profitability over time. IRR is the discount rate at which the net present value (NPV) of all future cash flows (positive and negative) from an investment equals zero — including both periodic cash flow (such as rent) and a projected sale at the end of the holding period. It represents the expected annualized return, accounting for income, expenses, and the recovery of capital through a future sale.
Property Description
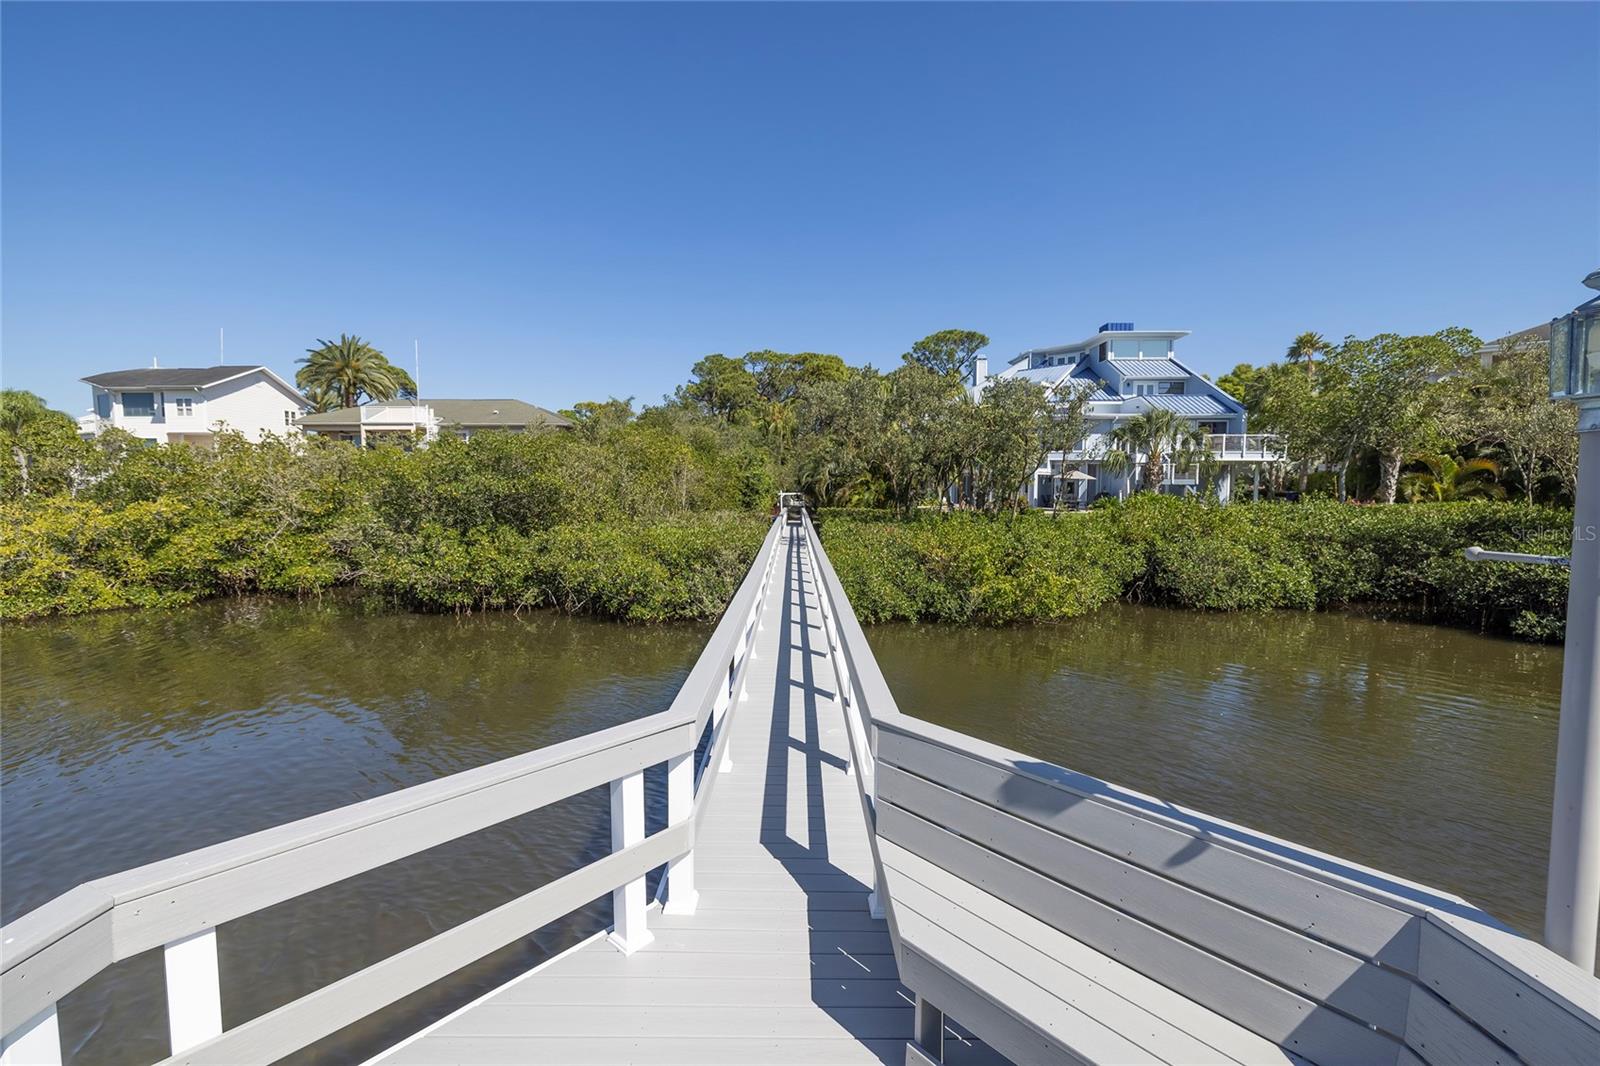
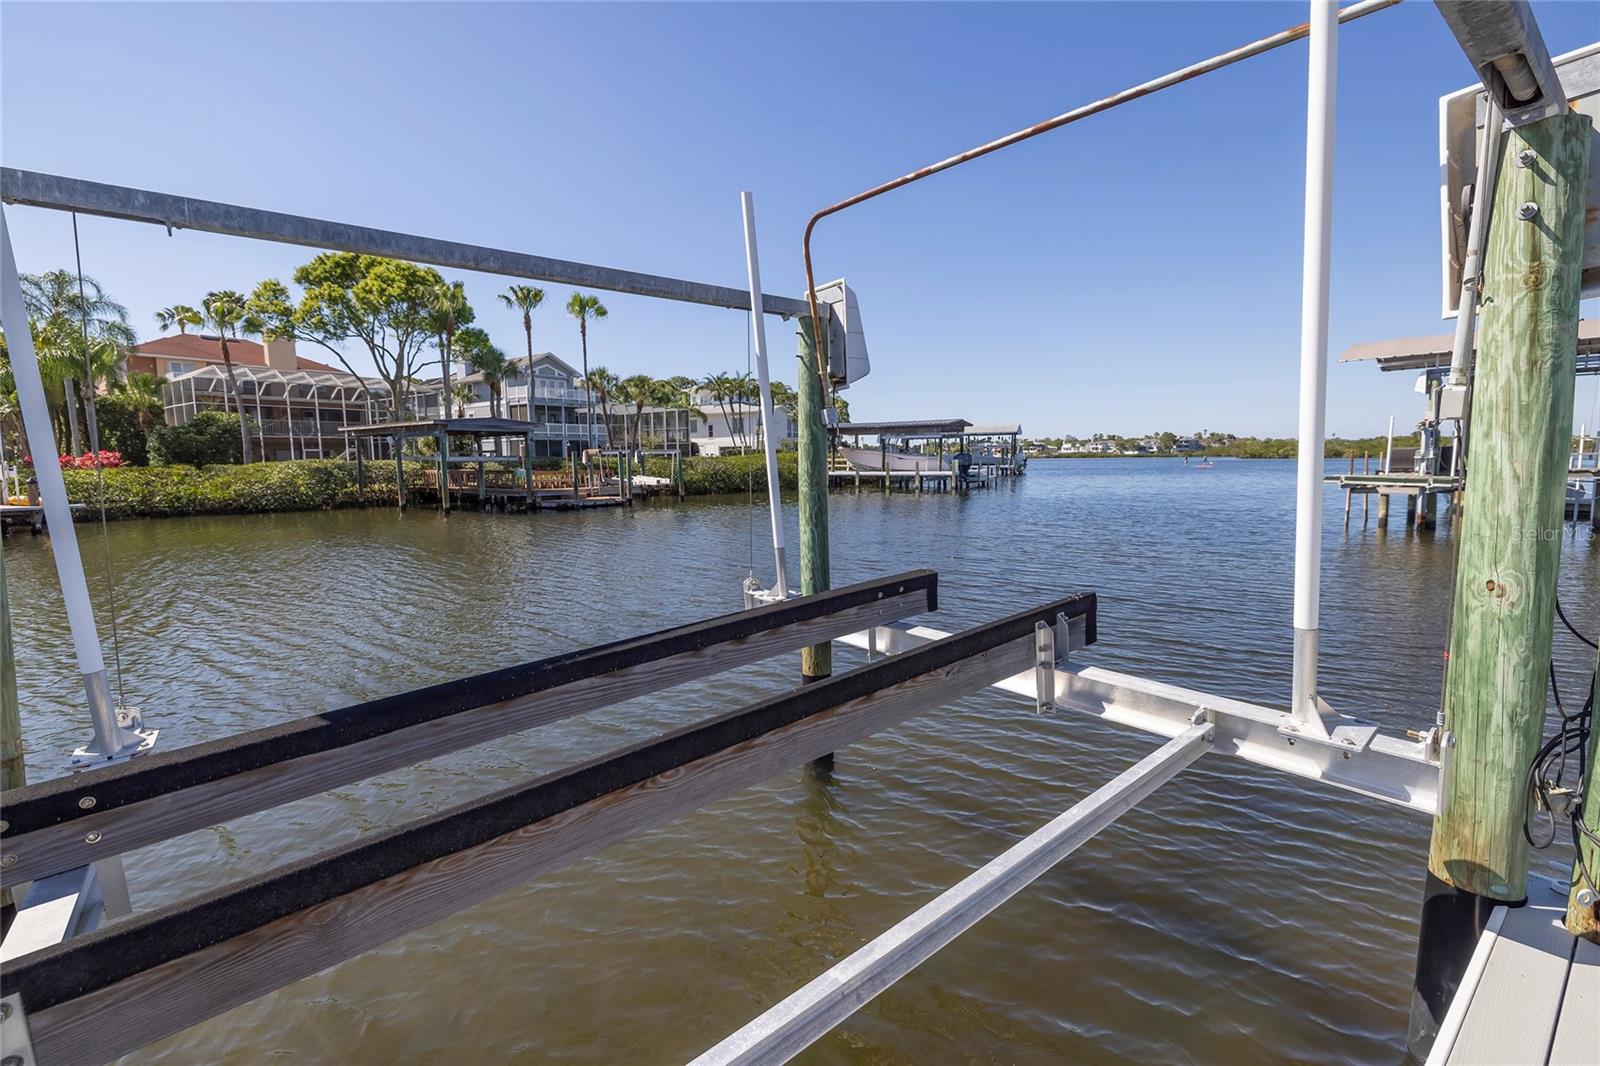
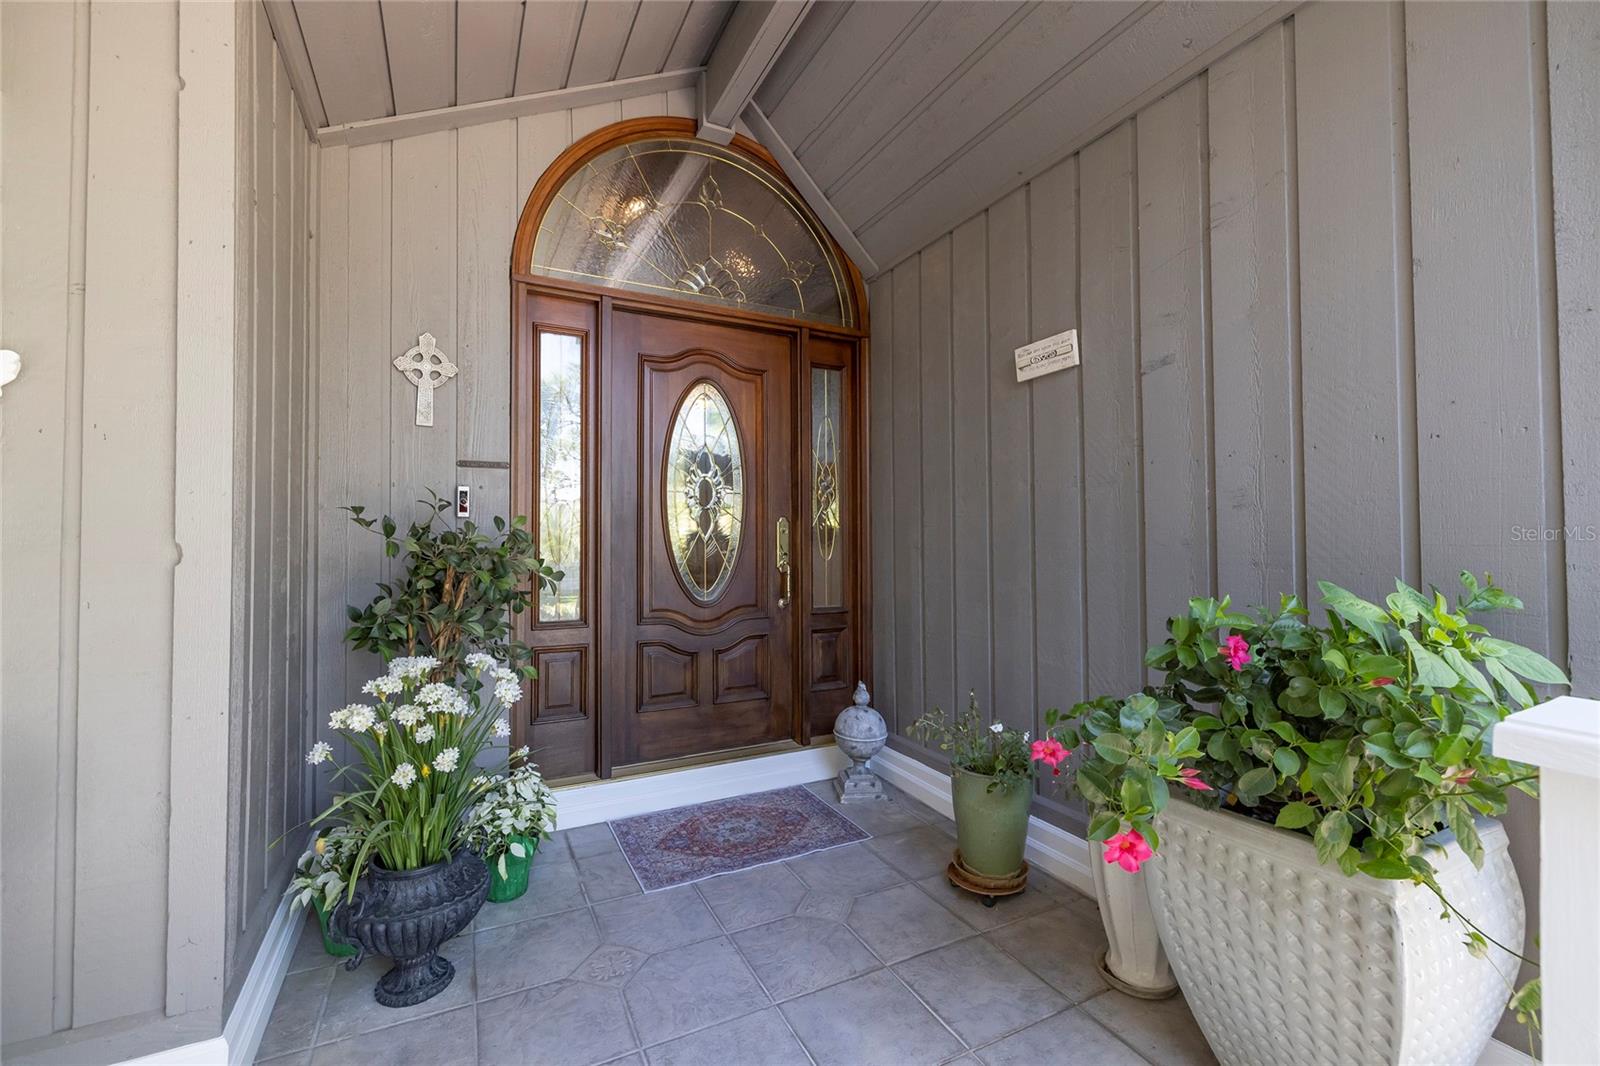
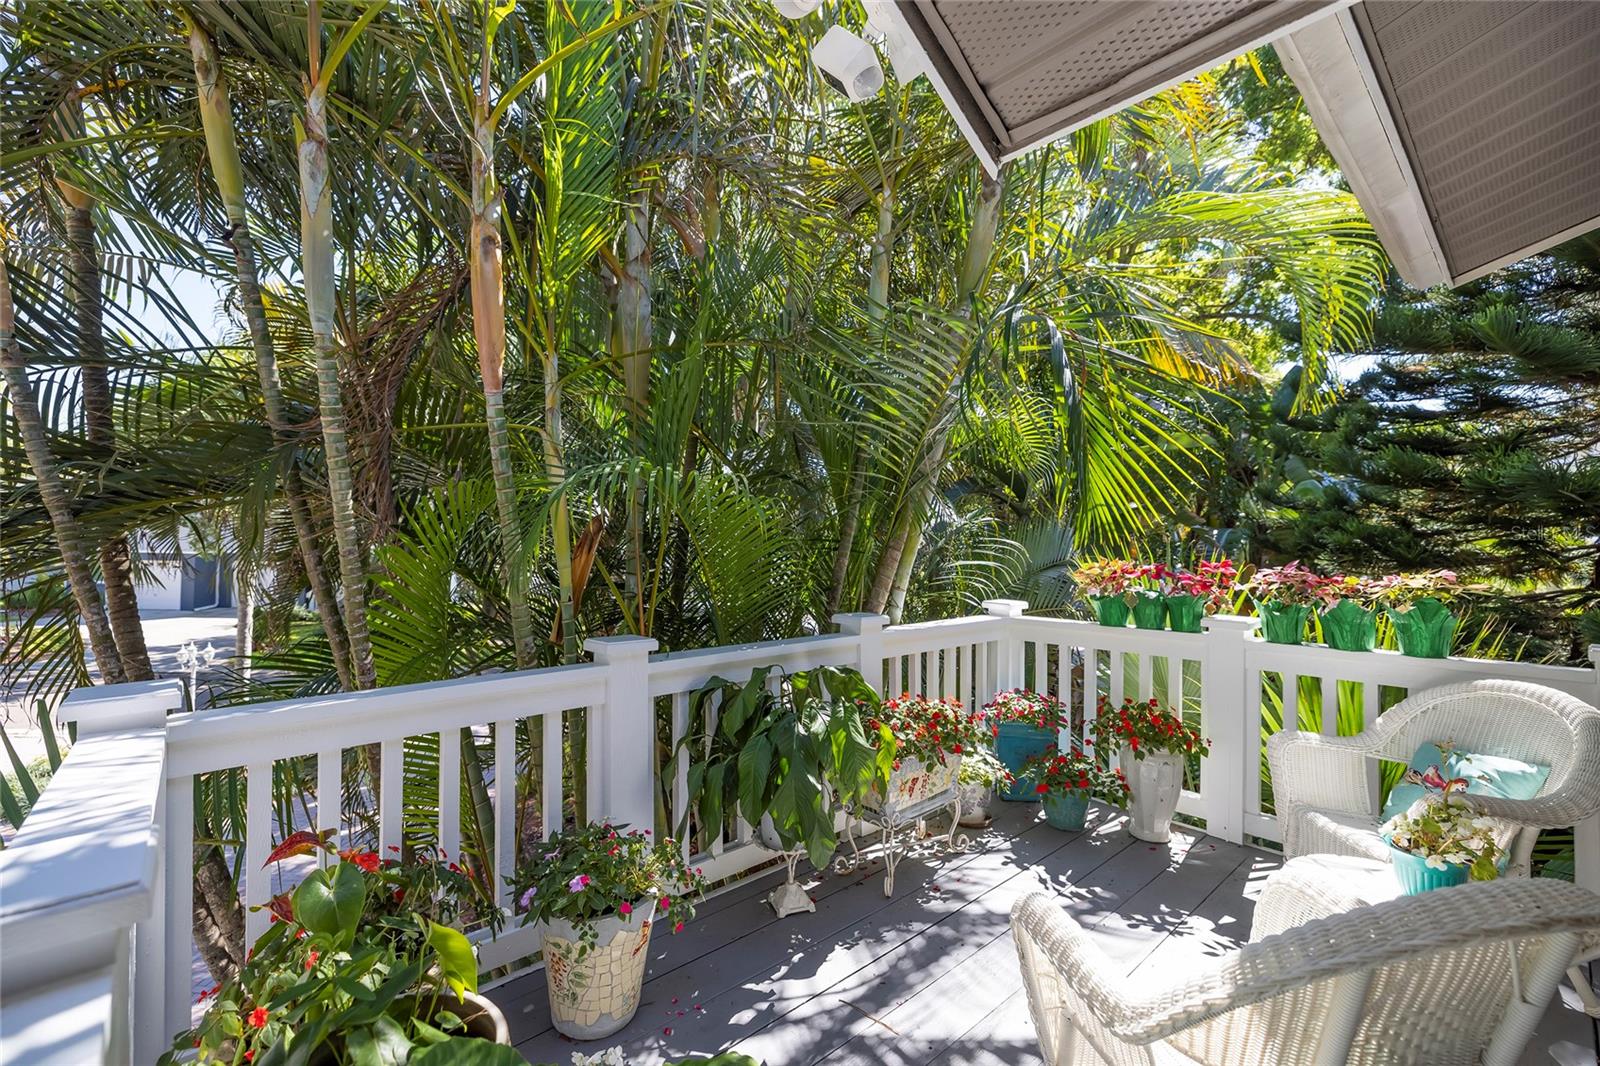
A Rare Gem on a Double Lot: Discover an exceptional waterfront retreat in the heart of Palm Harbor, where tropical paradise meets unmatched opportunity. This expansive property sits on combined lots 8,9 and waterfront lot 9A—providing direct Gulf Water access with private dock & boat lift as well as ample space for family living, outdoor activities, and even future expansion or building. The home features 5 bedrooms, 4 1/2 baths, a Home Theater, a Loft with a Piano (which conveys with the home), and a Bonus Flex Space with its own full bathroom. Step into a thoughtfully designed open living area with soaring ceilings, a cozy wood-burning fireplace, and decorative wood accents, while multiple French doors lead to a serene balcony overlooking the pool, spa and lush landscaping. The primary suite on the main floor boasts a fully remodeled en-suite bath, his and hers closets, high ceilings and a French door which leads to the balcony. The split-floor plan in this home offers plenty of privacy for all parties as two of the guest bedrooms are located on the main floor and 2 are located on the third floor, along with the theatre room which is modern and gorgeous! Step out to the third-floor balcony for a fabulous space to relax and unwind and take in the beauty of the lush surroundings. The kitchen is a delight with custom wood cabinetry, granite counters, and bar seating, seamlessly opening to the home’s outdoor entertainment oasis. Enjoy the stunning Pool and Spa, an outdoor kitchen with bar seating for six, a pergola-shaded lounge area, and a gazebo—perfect for creating lifelong memories with friends and family. The extensive outdoor areas are complemented by meticulously maintained tropical landscaping, creating an incredibly private sanctuary. This property offers more than just space; it provides a lifestyle. With a personal dock, 5,000-lb boat lift, and exclusive water access, you’re just minutes away from Caledesi, Three Rooker, and Honeymoon Islands. Key Features: • Combined Lots 8, 9, waterfront Lot 9A, providing unparalleled outdoor space and flexibility. • Recent Updates: New shingle roof (2022), three AC units ( 2 units in 2020 and 1 unit in 2024), composite dock (2018), new boat lift cradle (2019), updated electric for the dock and lift (2024) and epoxy garage flooring (2021). • Prime Location: A short golf-cart ride to Ozona’s lively dining and music scene, three blocks from Palm Harbor’s downtown restaurants and the 54-mile Pinellas Trail, and just 3.7 miles from Honeymoon Island Beach. • Low flood insurance! Sellers currently pay only $500 for flood insurance and it is transferrable! This home had no flooding to the main home in the recent hurricanes (or any hurricane in the past)-flooding occurred in garage level only. Zoned for top-rated schools, including Palm Harbor University, this home is perfect for families looking for space to grow, entertain, and enjoy an active lifestyle. Whether you're seeking a private retreat or dreaming of future expansion, this unique double-lot property has it all. Don’t miss this extraordinary opportunity—schedule your private showing today!
Build Your Team
Quickly find investor-friendly professionals who can help you succeed in real estate investing at any stage of the investing journey.


Agents
Match with investor-friendly agents who can help you find, analyze, and close your next deal


Lenders
Get the best funding…find investor-friendly lenders who specialize in your deal strategy


Property Managers
Transition to passive investing. Find a trusted property management partnership that lasts.


Tax Pros & Accountants
Taxes and financial reporting made easy—find experts to create tax savings strategies, file taxes, and more
Location
Property Details
Parking
- Description: Garage Door Opener, Oversized, Split Garage, Under Building
- Details: Garage Door Opener, Oversized, Garage, Basement, Attached
- Garage Spaces: 2
- Spaces Total: 0
Bedroom Information
- # of Bedrooms: 5
Bathroom Information
- # of Baths (Full): 4
- # of Baths (Partial): 1
- # of Baths (Total): 5.0
Interior Features
- # of Rooms: 10
- # of Stories: 3
- Fireplace: Yes
Exterior Features
- Exterior Walls Materials: Wood
- Roof Type: Gable
- Roof Material: Shingle
- Pool: Yes
Land Information
- Land Use: Residential
- Land Use Subtype: Single Family Residential
Lot Information
- Parcel ID: 022815779170000090
- Lot Size: 26759 sqft
Property Information
- Property Type: Single Family Residence
- Year Built: 1985
Tax Information
- Annual Tax: $8,826
Utilities
- Water & Sewer: Public
- Heating: Central
- Cooling: Central Air
Location
- County: Pinellas
Listing Details
Investment Summary
- Monthly Cash Flow
- -$4,072
- Cap Rate
- 3.5%
- Cash-on-Cash Return
- -11.5%
- Debt Coverage Ratio
- 0.57
- Internal Rate of Return (5 years)
- -7.1%
Cash Flow
Net Operating Income (NOI) minus mortgage payments.
Calculation:
NOI - Mortgage Payments
Cap Rate (Market Value)
Capitalization Rate is a rate of return that compares the yearly Net Operating Income (NOI) to the market value.
Calculation:
NOI / Market Value
Cash-on-Cash Return (CoC)
Annual Cash Flow / Cash Invested
Calculation:
Annual cash flow divided by initial cash invested.
Debt Coverage Ratio (DCR)
Net Operating Income (NOI) divided by total debt payments.
Calculation:
NOI / Total Debt Payments
Internal Rate of Return (IRR)
A metric for assessing profitability over time. IRR is the discount rate at which the net present value (NPV) of all future cash flows (positive and negative) from an investment equals zero — including both periodic cash flow (such as rent) and a projected sale at the end of the holding period. It represents the expected annualized return, accounting for income, expenses, and the recovery of capital through a future sale.
Purchase Details
Purchase PriceThe price paid for the property. Purchase price:
| $1,850,000 |
|---|---|
Amount FinancedThe amount of the purchase financed through a loan. Amount financed:
| -$1,480,000 |
Down paymentThe initial payment made towards the purchase. Down payment:
| $370,000 |
Closing CostsFees and expenses associated with purchasing a property, typically ranging from 2% to 5% of the home’s purchase price, paid at the end of a home purchase to cover services like lending, title transfer, and taxes. Closing costs:
| $55,500 |
Rehab CostsCosts incurred to repair or improve the property, including: roof, flooring, exterior siding, kitchen, exterior paint, bathrooms, etc. Rehab costs:
| $0 |
Initial Cash InvestedThe total initial cash invested in the property. Calculation:Down payment + Buying costs + Rehab costs Initial cash invested:
| $425,500 |
Square Feet (SQFT)The total square footage of the property. Square feet:
| 3,003 |
Cost Per Square FootCost per square foot of the property. Calculation:Purchase Price / Square Feet Cost per square foot:
| $616 |
Monthly Rent Per Square FootMonthly rent divided by the number of square feet. This ratio helps investors compare rental income efficiency across properties, markets, and unit sizes Calculation:Monthly Rent / Square Feet Monthly rent per square foot:
| $2.96 |
Financing Details
Loan AmountThe total sum of money borrowed from a lender to finance a property purchase. Calculation:Purchase Price - Down Payment
Loan amount:
| $1,480,000 |
|---|---|
Loan to Value Ratio (LTV)Loan amount divided by the market value of the property. Calculation:Loan Amount / Market Value
Loan to value ratio:
| 80.0% |
Loan TypeThe type of loan (e.g., fixed, adjustable).
Loan type:
| Amortizing |
TermThe loan repayment period in years.
Term:
| 30 years |
Interest RateThe percentage a lender charges on the borrowed amount of a loan, determining the cost of borrowing money.
Interest rate:
| 6.625% |
Principal & Interest (PI)The principal is the portion of the loan payment that reduces the loan balance. The interest is the lender's charge for borrowing money. Calculation:(P * r * (1 + r) ** n) / ((1 + r) ** n - 1) Where:
P = Loan amount (principal)
Principal & interest:
| $9,477 |
Property TaxesAnnual taxes levied by local governments on real estate properties. These taxes fund public services like schools, roads, and emergency services.
Property tax:
| $736 |
InsuranceThe costs for insurance coverage to protect against financial losses due to risks like fire, natural disasters, theft, liability, or tenant-related damages. Calculation:Assumes 7% of gross rental income, unless insurance rates are specified.
Insurance:
| $623 |
Private Mortgage Insurance (PMI)A fee that borrowers pay when they take out a conventional loan with a loan-to-value (LTV) ratio above 80%.
Private mortgage insurance (PMI):
| $0 |
Monthly PaymentThe fixed amount a borrower pays each month to repay a loan. It typically includes principal and interest (P&I) and may also cover property taxes, insurance, HOA fees, and PMI if escrowed. Monthly payment:
| $10,836 |
Operating Income
| % Rent | Monthly | Yearly | |
|---|---|---|---|
Gross RentThe total rental income received from tenants before deducting any expenses. Includes base rent, late fees, pet fees, parking fees, and other recurring charges.
Gross rent:
| $8,900 | $106,800 | |
Vacancy LossExpected loss of rent due to vacancies.
Vacancy loss:
(6%)
| 6% | -$534 | -$6,408 |
Operating IncomeGross rental income minus vacancy loss. Calculation:Gross rent - Vacancy loss
Operating income:
| $8,366 | $100,392 |
Operating Expenses
| % Rent | Monthly | Yearly | |
|---|---|---|---|
Property TaxesAnnual taxes levied by local governments on real estate properties. These taxes fund public services like schools, roads, and emergency services. | 8% | -$736 | -$8,826 |
InsuranceThe costs for insurance coverage to protect against financial losses due to risks like fire, natural disasters, theft, liability, or tenant-related damages. Calculation:Assumes 7% of gross rental income, unless insurance rates are specified. | 7% | -$623 | -$7,476 |
Property ManagementThe costs associated with hiring a property manager to handle the day-to-day operations of a rental property. Includes management fees, leasing fes, eviction fees, etc. Calculation:Assumes 8% of gross rental income. | 8% | -$712 | -$8,544 |
Repairs & MaintenanceOngoing costs for routine upkeep and minor fixes needed to keep a property in good working condition. Calculation:Assumes 5% of gross rental income. Varies by property age and condition. | 5% | -$445 | -$5,340 |
Capital ExpensesLarge, infrequent costs for major improvements or replacements, like a new roof, HVAC system, or appliances. Calculation:Assumes 5% of gross rental income. Varies by property age. | 5% | -$445 | -$5,340 |
HOA FeesRegular dues paid to a Homeowners Association for community maintenance, amenities, and management. Similar fees include: Condo Association Fees, Co-op Maintenance Fees, etc. | n/a | n/a | n/a |
Operating ExpensesRecurring costs required to maintain and manage a rental property, including property taxes, insurance, maintenance, repairs, utilities (if paid by the owner), property management fees, and other day-to-day expenses. Calculation:Insurance + Property Taxes + Property Management + Repairs & Maintenance + Capital Expenditures + HOA Fees | 33% | -$2,961 | -$35,526 |
Cash Flow
| Monthly | Yearly | |
|---|---|---|
Net Operating Income (NOI)The income generated from a property after deducting all operating expenses but before deducting mortgage payments, taxes, and capital expenditures. Calculation:Gross Operating Income - Operating Expenses
Net operating income:
| $5,405 | $64,860 |
Mortgage PaymentThe fixed amount a borrower pays each month to repay a loan. It typically includes principal and interest (P&I) and may also cover property taxes, insurance, HOA fees, and PMI if escrowed. | -$9,477 | -$113,724 |
Cash FlowNet Operating Income (NOI) minus mortgage payments. Calculation:NOI - Mortgage Payments | $4,072 | $48,864 |