

$379,900
Investment Summary
- Monthly Cash Flow
- -$1,236
- Cap Rate
- 2.2%
- Cash-on-Cash Return
- -17.0%
- Debt Coverage Ratio
- 0.36
- Internal Rate of Return (5 years)
- -12.4%
Cash Flow
Net Operating Income (NOI) minus mortgage payments.
Calculation:
NOI - Mortgage Payments
Cap Rate (Market Value)
Capitalization Rate is a rate of return that compares the yearly Net Operating Income (NOI) to the market value.
Calculation:
NOI / Market Value
Cash-on-Cash Return (CoC)
Annual Cash Flow / Cash Invested
Calculation:
Annual cash flow divided by initial cash invested.
Debt Coverage Ratio (DCR)
Net Operating Income (NOI) divided by total debt payments.
Calculation:
NOI / Total Debt Payments
Internal Rate of Return (IRR)
A metric for assessing profitability over time. IRR is the discount rate at which the net present value (NPV) of all future cash flows (positive and negative) from an investment equals zero — including both periodic cash flow (such as rent) and a projected sale at the end of the holding period. It represents the expected annualized return, accounting for income, expenses, and the recovery of capital through a future sale.
Property Description
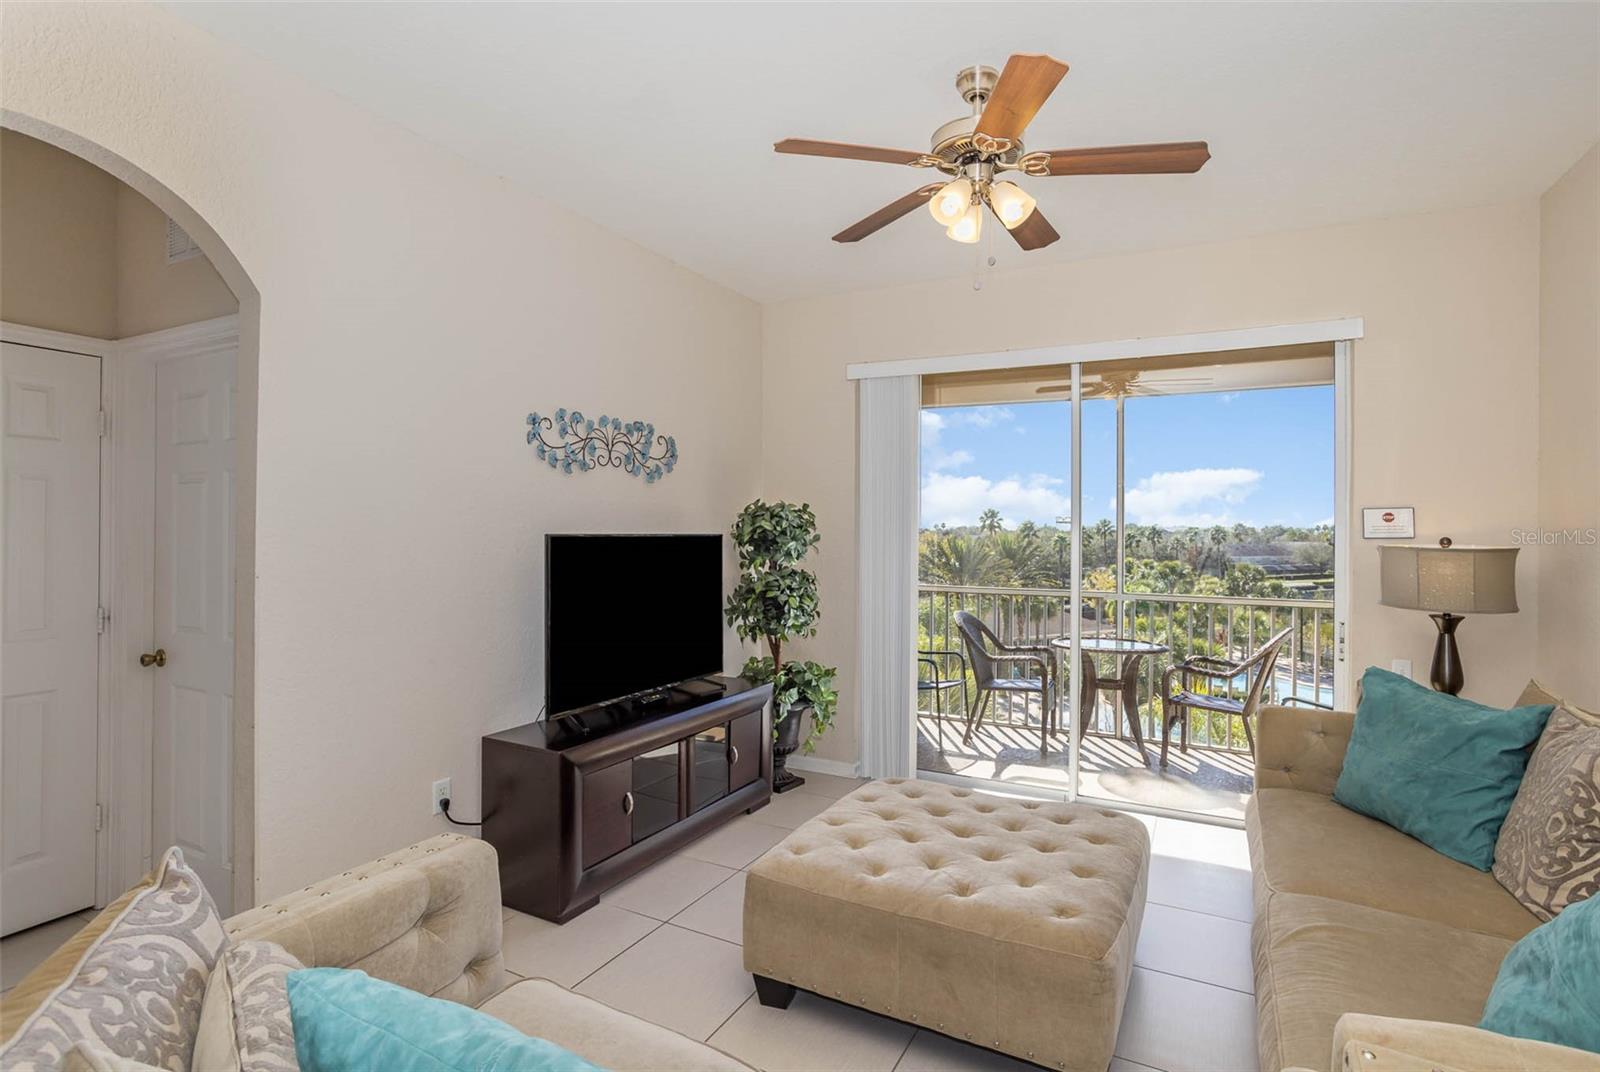
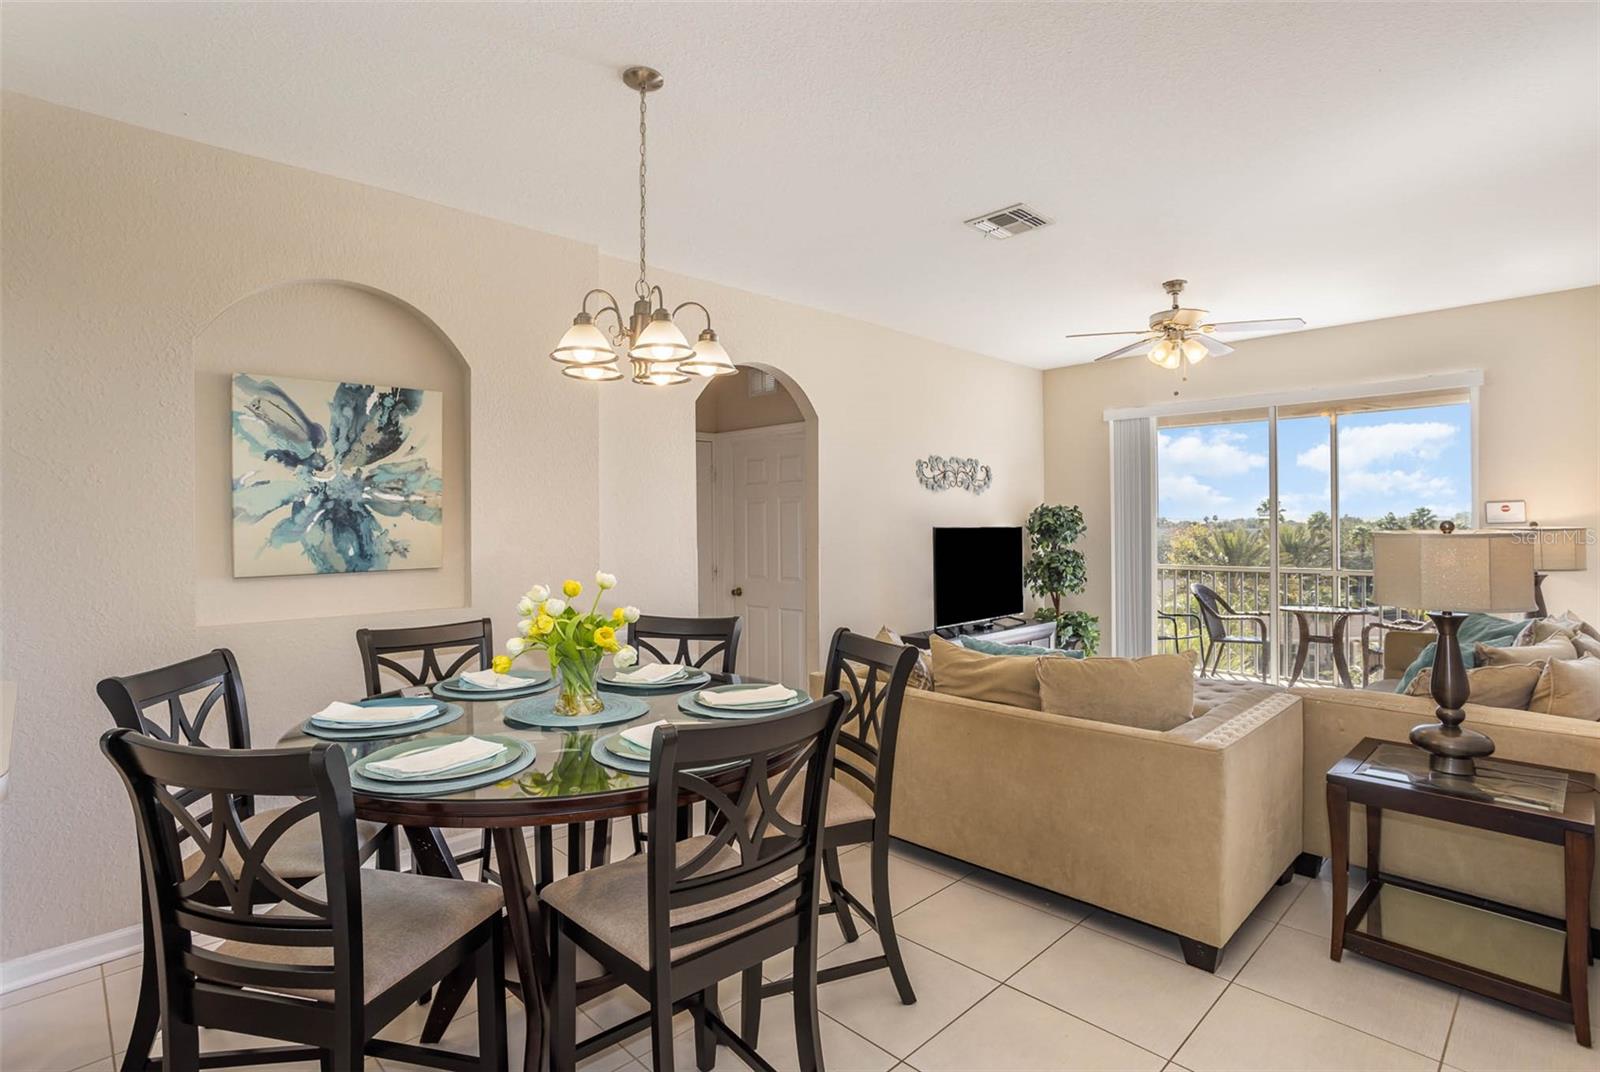
In all of Windsor Hills, there is only one corner, penthouse condominium that overlooks the pool and clubhouse... This is the one! This crown jewel delivers the kind of views and lifestyle most people only dream about. Perched on the top floor, this rare 3-bed, 2-bath gives you front-row seats to the best sights in the resort. Step inside, the open layout makes the whole space feel fresh and inviting. The kitchen is fully equipped, ready for anything from quick breakfasts to family feasts. The living room is all about comfort, with a plush sofa, oversized ottoman, and a 55” HD TV that’s just begging for movie marathons after a day at the parks. Picture starting the day with coffee on the oversized balcony, watching hot air balloons drift across the morning sky. As the sun sets, let the shimmering pool lights and peaceful lake views become your nightly backdrop. Every bedroom brings its own sense of magic and relaxation. The master suite is your personal retreat, featuring a king bed, a spa-inspired shower, and those same jaw-dropping views. Kids get a room that’s pure Disney fun, decked out in Mickey decor. And the princess suite? Chandelier, canopy bed, the works—it’s a total fairy tale. With 1,246 square feet and a smart split floor plan for privacy, this turn-key condo works as a dreamy primary home, an epic vacation escape, or a high-earning rental property. Most recent updates include: New HVAC - Jan 2023; Water Heater - Jan 2022; New Toilets - Sept 2023; New Washer & Dryer - Jul 2020; Garbage Disposal - July 2023; New Fridge - Nov 2021; Ring Doorbell - Oct 2022 and smoke detectors - 2022. Existing bookings and property management can transfer seamlessly to you, so you can start enjoying—or profiting from—your new place right away. This is more than just a condo. It’s your chance to own the best unit in Windsor Hills, where every morning feels like a getaway and every evening feels like a reward. Windsor Hills is one of Orlando’s most sought-after gated communities—just two miles from Disney World and close to Universal, SeaWorld, world-class shopping, and endless dining options. The resort amenities are unbeatable: a massive heated pool with waterslides, splash zone, hot tub, movie theater, fitness center, sports courts, putting green, playgrounds, and round-the-clock security. It’s a vacation every single day. What sets this property apart? The unbeatable location. You’re just minutes from Disney, Universal, SeaWorld, and everything Orlando has to offer. Windsor Hills is loaded with amenities: a giant water park, three-story slides, interactive splash zone, zero-entry pool, fitness center, movie theater, arcade, tennis courts, and secure 24-hour gated entry. Opportunities like this don’t come around often. If you want a slice of paradise in one of Orlando’s top resort communities, now’s your chance. Schedule your showing today and take the first step toward living the Florida lifestyle you’ve been dreaming about. All information contained herein along with measurements, room sizes, and HOA information should be verified by the buyer or their agent.
Build Your Team
Quickly find investor-friendly professionals who can help you succeed in real estate investing at any stage of the investing journey.


Agents
Match with investor-friendly agents who can help you find, analyze, and close your next deal


Lenders
Get the best funding…find investor-friendly lenders who specialize in your deal strategy


Property Managers
Transition to passive investing. Find a trusted property management partnership that lasts.


Tax Pros & Accountants
Taxes and financial reporting made easy—find experts to create tax savings strategies, file taxes, and more
Location
Property Details
Parking
- Description: None
- Details: Open
- Garage Spaces: 0
- Spaces Total: 0
Bedroom Information
- # of Bedrooms: 3
Bathroom Information
- # of Baths (Full): 2
- # of Baths (Total): 2.0
Interior Features
- # of Rooms: 7
- # of Stories: 4
Exterior Features
- Exterior Walls Materials: Concrete Block
- Foundation: Slab
- Roof Type: Gable or Hip
- Roof Material: Shingle
- Pool Community: Yes
HOA
- Has HOA: Yes
- Association: Artemis Lifestyles for Ventura
- Additional Association: Artemis Lifestyles for Master Association
- Additional HOA Fee: $1,117/quarterly
Land Information
- Land Use: Residential
- Land Use Subtype: Condominium Unit
Lot Information
- Parcel ID: 102527544800014030
- Lot Size: 0 sqft
Property Information
- Property Type: Condominium
- Year Built: 2005
Tax Information
- Annual Tax: $3,564
Utilities
- Water & Sewer: Public
- Heating: Central
- Cooling: Central Air
Location
- County: Osceola
Listing Details
Investment Summary
- Monthly Cash Flow
- -$1,236
- Cap Rate
- 2.2%
- Cash-on-Cash Return
- -17.0%
- Debt Coverage Ratio
- 0.36
- Internal Rate of Return (5 years)
- -12.4%
Cash Flow
Net Operating Income (NOI) minus mortgage payments.
Calculation:
NOI - Mortgage Payments
Cap Rate (Market Value)
Capitalization Rate is a rate of return that compares the yearly Net Operating Income (NOI) to the market value.
Calculation:
NOI / Market Value
Cash-on-Cash Return (CoC)
Annual Cash Flow / Cash Invested
Calculation:
Annual cash flow divided by initial cash invested.
Debt Coverage Ratio (DCR)
Net Operating Income (NOI) divided by total debt payments.
Calculation:
NOI / Total Debt Payments
Internal Rate of Return (IRR)
A metric for assessing profitability over time. IRR is the discount rate at which the net present value (NPV) of all future cash flows (positive and negative) from an investment equals zero — including both periodic cash flow (such as rent) and a projected sale at the end of the holding period. It represents the expected annualized return, accounting for income, expenses, and the recovery of capital through a future sale.
Purchase Details
Purchase PriceThe price paid for the property. Purchase price:
| $379,900 |
|---|---|
Amount FinancedThe amount of the purchase financed through a loan. Amount financed:
| -$303,920 |
Down paymentThe initial payment made towards the purchase. Down payment:
| $75,980 |
Closing CostsFees and expenses associated with purchasing a property, typically ranging from 2% to 5% of the home’s purchase price, paid at the end of a home purchase to cover services like lending, title transfer, and taxes. Closing costs:
| $11,397 |
Rehab CostsCosts incurred to repair or improve the property, including: roof, flooring, exterior siding, kitchen, exterior paint, bathrooms, etc. Rehab costs:
| $0 |
Initial Cash InvestedThe total initial cash invested in the property. Calculation:Down payment + Buying costs + Rehab costs Initial cash invested:
| $87,377 |
Square Feet (SQFT)The total square footage of the property. Square feet:
| 1,246 |
Cost Per Square FootCost per square foot of the property. Calculation:Purchase Price / Square Feet Cost per square foot:
| $305 |
Monthly Rent Per Square FootMonthly rent divided by the number of square feet. This ratio helps investors compare rental income efficiency across properties, markets, and unit sizes Calculation:Monthly Rent / Square Feet Monthly rent per square foot:
| $1.61 |
Financing Details
Loan AmountThe total sum of money borrowed from a lender to finance a property purchase. Calculation:Purchase Price - Down Payment
Loan amount:
| $303,920 |
|---|---|
Loan to Value Ratio (LTV)Loan amount divided by the market value of the property. Calculation:Loan Amount / Market Value
Loan to value ratio:
| 80.0% |
Loan TypeThe type of loan (e.g., fixed, adjustable).
Loan type:
| Amortizing |
TermThe loan repayment period in years.
Term:
| 30 years |
Interest RateThe percentage a lender charges on the borrowed amount of a loan, determining the cost of borrowing money.
Interest rate:
| 6.625% |
Principal & Interest (PI)The principal is the portion of the loan payment that reduces the loan balance. The interest is the lender's charge for borrowing money. Calculation:(P * r * (1 + r) ** n) / ((1 + r) ** n - 1) Where:
P = Loan amount (principal)
Principal & interest:
| $1,946 |
Property TaxesAnnual taxes levied by local governments on real estate properties. These taxes fund public services like schools, roads, and emergency services.
Property tax:
| $297 |
InsuranceThe costs for insurance coverage to protect against financial losses due to risks like fire, natural disasters, theft, liability, or tenant-related damages. Calculation:Assumes 7% of gross rental income, unless insurance rates are specified.
Insurance:
| $140 |
Private Mortgage Insurance (PMI)A fee that borrowers pay when they take out a conventional loan with a loan-to-value (LTV) ratio above 80%.
Private mortgage insurance (PMI):
| $0 |
Monthly PaymentThe fixed amount a borrower pays each month to repay a loan. It typically includes principal and interest (P&I) and may also cover property taxes, insurance, HOA fees, and PMI if escrowed. Monthly payment:
| $2,383 |
Operating Income
| % Rent | Monthly | Yearly | |
|---|---|---|---|
Gross RentThe total rental income received from tenants before deducting any expenses. Includes base rent, late fees, pet fees, parking fees, and other recurring charges.
Gross rent:
| $2,000 | $24,000 | |
Vacancy LossExpected loss of rent due to vacancies.
Vacancy loss:
(6%)
| 6% | -$120 | -$1,440 |
Operating IncomeGross rental income minus vacancy loss. Calculation:Gross rent - Vacancy loss
Operating income:
| $1,880 | $22,560 |
Operating Expenses
| % Rent | Monthly | Yearly | |
|---|---|---|---|
Property TaxesAnnual taxes levied by local governments on real estate properties. These taxes fund public services like schools, roads, and emergency services. | 15% | -$297 | -$3,565 |
InsuranceThe costs for insurance coverage to protect against financial losses due to risks like fire, natural disasters, theft, liability, or tenant-related damages. Calculation:Assumes 7% of gross rental income, unless insurance rates are specified. | 7% | -$140 | -$1,680 |
Property ManagementThe costs associated with hiring a property manager to handle the day-to-day operations of a rental property. Includes management fees, leasing fes, eviction fees, etc. Calculation:Assumes 8% of gross rental income. | 8% | -$160 | -$1,920 |
Repairs & MaintenanceOngoing costs for routine upkeep and minor fixes needed to keep a property in good working condition. Calculation:Assumes 5% of gross rental income. Varies by property age and condition. | 5% | -$100 | -$1,200 |
Capital ExpensesLarge, infrequent costs for major improvements or replacements, like a new roof, HVAC system, or appliances. Calculation:Assumes 5% of gross rental income. Varies by property age. | 5% | -$100 | -$1,200 |
HOA FeesRegular dues paid to a Homeowners Association for community maintenance, amenities, and management. Similar fees include: Condo Association Fees, Co-op Maintenance Fees, etc. | 19% | -$373 | -$4,476 |
Operating ExpensesRecurring costs required to maintain and manage a rental property, including property taxes, insurance, maintenance, repairs, utilities (if paid by the owner), property management fees, and other day-to-day expenses. Calculation:Insurance + Property Taxes + Property Management + Repairs & Maintenance + Capital Expenditures + HOA Fees | 59% | -$1,170 | -$14,041 |
Cash Flow
| Monthly | Yearly | |
|---|---|---|
Net Operating Income (NOI)The income generated from a property after deducting all operating expenses but before deducting mortgage payments, taxes, and capital expenditures. Calculation:Gross Operating Income - Operating Expenses
Net operating income:
| $710 | $8,520 |
Mortgage PaymentThe fixed amount a borrower pays each month to repay a loan. It typically includes principal and interest (P&I) and may also cover property taxes, insurance, HOA fees, and PMI if escrowed. | -$1,946 | -$23,352 |
Cash FlowNet Operating Income (NOI) minus mortgage payments. Calculation:NOI - Mortgage Payments | $1,236 | $14,832 |