
$615,000
Investment Summary
- Monthly Cash Flow
- -$1,114
- Cap Rate
- 4.0%
- Cash-on-Cash Return
- -9.5%
- Debt Coverage Ratio
- 0.65
- Internal Rate of Return (5 years)
- -5.2%
Cash Flow
Net Operating Income (NOI) minus mortgage payments.
Calculation:
NOI - Mortgage Payments
Cap Rate (Market Value)
Capitalization Rate is a rate of return that compares the yearly Net Operating Income (NOI) to the market value.
Calculation:
NOI / Market Value
Cash-on-Cash Return (CoC)
Annual Cash Flow / Cash Invested
Calculation:
Annual cash flow divided by initial cash invested.
Debt Coverage Ratio (DCR)
Net Operating Income (NOI) divided by total debt payments.
Calculation:
NOI / Total Debt Payments
Internal Rate of Return (IRR)
A metric for assessing profitability over time. IRR is the discount rate at which the net present value (NPV) of all future cash flows (positive and negative) from an investment equals zero — including both periodic cash flow (such as rent) and a projected sale at the end of the holding period. It represents the expected annualized return, accounting for income, expenses, and the recovery of capital through a future sale.
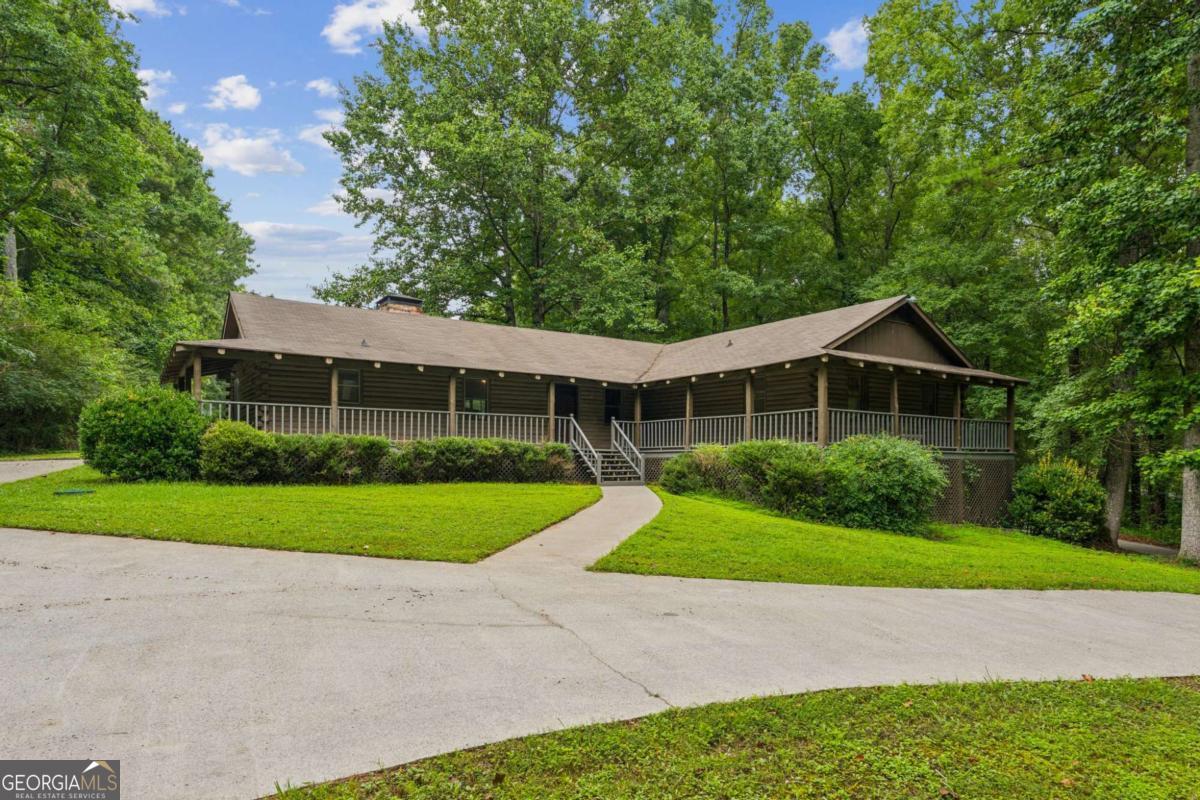
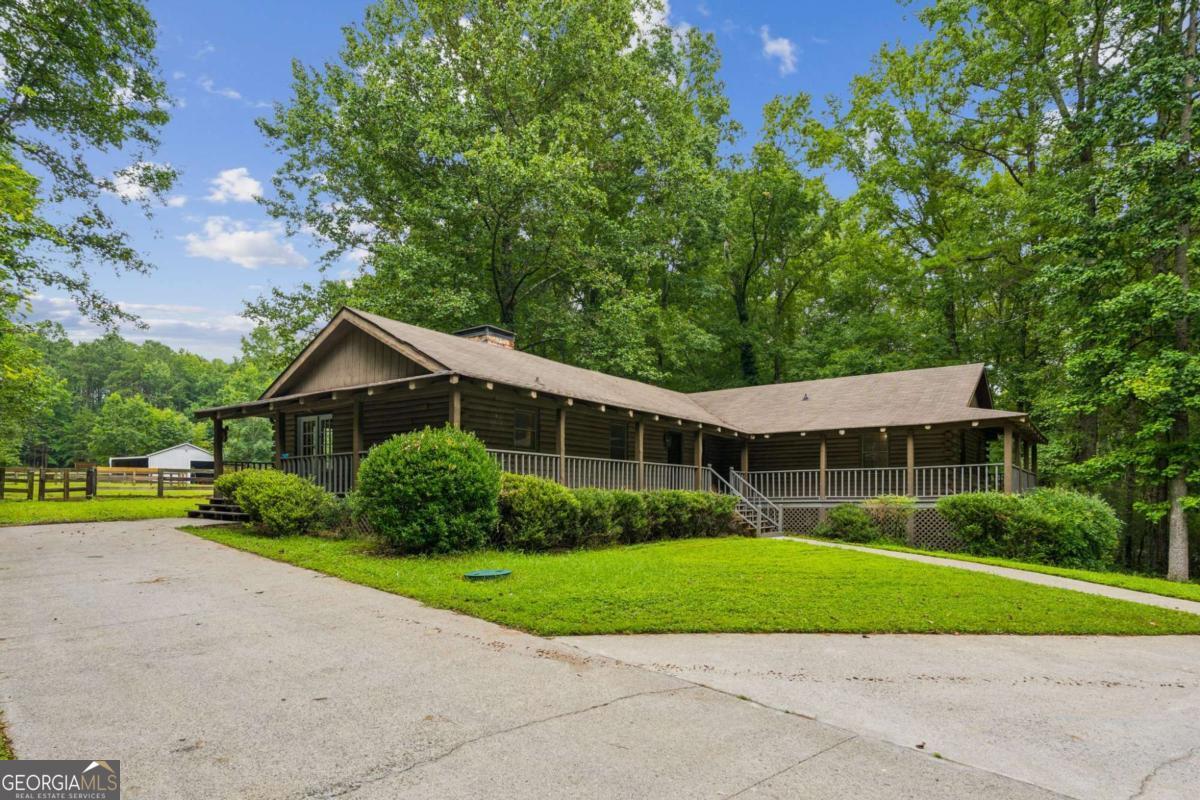
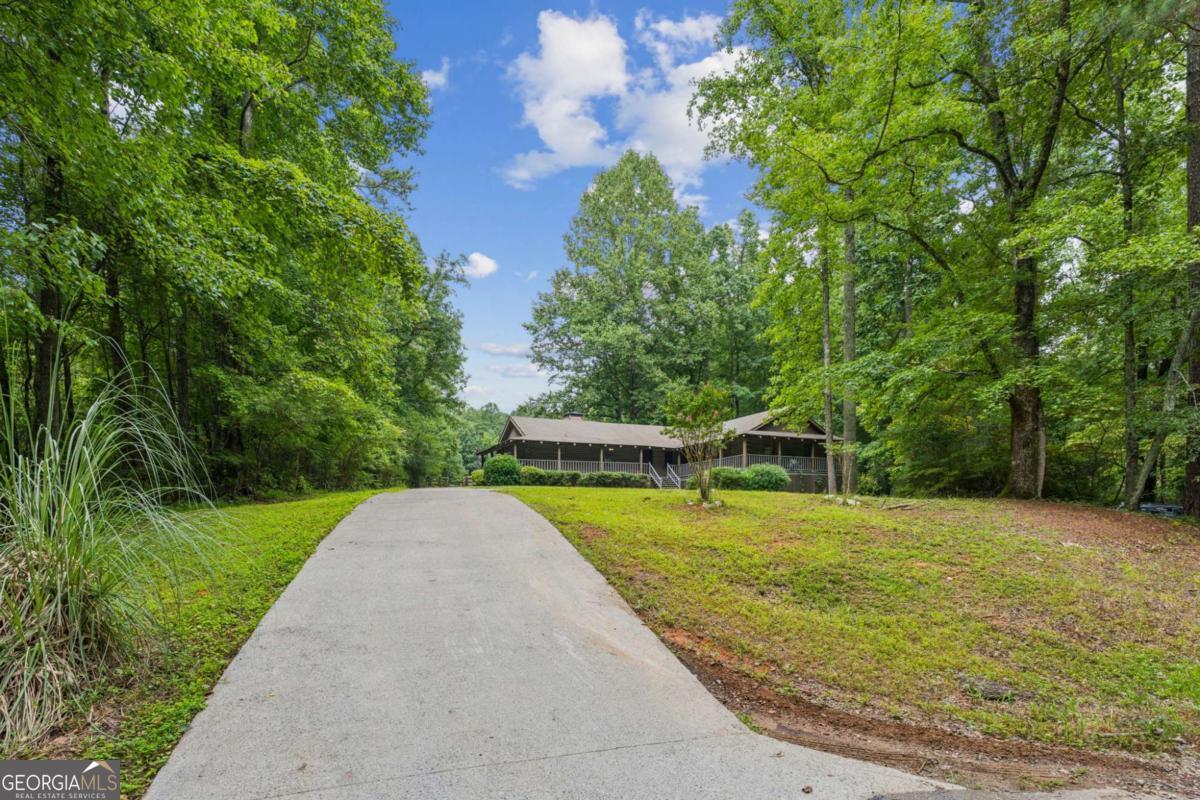
Property Description
Located in the Macedonia area of Cherokee County, between GA 20 and East Cherokee Drive, 769 Cotton Road is the small horse farm of your dreams! Situated on an elevated 3-acre lot, the 2,230 sq. ft. traditional ranch-style log cabin has three bedrooms and two full bathrooms, one with an 1912 claw-foot tub. The kitchen is spacious with custom-built cabinetry, a kitchen island and room for a dining table, and the generous, cosy lounge area with stone fireplace has a view to the pastures. A partial wrap-around porch adds to the rustic charm of the cabin. The entire roof replaced in 2013 and a new HVAC installed in 2018. The 2-car garage under the house has ample storage space, with a full unfinished basement offering great potential for expanding the living space, creating a workshop or customizing to suit your specific needs. The fenced, pet-friendly garden area with deck overlooking the pastures, lies behind the house with access from the lounge. The horseshoe-style driveway ensures efficient traffic flow, increased convenience and safety for cars and trailers, additional parking space and easy access to the pastures. Large flowering bushes enhance the front of the property. The barn (2,300 sq.ft) is nestled in secluded, private pastures behind the cabin, with central aisle, three 12' x 11' stables and a tack/feed room, and equipped with electricity and water. On one side of the barn is a run-in shelter from the back pasture and an additional covered area, and on the other side is covered storage for farm equipment with access to the pastures. There is also a single round-bale cover. The 3 acres include sub-divided pastures for other animals, a fenced round/lunging pen and a sand riding arena. Fencing is a mix of three-board and block fencing. Within the pastures that run from creek to creek on either side, are a variety of hardwood and pine trees with trail paths cut through the wooded areas. Dawn to dusk lighting is installed at the barn as well as at the front of the log cabin. Just imagine, no more paying for horse boarding when you can bring your horses home to live with you. Or create your own boutique boarding/training facility. The barn could be used as a hobby farm or be refurbished as a party barn. A great variety of shops and restaurants are nearby in Canton and the Hickory Flat area. GA-20 gives easy access to Cumming and Canton and I-575 to Atlanta and the North Georgia mountains. There are riding trails at Birmingham Park, Garland Mountain, and Dawson Forest, with plentiful resources nearby for all your equestrian needs. Don't miss this rare opportunity to buy in this location and in this price bracket! This classic log cabin property is your chance to purchase a slice of heaven with extraordinary potential to make your dream home for you and your animals. Round up the kids and their ponies or bring your trail horses or warmbloods to this cosy, private setting.
Build Your Team
Quickly find investor-friendly professionals who can help you succeed in real estate investing at any stage of the investing journey.


Agents
Match with investor-friendly agents who can help you find, analyze, and close your next deal


Lenders
Get the best funding…find investor-friendly lenders who specialize in your deal strategy


Property Managers
Transition to passive investing. Find a trusted property management partnership that lasts.


Tax Pros & Accountants
Taxes and financial reporting made easy—find experts to create tax savings strategies, file taxes, and more
Location
Property Details
Parking
- Details: Garage
- Garage Spaces: 2
- Spaces Total: 2
Bedroom Information
- # of Bedrooms: 3
Bathroom Information
- # of Baths (Full): 2
- # of Baths (Partial): 1
- # of Baths (Total): 2.0
Interior Features
- # of Stories: 1
- Basement: Yes
- Basement Description: Exterior Entry, Full, Unfinished
- Fireplace: Yes
Exterior Features
- Exterior Walls Materials: Wood Shingle
- Roof Type: Gable
- Roof Material: Composition
Land Information
- Land Use: Residential
- Land Use Subtype: Rural/Agricultural
Lot Information
- Parcel ID: 03N16003
- Lot Size: 0 sqft
Property Information
- Property Type: Single Family Residence
- Style: Country/Rustic
- Year Built: 1983
Tax Information
- Annual Tax: $1,239
Utilities
- Water & Sewer: Public
- Heating: Central, Forced Air
- Cooling: Ceiling Fan(s), Central Air
Location
- County: Cherokee
Listing Details
Investment Summary
- Monthly Cash Flow
- -$1,114
- Cap Rate
- 4.0%
- Cash-on-Cash Return
- -9.5%
- Debt Coverage Ratio
- 0.65
- Internal Rate of Return (5 years)
- -5.2%
Cash Flow
Net Operating Income (NOI) minus mortgage payments.
Calculation:
NOI - Mortgage Payments
Cap Rate (Market Value)
Capitalization Rate is a rate of return that compares the yearly Net Operating Income (NOI) to the market value.
Calculation:
NOI / Market Value
Cash-on-Cash Return (CoC)
Annual Cash Flow / Cash Invested
Calculation:
Annual cash flow divided by initial cash invested.
Debt Coverage Ratio (DCR)
Net Operating Income (NOI) divided by total debt payments.
Calculation:
NOI / Total Debt Payments
Internal Rate of Return (IRR)
A metric for assessing profitability over time. IRR is the discount rate at which the net present value (NPV) of all future cash flows (positive and negative) from an investment equals zero — including both periodic cash flow (such as rent) and a projected sale at the end of the holding period. It represents the expected annualized return, accounting for income, expenses, and the recovery of capital through a future sale.
Purchase Details
Purchase PriceThe price paid for the property. Purchase price:
| $615,000 |
|---|---|
Amount FinancedThe amount of the purchase financed through a loan. Amount financed:
| -$492,000 |
Down paymentThe initial payment made towards the purchase. Down payment:
| $123,000 |
Closing CostsFees and expenses associated with purchasing a property, typically ranging from 2% to 5% of the home’s purchase price, paid at the end of a home purchase to cover services like lending, title transfer, and taxes. Closing costs:
| $18,450 |
Rehab CostsCosts incurred to repair or improve the property, including: roof, flooring, exterior siding, kitchen, exterior paint, bathrooms, etc. Rehab costs:
| $0 |
Initial Cash InvestedThe total initial cash invested in the property. Calculation:Down payment + Buying costs + Rehab costs Initial cash invested:
| $141,450 |
Square Feet (SQFT)The total square footage of the property. Square feet:
| 2,230 |
Cost Per Square FootCost per square foot of the property. Calculation:Purchase Price / Square Feet Cost per square foot:
| $276 |
Monthly Rent Per Square FootMonthly rent divided by the number of square feet. This ratio helps investors compare rental income efficiency across properties, markets, and unit sizes Calculation:Monthly Rent / Square Feet Monthly rent per square foot:
| $1.39 |
Financing Details
Loan AmountThe total sum of money borrowed from a lender to finance a property purchase. Calculation:Purchase Price - Down Payment
Loan amount:
| $492,000 |
|---|---|
Loan to Value Ratio (LTV)Loan amount divided by the market value of the property. Calculation:Loan Amount / Market Value
Loan to value ratio:
| 80.0% |
Loan TypeThe type of loan (e.g., fixed, adjustable).
Loan type:
| Amortizing |
TermThe loan repayment period in years.
Term:
| 30 years |
Interest RateThe percentage a lender charges on the borrowed amount of a loan, determining the cost of borrowing money.
Interest rate:
| 6.625% |
Principal & Interest (PI)The principal is the portion of the loan payment that reduces the loan balance. The interest is the lender's charge for borrowing money. Calculation:(P * r * (1 + r) ** n) / ((1 + r) ** n - 1) Where:
P = Loan amount (principal)
Principal & interest:
| $3,150 |
Property TaxesAnnual taxes levied by local governments on real estate properties. These taxes fund public services like schools, roads, and emergency services.
Property tax:
| $103 |
InsuranceThe costs for insurance coverage to protect against financial losses due to risks like fire, natural disasters, theft, liability, or tenant-related damages. Calculation:Assumes 7% of gross rental income, unless insurance rates are specified.
Insurance:
| $217 |
Private Mortgage Insurance (PMI)A fee that borrowers pay when they take out a conventional loan with a loan-to-value (LTV) ratio above 80%.
Private mortgage insurance (PMI):
| $0 |
Monthly PaymentThe fixed amount a borrower pays each month to repay a loan. It typically includes principal and interest (P&I) and may also cover property taxes, insurance, HOA fees, and PMI if escrowed. Monthly payment:
| $3,470 |
Operating Income
| % Rent | Monthly | Yearly | |
|---|---|---|---|
Gross RentThe total rental income received from tenants before deducting any expenses. Includes base rent, late fees, pet fees, parking fees, and other recurring charges.
Gross rent:
| $3,100 | $37,200 | |
Vacancy LossExpected loss of rent due to vacancies.
Vacancy loss:
(6%)
| 6% | -$186 | -$2,232 |
Operating IncomeGross rental income minus vacancy loss. Calculation:Gross rent - Vacancy loss
Operating income:
| $2,914 | $34,968 |
Operating Expenses
| % Rent | Monthly | Yearly | |
|---|---|---|---|
Property TaxesAnnual taxes levied by local governments on real estate properties. These taxes fund public services like schools, roads, and emergency services. | 3% | -$103 | -$1,239 |
InsuranceThe costs for insurance coverage to protect against financial losses due to risks like fire, natural disasters, theft, liability, or tenant-related damages. Calculation:Assumes 7% of gross rental income, unless insurance rates are specified. | 7% | -$217 | -$2,604 |
Property ManagementThe costs associated with hiring a property manager to handle the day-to-day operations of a rental property. Includes management fees, leasing fes, eviction fees, etc. Calculation:Assumes 8% of gross rental income. | 8% | -$248 | -$2,976 |
Repairs & MaintenanceOngoing costs for routine upkeep and minor fixes needed to keep a property in good working condition. Calculation:Assumes 5% of gross rental income. Varies by property age and condition. | 5% | -$155 | -$1,860 |
Capital ExpensesLarge, infrequent costs for major improvements or replacements, like a new roof, HVAC system, or appliances. Calculation:Assumes 5% of gross rental income. Varies by property age. | 5% | -$155 | -$1,860 |
HOA FeesRegular dues paid to a Homeowners Association for community maintenance, amenities, and management. Similar fees include: Condo Association Fees, Co-op Maintenance Fees, etc. | n/a | n/a | n/a |
Operating ExpensesRecurring costs required to maintain and manage a rental property, including property taxes, insurance, maintenance, repairs, utilities (if paid by the owner), property management fees, and other day-to-day expenses. Calculation:Insurance + Property Taxes + Property Management + Repairs & Maintenance + Capital Expenditures + HOA Fees | 28% | -$878 | -$10,539 |
Cash Flow
| Monthly | Yearly | |
|---|---|---|
Net Operating Income (NOI)The income generated from a property after deducting all operating expenses but before deducting mortgage payments, taxes, and capital expenditures. Calculation:Gross Operating Income - Operating Expenses
Net operating income:
| $2,036 | $24,432 |
Mortgage PaymentThe fixed amount a borrower pays each month to repay a loan. It typically includes principal and interest (P&I) and may also cover property taxes, insurance, HOA fees, and PMI if escrowed. | -$3,150 | -$37,800 |
Cash FlowNet Operating Income (NOI) minus mortgage payments. Calculation:NOI - Mortgage Payments | $1,114 | $13,368 |