

$799,000
Investment Summary
- Monthly Cash Flow
- -$3,117
- Cap Rate
- 1.6%
- Cash-on-Cash Return
- -20.4%
- Debt Coverage Ratio
- 0.25
- Internal Rate of Return (5 years)
- -15.7%
Cash Flow
Net Operating Income (NOI) minus mortgage payments.
Calculation:
NOI - Mortgage Payments
Cap Rate (Market Value)
Capitalization Rate is a rate of return that compares the yearly Net Operating Income (NOI) to the market value.
Calculation:
NOI / Market Value
Cash-on-Cash Return (CoC)
Annual Cash Flow / Cash Invested
Calculation:
Annual cash flow divided by initial cash invested.
Debt Coverage Ratio (DCR)
Net Operating Income (NOI) divided by total debt payments.
Calculation:
NOI / Total Debt Payments
Internal Rate of Return (IRR)
A metric for assessing profitability over time. IRR is the discount rate at which the net present value (NPV) of all future cash flows (positive and negative) from an investment equals zero — including both periodic cash flow (such as rent) and a projected sale at the end of the holding period. It represents the expected annualized return, accounting for income, expenses, and the recovery of capital through a future sale.
Property Description
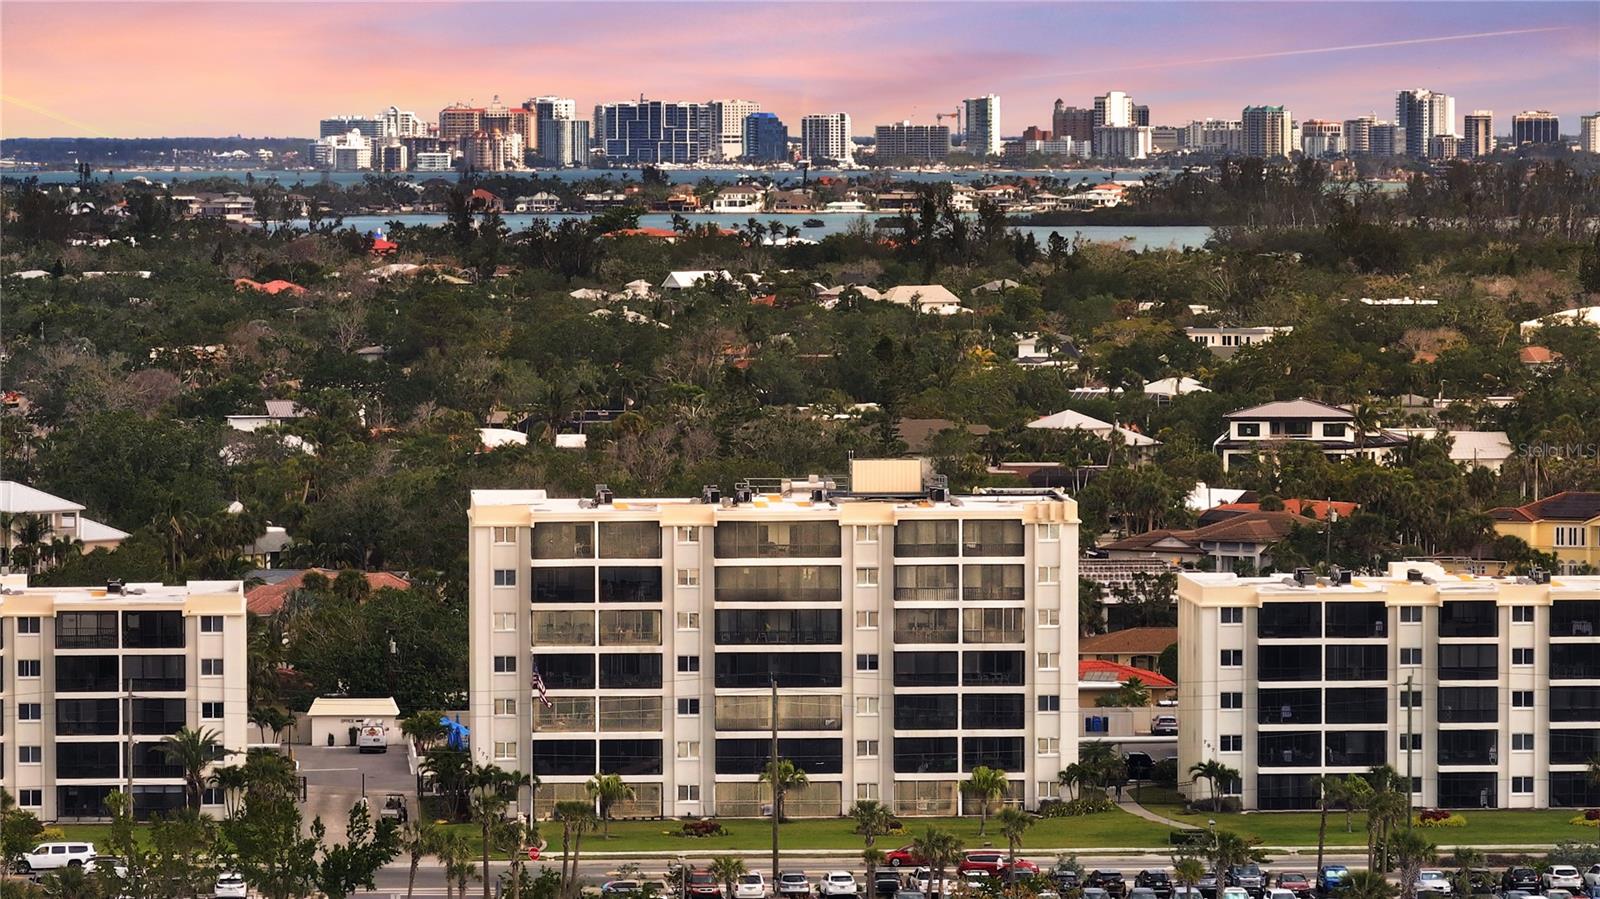
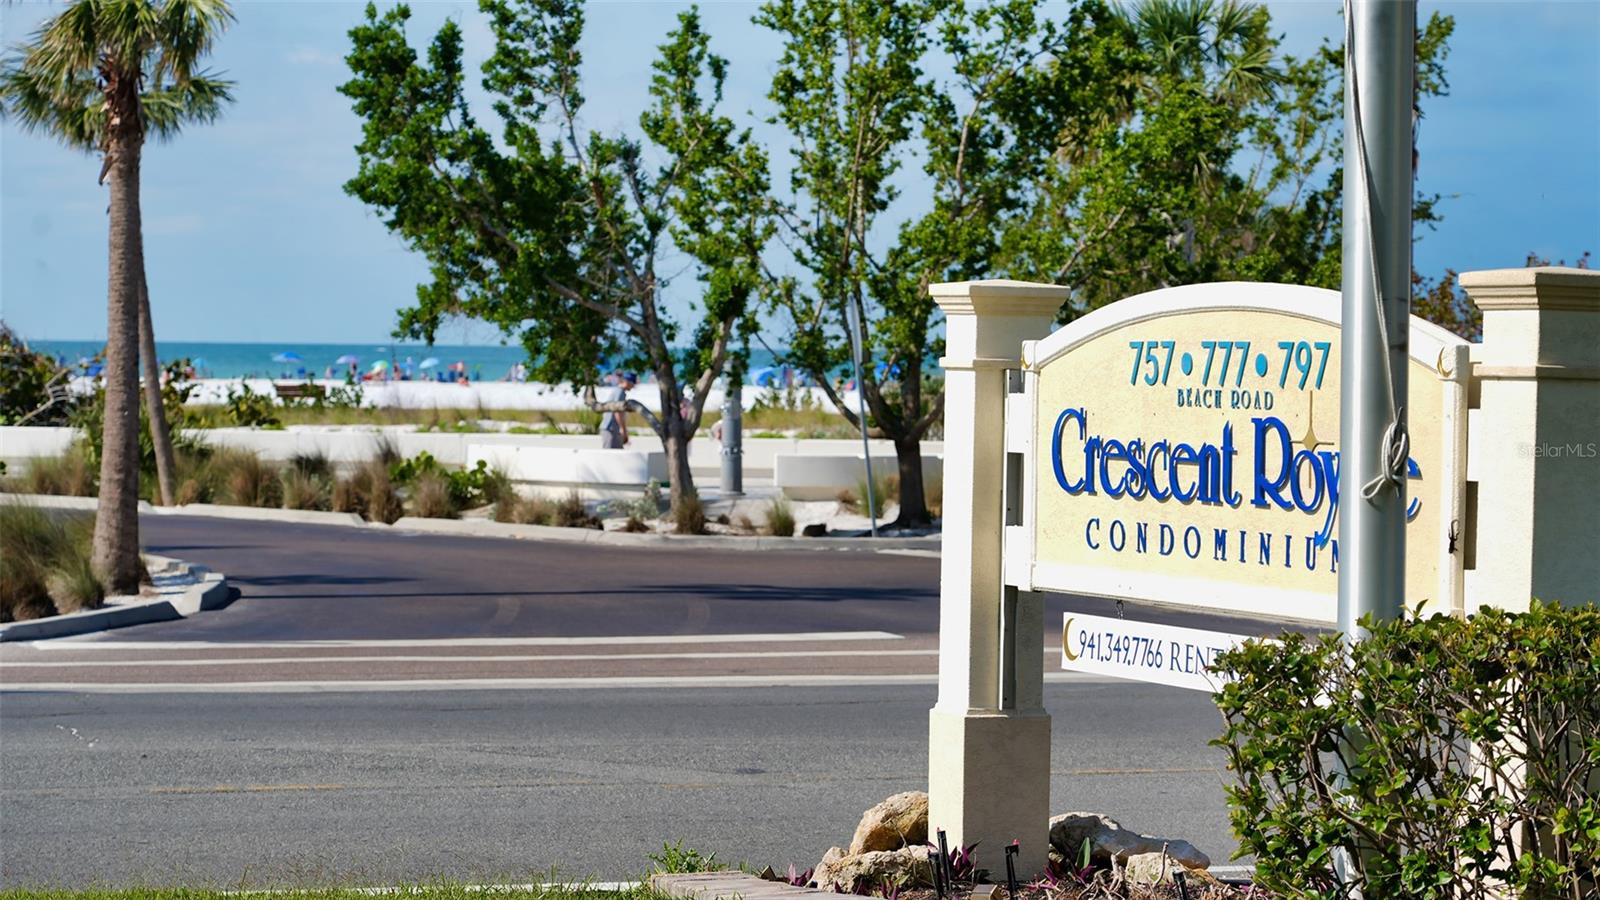
Are you ready to experience the epitome of beachside living? Imagine waking up to the soft sound of waves and the scent of salt air. This is life in Siesta Key Beach. This fully furnished two-bedroom, two-bath condominium is positioned in the sought-after community of Crescent Royale directly across from Siesta Key’s world-renowned powdery sand beaches. Designed for those who value luxury and laid-back coastal elegance combined with smart investment potential, this prime, first-floor, turnkey condominium offers the ideal combination of luxury, convenience and relaxation. There is no need to take the stairs or search for beach parking when you live steps from the beach with an assigned parking space. Wake to panoramic views of turquoise water and unwind on your private lanai with stunning gulf sunsets. Inside, you’ll be greeted by bright, light-filled spaces with floor-to-ceiling sliders that invite in ocean breezes. The tastefully renovated home has newly installed white oak (LVP) floors throughout. A stylish kitchen complete with granite countertops, newer appliances, and a breakfast/wine bar that flows into the dining and living area creates a space for hosting with ease. Each bedroom is a serene retreat complete with a walk-in closet and a sophisticated en-suite bath, ideal for guests and owners alike. Crescent Royale pampers their residents and guests with resort-style amenities including a sparkling heated pool, fully equipped fitness center, game room, shuffleboard court, and a picnic/barbecue area. Just minutes away, Sarasota adds a cultural heartbeat with art galleries, theaters and gourmet dining. The pace here is relaxed but vibrant! Farmer’s markets, waterfront cafes and year-round sunshine create the ideal blend of sophisticated living and coastal charm. Living near Siesta Key and Sarasota means every day feels like a vacation, and every moment feels like home. Whether you're looking for a personal retreat, a seasonal escape or an income-generating asset, this property delivers because it works while you relax. Beyond its beauty, this residence is a savvy investment, offering strong rental income potential, friendly leasing policies and on-site management, creating a rare opportunity for a passive income stream in one of Florida’s most desirable beach communities. No pets or smoking allowed in this community! Location, luxury and income potential! Live the dream, earn while you’re away and invest in a lifestyle that pays you back. This condominium delivers the lifestyle you’ve been dreaming of, just across from Siesta Key Beach so don’t miss this rare chance to own a slice of Siesta Key’s desirable beachfront real estate, with income potential to match. Call us today to schedule your private showing and begin living the Florida Lifestyle you have dreamed of.
Build Your Team
Quickly find investor-friendly professionals who can help you succeed in real estate investing at any stage of the investing journey.


Agents
Match with investor-friendly agents who can help you find, analyze, and close your next deal


Lenders
Get the best funding…find investor-friendly lenders who specialize in your deal strategy


Property Managers
Transition to passive investing. Find a trusted property management partnership that lasts.


Tax Pros & Accountants
Taxes and financial reporting made easy—find experts to create tax savings strategies, file taxes, and more
Location
Property Details
Parking
- Description: Carport
- Garage Spaces: 0
- Spaces Total: 0
Bedroom Information
- # of Bedrooms: 2
Bathroom Information
- # of Baths (Full): 2
- # of Baths (Total): 2.0
Interior Features
- # of Rooms: 5
- # of Stories: 1
Exterior Features
- Exterior Walls Materials: Stucco
- Foundation: Slab
- Roof Type: Flat
- Roof Material: Other
HOA
- Has HOA: Yes
- Association: Jill Kobe
- HOA Fee: $3,293/quarterly
Land Information
- Land Use: Residential
- Land Use Subtype: Condominium Unit
Lot Information
- Parcel ID: 0107024008
- Lot Size: 27624 sqft
Property Information
- Property Type: Condominium
- Style: Florida
- Year Built: 1970
Tax Information
- Annual Tax: $8,124
Utilities
- Water & Sewer: Public
- Heating: Central
- Cooling: Central Air
Location
- County: Sarasota
Listing Details
Investment Summary
- Monthly Cash Flow
- -$3,117
- Cap Rate
- 1.6%
- Cash-on-Cash Return
- -20.4%
- Debt Coverage Ratio
- 0.25
- Internal Rate of Return (5 years)
- -15.7%
Cash Flow
Net Operating Income (NOI) minus mortgage payments.
Calculation:
NOI - Mortgage Payments
Cap Rate (Market Value)
Capitalization Rate is a rate of return that compares the yearly Net Operating Income (NOI) to the market value.
Calculation:
NOI / Market Value
Cash-on-Cash Return (CoC)
Annual Cash Flow / Cash Invested
Calculation:
Annual cash flow divided by initial cash invested.
Debt Coverage Ratio (DCR)
Net Operating Income (NOI) divided by total debt payments.
Calculation:
NOI / Total Debt Payments
Internal Rate of Return (IRR)
A metric for assessing profitability over time. IRR is the discount rate at which the net present value (NPV) of all future cash flows (positive and negative) from an investment equals zero — including both periodic cash flow (such as rent) and a projected sale at the end of the holding period. It represents the expected annualized return, accounting for income, expenses, and the recovery of capital through a future sale.
Purchase Details
Purchase PriceThe price paid for the property. Purchase price:
| $799,000 |
|---|---|
Amount FinancedThe amount of the purchase financed through a loan. Amount financed:
| -$639,200 |
Down paymentThe initial payment made towards the purchase. Down payment:
| $159,800 |
Closing CostsFees and expenses associated with purchasing a property, typically ranging from 2% to 5% of the home’s purchase price, paid at the end of a home purchase to cover services like lending, title transfer, and taxes. Closing costs:
| $23,970 |
Rehab CostsCosts incurred to repair or improve the property, including: roof, flooring, exterior siding, kitchen, exterior paint, bathrooms, etc. Rehab costs:
| $0 |
Initial Cash InvestedThe total initial cash invested in the property. Calculation:Down payment + Buying costs + Rehab costs Initial cash invested:
| $183,770 |
Square Feet (SQFT)The total square footage of the property. Square feet:
| 1,174 |
Cost Per Square FootCost per square foot of the property. Calculation:Purchase Price / Square Feet Cost per square foot:
| $681 |
Monthly Rent Per Square FootMonthly rent divided by the number of square feet. This ratio helps investors compare rental income efficiency across properties, markets, and unit sizes Calculation:Monthly Rent / Square Feet Monthly rent per square foot:
| $3.49 |
Financing Details
Loan AmountThe total sum of money borrowed from a lender to finance a property purchase. Calculation:Purchase Price - Down Payment
Loan amount:
| $639,200 |
|---|---|
Loan to Value Ratio (LTV)Loan amount divided by the market value of the property. Calculation:Loan Amount / Market Value
Loan to value ratio:
| 80.0% |
Loan TypeThe type of loan (e.g., fixed, adjustable).
Loan type:
| Amortizing |
TermThe loan repayment period in years.
Term:
| 30 years |
Interest RateThe percentage a lender charges on the borrowed amount of a loan, determining the cost of borrowing money.
Interest rate:
| 6.810% |
Principal & Interest (PI)The principal is the portion of the loan payment that reduces the loan balance. The interest is the lender's charge for borrowing money. Calculation:(P * r * (1 + r) ** n) / ((1 + r) ** n - 1) Where:
P = Loan amount (principal)
Principal & interest:
| $4,171 |
Property TaxesAnnual taxes levied by local governments on real estate properties. These taxes fund public services like schools, roads, and emergency services.
Property tax:
| $677 |
InsuranceThe costs for insurance coverage to protect against financial losses due to risks like fire, natural disasters, theft, liability, or tenant-related damages. Calculation:Assumes 7% of gross rental income, unless insurance rates are specified.
Insurance:
| $287 |
Private Mortgage Insurance (PMI)A fee that borrowers pay when they take out a conventional loan with a loan-to-value (LTV) ratio above 80%.
Private mortgage insurance (PMI):
| $0 |
Monthly PaymentThe fixed amount a borrower pays each month to repay a loan. It typically includes principal and interest (P&I) and may also cover property taxes, insurance, HOA fees, and PMI if escrowed. Monthly payment:
| $5,135 |
Operating Income
| % Rent | Monthly | Yearly | |
|---|---|---|---|
Gross RentThe total rental income received from tenants before deducting any expenses. Includes base rent, late fees, pet fees, parking fees, and other recurring charges.
Gross rent:
| $4,100 | $49,200 | |
Vacancy LossExpected loss of rent due to vacancies.
Vacancy loss:
(6%)
| 6% | -$246 | -$2,952 |
Operating IncomeGross rental income minus vacancy loss. Calculation:Gross rent - Vacancy loss
Operating income:
| $3,854 | $46,248 |
Operating Expenses
| % Rent | Monthly | Yearly | |
|---|---|---|---|
Property TaxesAnnual taxes levied by local governments on real estate properties. These taxes fund public services like schools, roads, and emergency services. | 17% | -$677 | -$8,125 |
InsuranceThe costs for insurance coverage to protect against financial losses due to risks like fire, natural disasters, theft, liability, or tenant-related damages. Calculation:Assumes 7% of gross rental income, unless insurance rates are specified. | 7% | -$287 | -$3,444 |
Property ManagementThe costs associated with hiring a property manager to handle the day-to-day operations of a rental property. Includes management fees, leasing fes, eviction fees, etc. Calculation:Assumes 8% of gross rental income. | 8% | -$328 | -$3,936 |
Repairs & MaintenanceOngoing costs for routine upkeep and minor fixes needed to keep a property in good working condition. Calculation:Assumes 5% of gross rental income. Varies by property age and condition. | 5% | -$205 | -$2,460 |
Capital ExpensesLarge, infrequent costs for major improvements or replacements, like a new roof, HVAC system, or appliances. Calculation:Assumes 5% of gross rental income. Varies by property age. | 5% | -$205 | -$2,460 |
HOA FeesRegular dues paid to a Homeowners Association for community maintenance, amenities, and management. Similar fees include: Condo Association Fees, Co-op Maintenance Fees, etc. | 27% | -$1,098 | -$13,176 |
Operating ExpensesRecurring costs required to maintain and manage a rental property, including property taxes, insurance, maintenance, repairs, utilities (if paid by the owner), property management fees, and other day-to-day expenses. Calculation:Insurance + Property Taxes + Property Management + Repairs & Maintenance + Capital Expenditures + HOA Fees | 68% | -$2,800 | -$33,601 |
Cash Flow
| Monthly | Yearly | |
|---|---|---|
Net Operating Income (NOI)The income generated from a property after deducting all operating expenses but before deducting mortgage payments, taxes, and capital expenditures. Calculation:Gross Operating Income - Operating Expenses
Net operating income:
| $1,054 | $12,648 |
Mortgage PaymentThe fixed amount a borrower pays each month to repay a loan. It typically includes principal and interest (P&I) and may also cover property taxes, insurance, HOA fees, and PMI if escrowed. | -$4,171 | -$50,052 |
Cash FlowNet Operating Income (NOI) minus mortgage payments. Calculation:NOI - Mortgage Payments | $3,117 | $37,404 |