
$1,099,900
Investment Summary
- Monthly Cash Flow
- -$4,444
- Cap Rate
- 1.2%
- Cash-on-Cash Return
- -21.1%
- Debt Coverage Ratio
- 0.20
- Internal Rate of Return (5 years)
- -16.4%
Cash Flow
Net Operating Income (NOI) minus mortgage payments.
Calculation:
NOI - Mortgage Payments
Cap Rate (Market Value)
Capitalization Rate is a rate of return that compares the yearly Net Operating Income (NOI) to the market value.
Calculation:
NOI / Market Value
Cash-on-Cash Return (CoC)
Annual Cash Flow / Cash Invested
Calculation:
Annual cash flow divided by initial cash invested.
Debt Coverage Ratio (DCR)
Net Operating Income (NOI) divided by total debt payments.
Calculation:
NOI / Total Debt Payments
Internal Rate of Return (IRR)
A metric for assessing profitability over time. IRR is the discount rate at which the net present value (NPV) of all future cash flows (positive and negative) from an investment equals zero — including both periodic cash flow (such as rent) and a projected sale at the end of the holding period. It represents the expected annualized return, accounting for income, expenses, and the recovery of capital through a future sale.
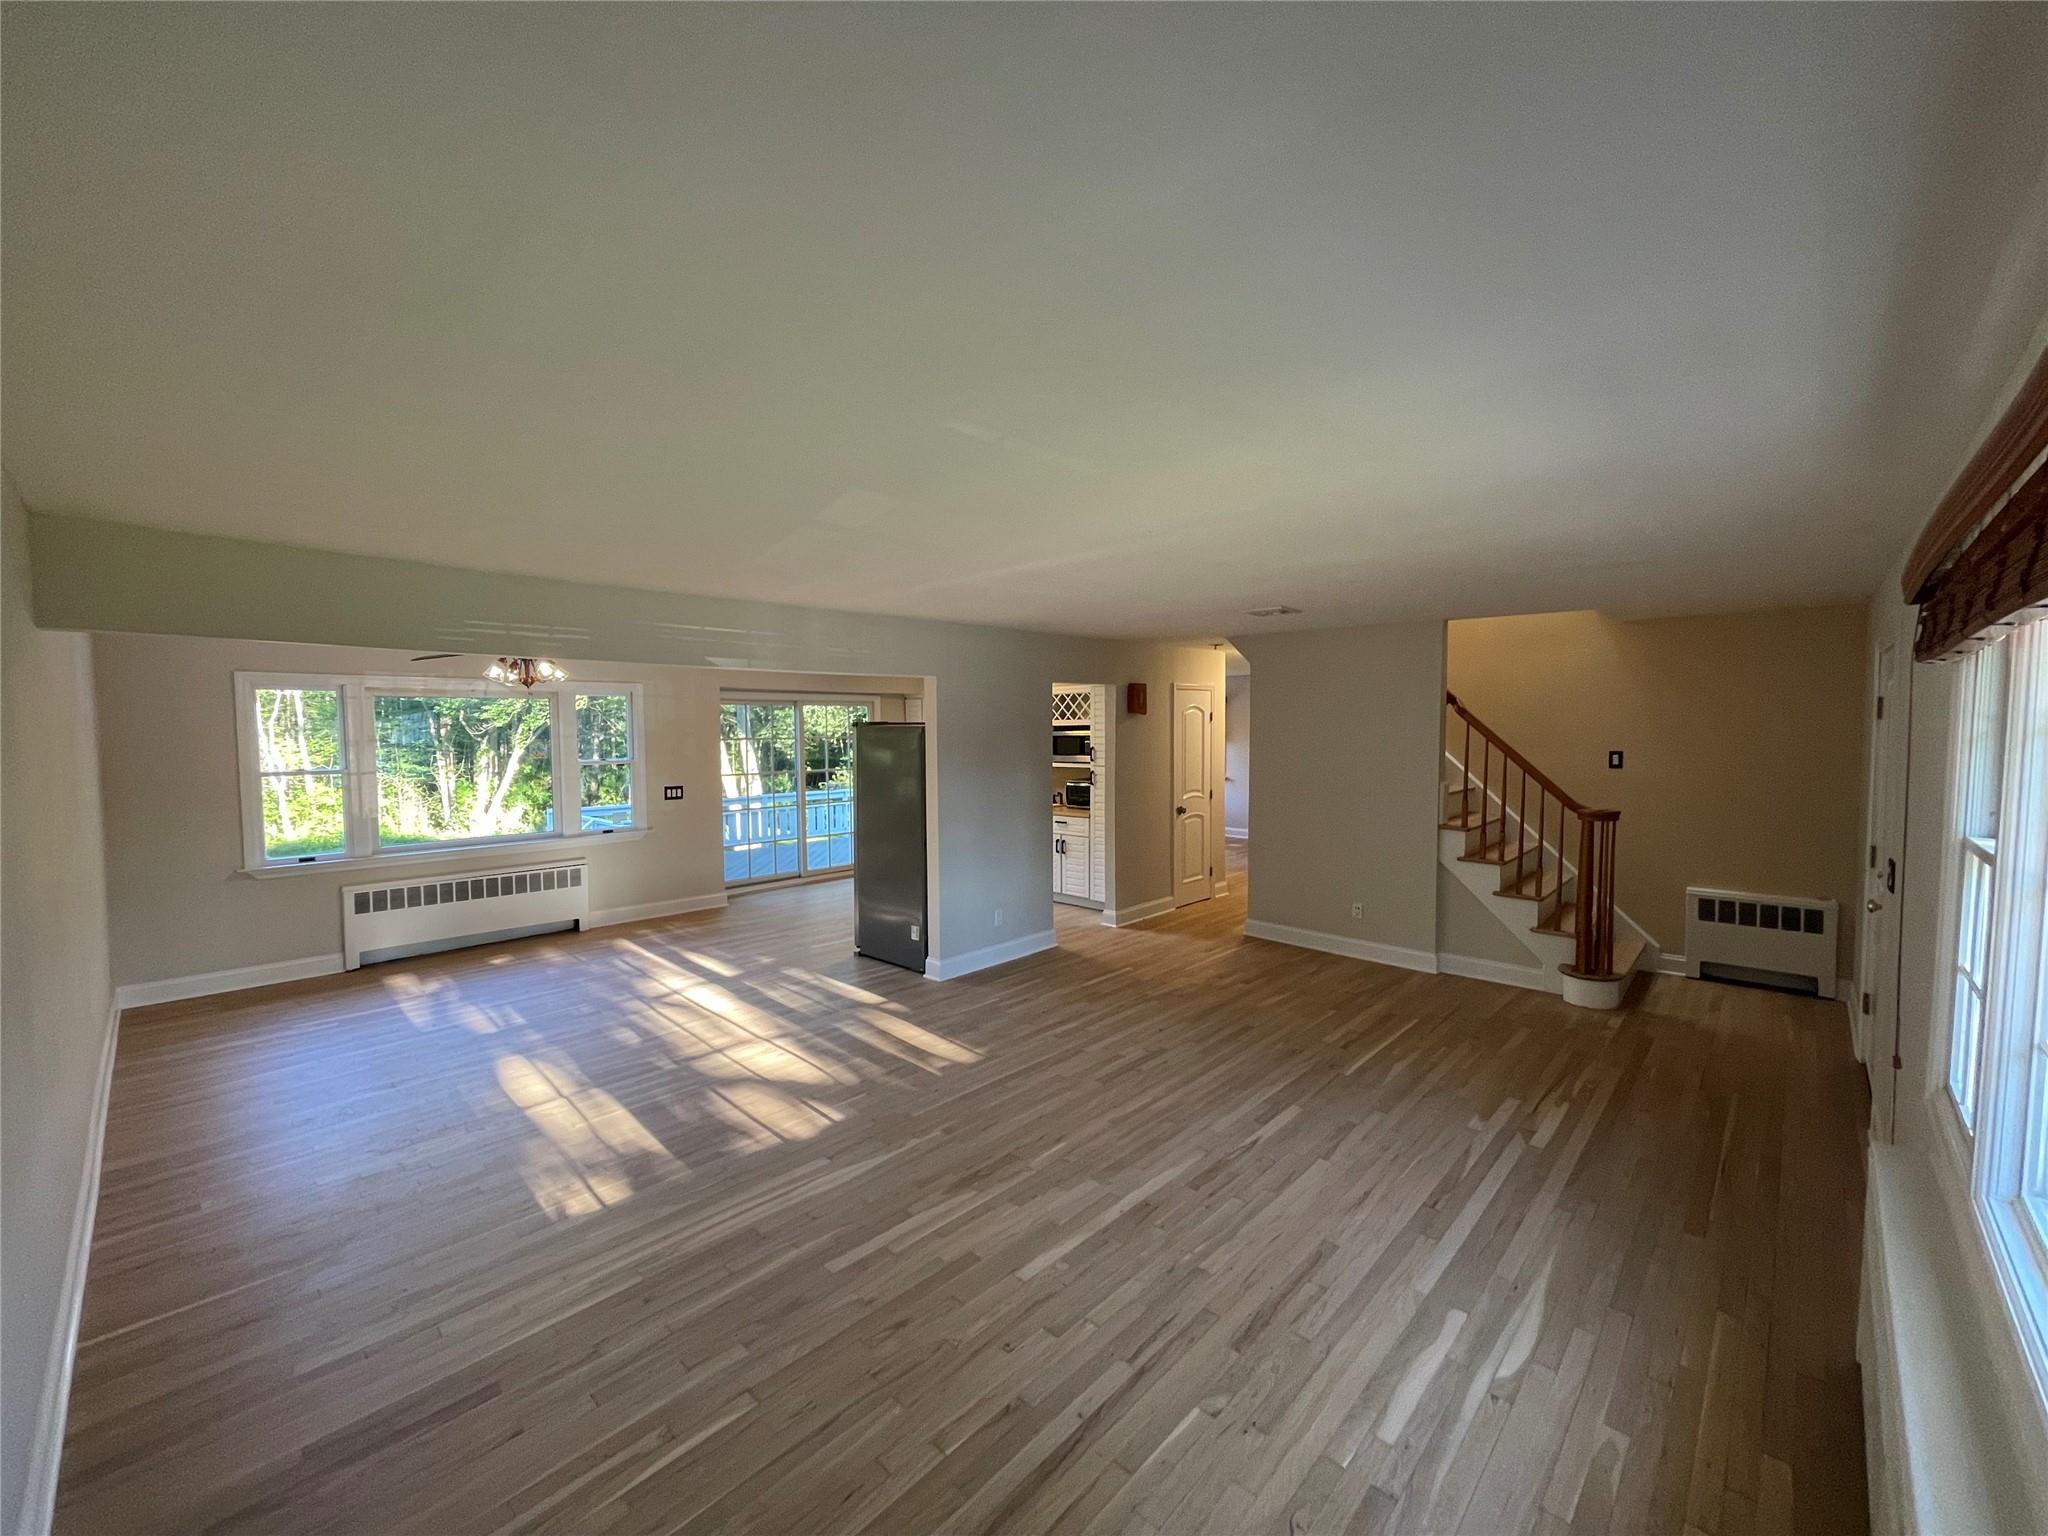
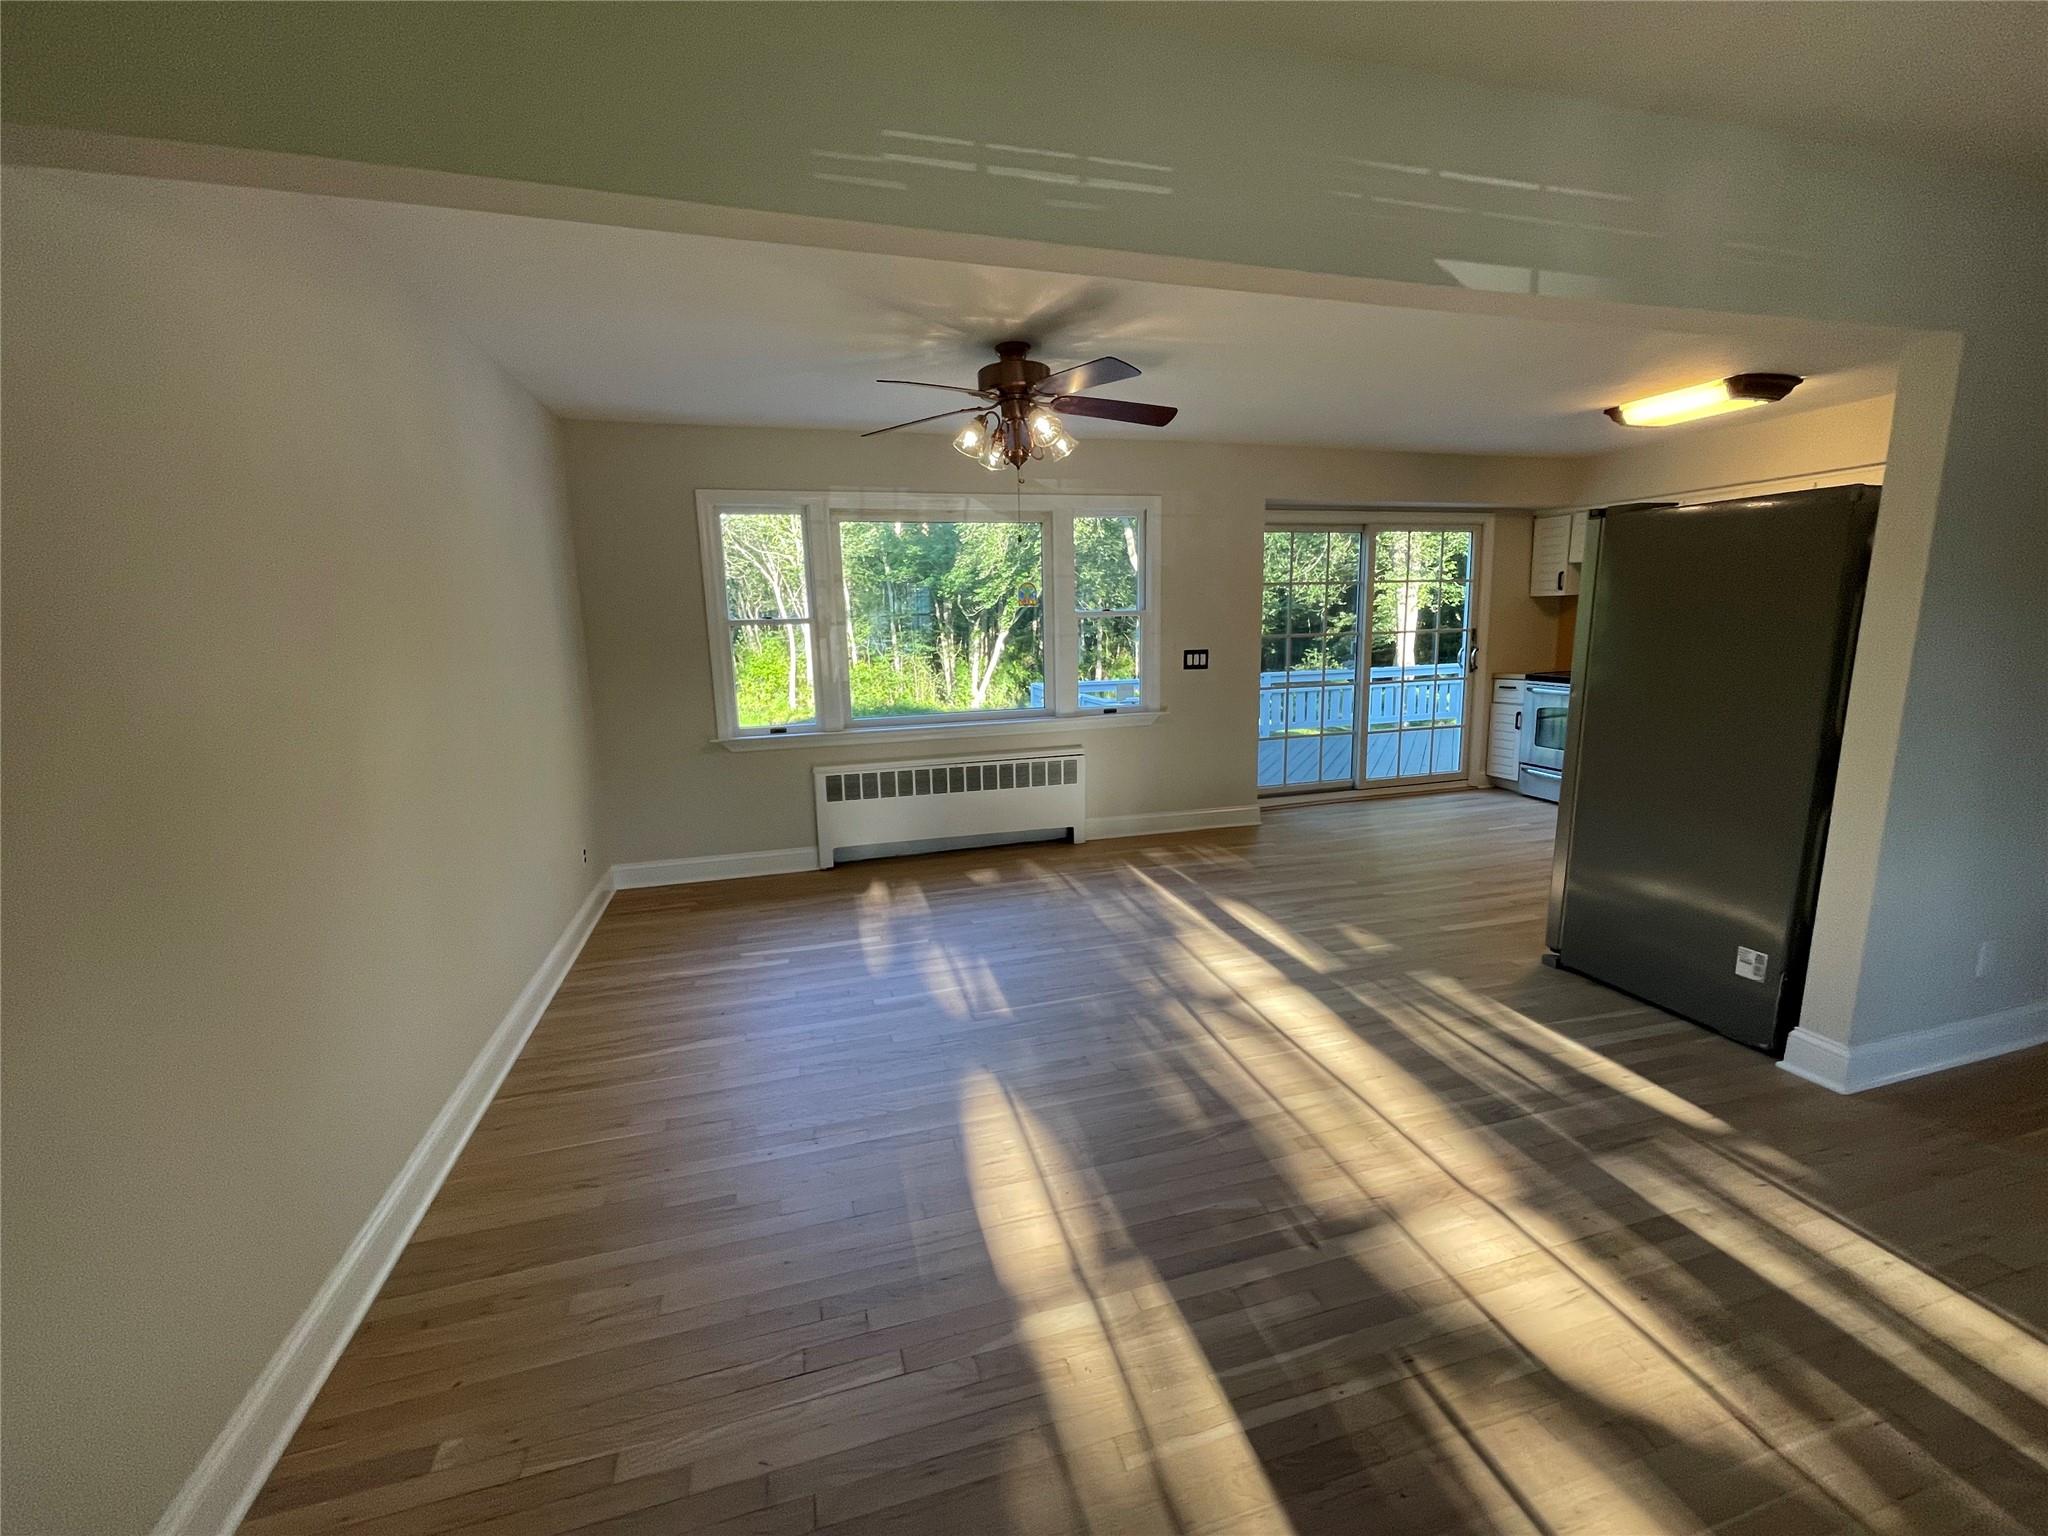
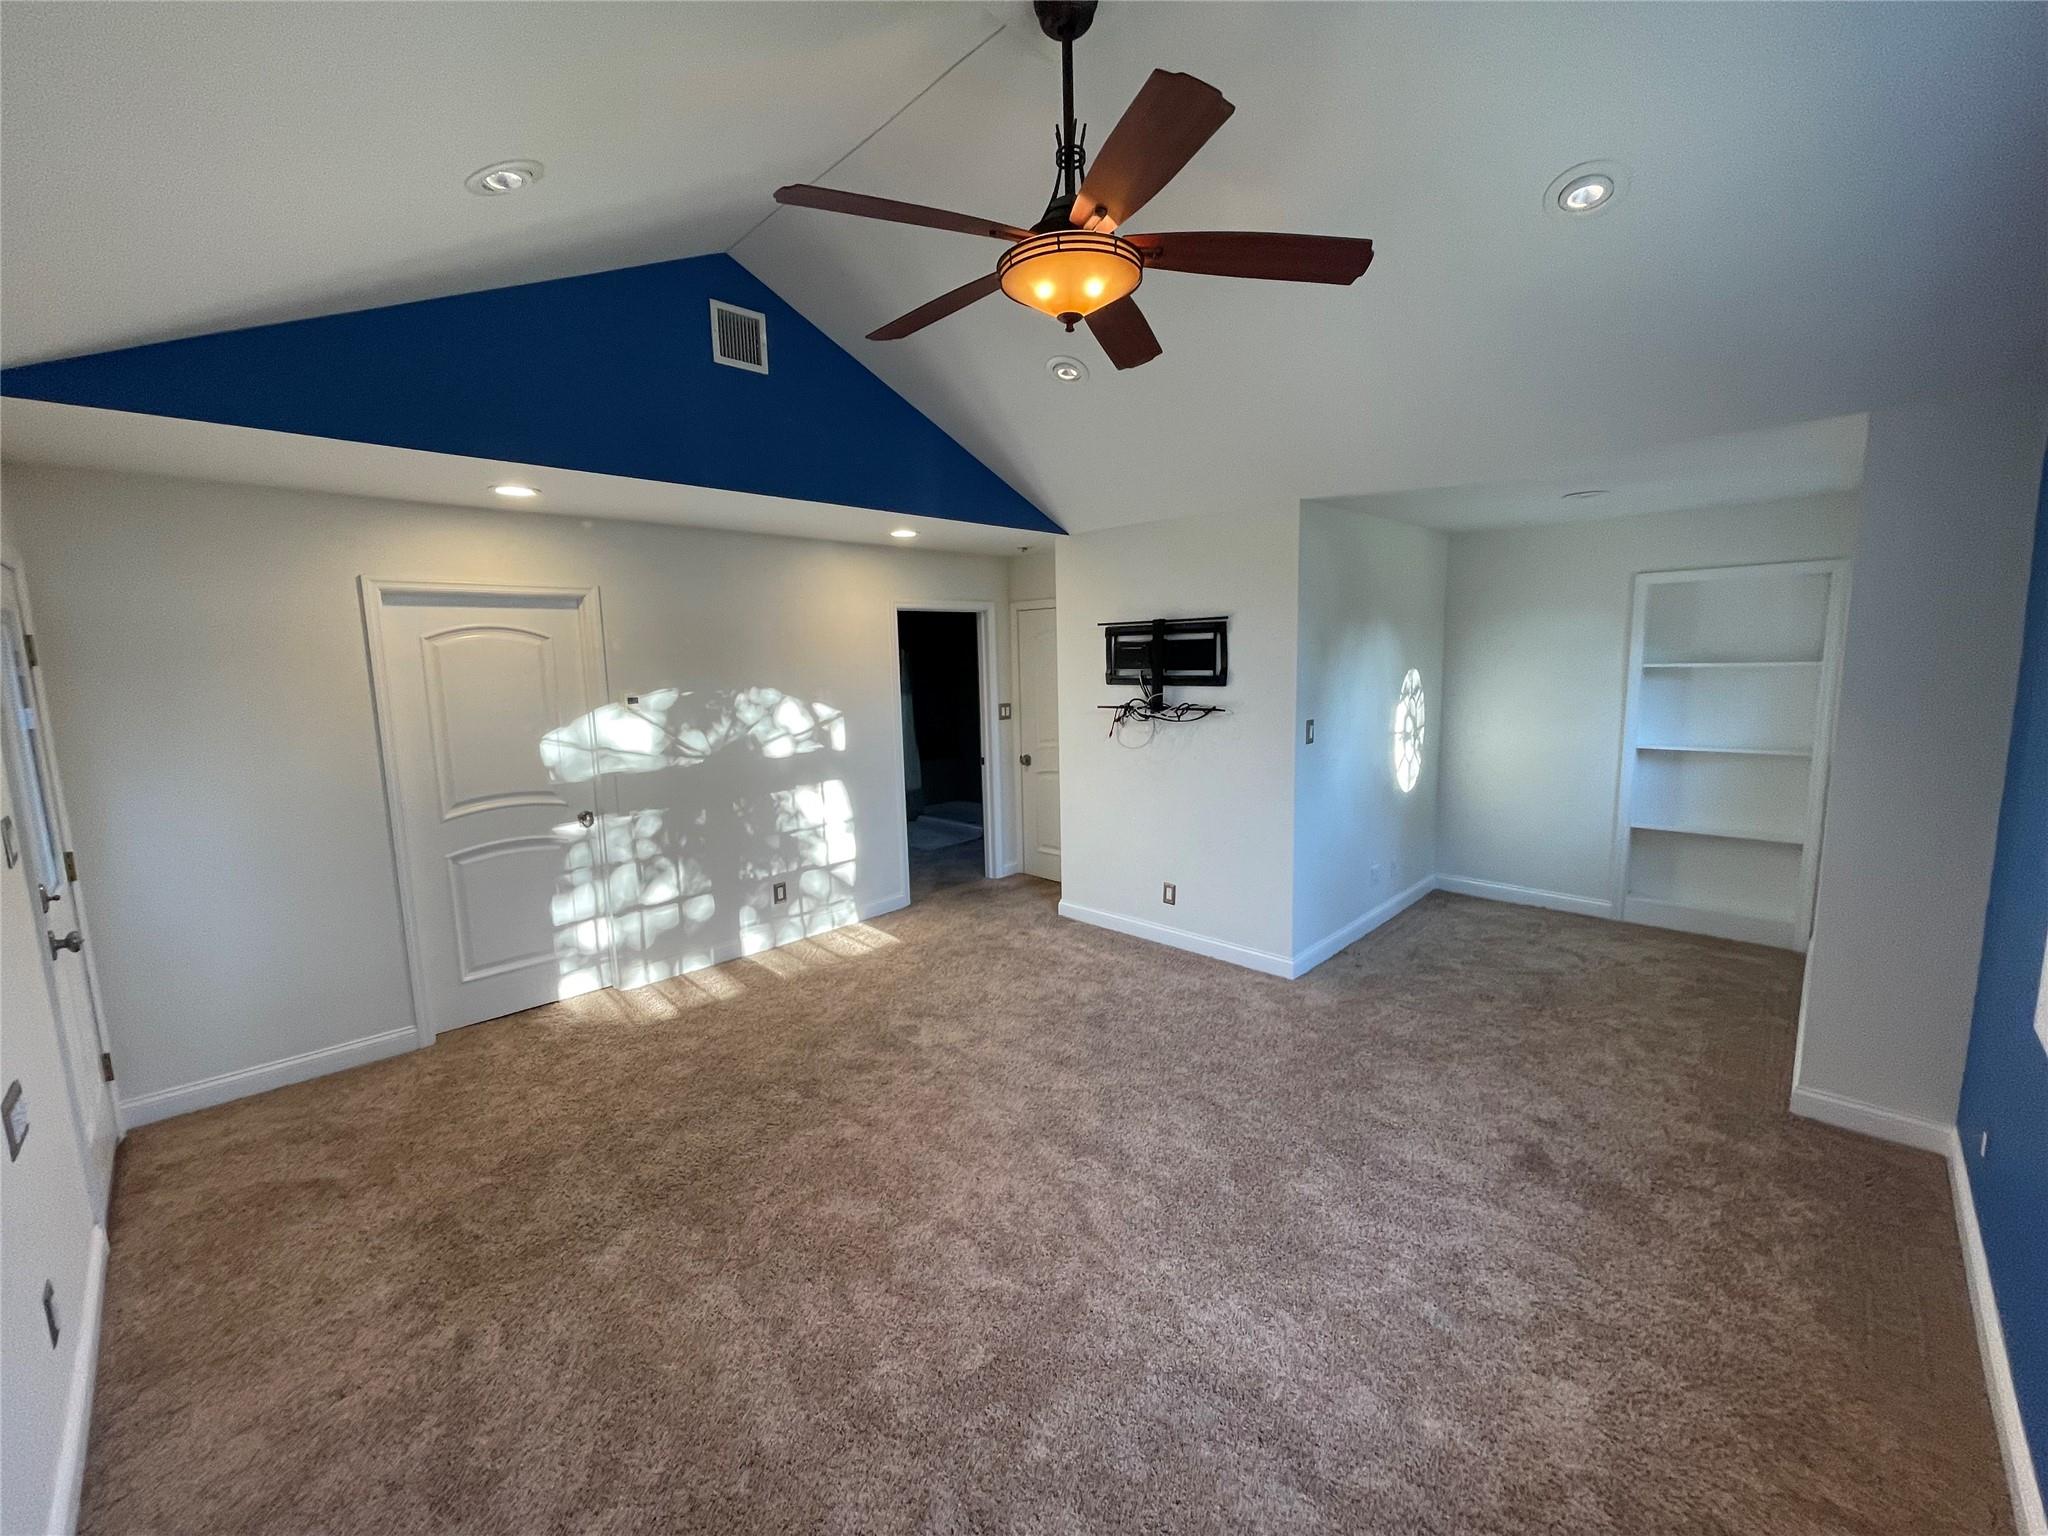
Property Description
Your very own private sanctuary with a Park like setting in your backyard. There's a natural free flowing large stream complete with visits from swans, ducks, hawks, owls, geese, blue herons, black crowned night herons, turtles, multi colored carp, rabbits, cardinals, blue jays, woodpeckers and more and sometimes with their babies. Ideally situated at the very end of a quiet cul de sac sits slightly less than a 1/4 acre of a well situated Center Hall Colonial that capitalizes on the elevated and unique view of the beautiful backyard which must be seen to be fully understood and appreciated. Overlooking approximately 150 feet of stream edge it's a perfect blend of nature, wildlife and privacy while being conveniently located in South Bellmore. The house itself was dormered in 2013 transforming it from a Wide Line Expanded Cape Cod to a Center Hall Colonial. 3 Bedrooms,3 Full Bathrooms. The Primary Bedroom contains a 11 Foot Cathedral Ceiling,aesthetically pleasing architectural windows,recessed lighting. Has an en-suite with 12 Foot Vaulted Ceiling with a Skylight ,3 Body Sprays,Rain Shower Head,Removable Handheld Spray,Bench Seat,Dual Sink Bathroom Vanity,Ample Storage in Bathroom. Primary Bedroom has a Large Walk In Closet with shelves for him and her. Primary Bedroom has a rooftop terrace overlooking the park like property. For convenience the Washing Machine and Dryer room is on the 2nd Floor and also has sound deadening material within the walls to lessen any noise. Utility Closet is in close proximity to Washer/Dryer. 2nd Bedroom has 10 Feet Vaulted Ceiling with very large windows and ample closet space. 3rd Bedroom has large windows and ample closet space as well. 2 nd Floor Bathroom has tub and shower as well as 14 Foot Vaulted Ceiling and a Skylight for natural lighting. Stairwell has a skylight as well. Radiant Heat with 3 Zones on the 2nd Floor/Single Zone Heating System on 1st Floor. Central A/C. Oil Heat with a well maintained boiler. House is well insulated and energy efficient Andersen 400 Windows and high quality building materials were used. Rear outside entrance to the Full Unfinished Basement plus still contains the original washing machine piping & draining and dryer electrical outlet is still intact. Rear Deck off the Oversized Sliding Glass Door from the Kitchen. Attached Garage. Additional built in shed in the rear corner. Although the stream flows through the rear yard it is not in a flood zone and flood insurance is not required by a lender. Flood Insurance is optional and costs approximately $700 a year through FEMA. Owner was present during Superstorm Sandy and no water came in the house and no power or heat was lost during it either. The word unique is a heavily overused term in the real estate industry but if you appreciate and value nature, wildlife, privacy along with convenience then unique perfectly describes this particular property.
Build Your Team
Quickly find investor-friendly professionals who can help you succeed in real estate investing at any stage of the investing journey.


Agents
Match with investor-friendly agents who can help you find, analyze, and close your next deal


Lenders
Get the best funding…find investor-friendly lenders who specialize in your deal strategy


Property Managers
Transition to passive investing. Find a trusted property management partnership that lasts.


Tax Pros & Accountants
Taxes and financial reporting made easy—find experts to create tax savings strategies, file taxes, and more
Location
Property Details
Parking
- Description: Garage
- Garage Spaces: 1
- Spaces Total: 1
Bedroom Information
- # of Bedrooms: 3
Bathroom Information
- # of Baths (Full): 3
- # of Baths (Total): 3.0
Interior Features
- # of Rooms: 7
- # of Stories: 2
- Basement: Yes
- Basement Description: Full, Unfinished
Exterior Features
- Exterior Walls Materials: Siding (Alum/Vinyl)
Land Information
- Land Use: Residential
- Land Use Subtype: Single Family Residential
Lot Information
- Parcel ID: 56357000205
- Lot Size: 9750 sqft
Property Information
- Property Type: Single Family Residence
- Style: Colonial
- Year Built: 1960
Tax Information
- Annual Tax: $16,395
Utilities
- Water & Sewer: Public
- Heating: Baseboard, Radiant
- Cooling: Central Air
Location
- County: Nassau
Listing Details
Investment Summary
- Monthly Cash Flow
- -$4,444
- Cap Rate
- 1.2%
- Cash-on-Cash Return
- -21.1%
- Debt Coverage Ratio
- 0.20
- Internal Rate of Return (5 years)
- -16.4%
Cash Flow
Net Operating Income (NOI) minus mortgage payments.
Calculation:
NOI - Mortgage Payments
Cap Rate (Market Value)
Capitalization Rate is a rate of return that compares the yearly Net Operating Income (NOI) to the market value.
Calculation:
NOI / Market Value
Cash-on-Cash Return (CoC)
Annual Cash Flow / Cash Invested
Calculation:
Annual cash flow divided by initial cash invested.
Debt Coverage Ratio (DCR)
Net Operating Income (NOI) divided by total debt payments.
Calculation:
NOI / Total Debt Payments
Internal Rate of Return (IRR)
A metric for assessing profitability over time. IRR is the discount rate at which the net present value (NPV) of all future cash flows (positive and negative) from an investment equals zero — including both periodic cash flow (such as rent) and a projected sale at the end of the holding period. It represents the expected annualized return, accounting for income, expenses, and the recovery of capital through a future sale.
Purchase Details
Purchase PriceThe price paid for the property. Purchase price:
| $1,099,900 |
|---|---|
Amount FinancedThe amount of the purchase financed through a loan. Amount financed:
| -$879,920 |
Down paymentThe initial payment made towards the purchase. Down payment:
| $219,980 |
Closing CostsFees and expenses associated with purchasing a property, typically ranging from 2% to 5% of the home’s purchase price, paid at the end of a home purchase to cover services like lending, title transfer, and taxes. Closing costs:
| $32,997 |
Rehab CostsCosts incurred to repair or improve the property, including: roof, flooring, exterior siding, kitchen, exterior paint, bathrooms, etc. Rehab costs:
| $0 |
Initial Cash InvestedThe total initial cash invested in the property. Calculation:Down payment + Buying costs + Rehab costs Initial cash invested:
| $252,977 |
Square Feet (SQFT)The total square footage of the property. Square feet:
| 1,989 |
Cost Per Square FootCost per square foot of the property. Calculation:Purchase Price / Square Feet Cost per square foot:
| $553 |
Monthly Rent Per Square FootMonthly rent divided by the number of square feet. This ratio helps investors compare rental income efficiency across properties, markets, and unit sizes Calculation:Monthly Rent / Square Feet Monthly rent per square foot:
| $1.81 |
Financing Details
Loan AmountThe total sum of money borrowed from a lender to finance a property purchase. Calculation:Purchase Price - Down Payment
Loan amount:
| $879,920 |
|---|---|
Loan to Value Ratio (LTV)Loan amount divided by the market value of the property. Calculation:Loan Amount / Market Value
Loan to value ratio:
| 80.0% |
Loan TypeThe type of loan (e.g., fixed, adjustable).
Loan type:
| Amortizing |
TermThe loan repayment period in years.
Term:
| 30 years |
Interest RateThe percentage a lender charges on the borrowed amount of a loan, determining the cost of borrowing money.
Interest rate:
| 6.500% |
Principal & Interest (PI)The principal is the portion of the loan payment that reduces the loan balance. The interest is the lender's charge for borrowing money. Calculation:(P * r * (1 + r) ** n) / ((1 + r) ** n - 1) Where:
P = Loan amount (principal)
Principal & interest:
| $5,562 |
Property TaxesAnnual taxes levied by local governments on real estate properties. These taxes fund public services like schools, roads, and emergency services.
Property tax:
| $1,366 |
InsuranceThe costs for insurance coverage to protect against financial losses due to risks like fire, natural disasters, theft, liability, or tenant-related damages. Calculation:Assumes 7% of gross rental income, unless insurance rates are specified.
Insurance:
| $252 |
Private Mortgage Insurance (PMI)A fee that borrowers pay when they take out a conventional loan with a loan-to-value (LTV) ratio above 80%.
Private mortgage insurance (PMI):
| $0 |
Monthly PaymentThe fixed amount a borrower pays each month to repay a loan. It typically includes principal and interest (P&I) and may also cover property taxes, insurance, HOA fees, and PMI if escrowed. Monthly payment:
| $7,180 |
Operating Income
| % Rent | Monthly | Yearly | |
|---|---|---|---|
Gross RentThe total rental income received from tenants before deducting any expenses. Includes base rent, late fees, pet fees, parking fees, and other recurring charges.
Gross rent:
| $3,600 | $43,200 | |
Vacancy LossExpected loss of rent due to vacancies.
Vacancy loss:
(6%)
| 6% | -$216 | -$2,592 |
Operating IncomeGross rental income minus vacancy loss. Calculation:Gross rent - Vacancy loss
Operating income:
| $3,384 | $40,608 |
Operating Expenses
| % Rent | Monthly | Yearly | |
|---|---|---|---|
Property TaxesAnnual taxes levied by local governments on real estate properties. These taxes fund public services like schools, roads, and emergency services. | 38% | -$1,366 | -$16,395 |
InsuranceThe costs for insurance coverage to protect against financial losses due to risks like fire, natural disasters, theft, liability, or tenant-related damages. Calculation:Assumes 7% of gross rental income, unless insurance rates are specified. | 7% | -$252 | -$3,024 |
Property ManagementThe costs associated with hiring a property manager to handle the day-to-day operations of a rental property. Includes management fees, leasing fes, eviction fees, etc. Calculation:Assumes 8% of gross rental income. | 8% | -$288 | -$3,456 |
Repairs & MaintenanceOngoing costs for routine upkeep and minor fixes needed to keep a property in good working condition. Calculation:Assumes 5% of gross rental income. Varies by property age and condition. | 5% | -$180 | -$2,160 |
Capital ExpensesLarge, infrequent costs for major improvements or replacements, like a new roof, HVAC system, or appliances. Calculation:Assumes 5% of gross rental income. Varies by property age. | 5% | -$180 | -$2,160 |
HOA FeesRegular dues paid to a Homeowners Association for community maintenance, amenities, and management. Similar fees include: Condo Association Fees, Co-op Maintenance Fees, etc. | n/a | n/a | n/a |
Operating ExpensesRecurring costs required to maintain and manage a rental property, including property taxes, insurance, maintenance, repairs, utilities (if paid by the owner), property management fees, and other day-to-day expenses. Calculation:Insurance + Property Taxes + Property Management + Repairs & Maintenance + Capital Expenditures + HOA Fees | 63% | -$2,266 | -$27,195 |
Cash Flow
| Monthly | Yearly | |
|---|---|---|
Net Operating Income (NOI)The income generated from a property after deducting all operating expenses but before deducting mortgage payments, taxes, and capital expenditures. Calculation:Gross Operating Income - Operating Expenses
Net operating income:
| $1,118 | $13,416 |
Mortgage PaymentThe fixed amount a borrower pays each month to repay a loan. It typically includes principal and interest (P&I) and may also cover property taxes, insurance, HOA fees, and PMI if escrowed. | -$5,562 | -$66,744 |
Cash FlowNet Operating Income (NOI) minus mortgage payments. Calculation:NOI - Mortgage Payments | $4,444 | $53,328 |