$995,000
Investment Summary
- Monthly Cash Flow
- -$2,389
- Cap Rate
- 3.3%
- Cash-on-Cash Return
- -12.5%
- Debt Coverage Ratio
- 0.53
- Internal Rate of Return (5 years)
- -8.1%
Cash Flow
Net Operating Income (NOI) minus mortgage payments.
Calculation:
NOI - Mortgage Payments
Cap Rate (Market Value)
Capitalization Rate is a rate of return that compares the yearly Net Operating Income (NOI) to the market value.
Calculation:
NOI / Market Value
Cash-on-Cash Return (CoC)
Annual Cash Flow / Cash Invested
Calculation:
Annual cash flow divided by initial cash invested.
Debt Coverage Ratio (DCR)
Net Operating Income (NOI) divided by total debt payments.
Calculation:
NOI / Total Debt Payments
Internal Rate of Return (IRR)
A metric for assessing profitability over time. IRR is the discount rate at which the net present value (NPV) of all future cash flows (positive and negative) from an investment equals zero — including both periodic cash flow (such as rent) and a projected sale at the end of the holding period. It represents the expected annualized return, accounting for income, expenses, and the recovery of capital through a future sale.
Property Description
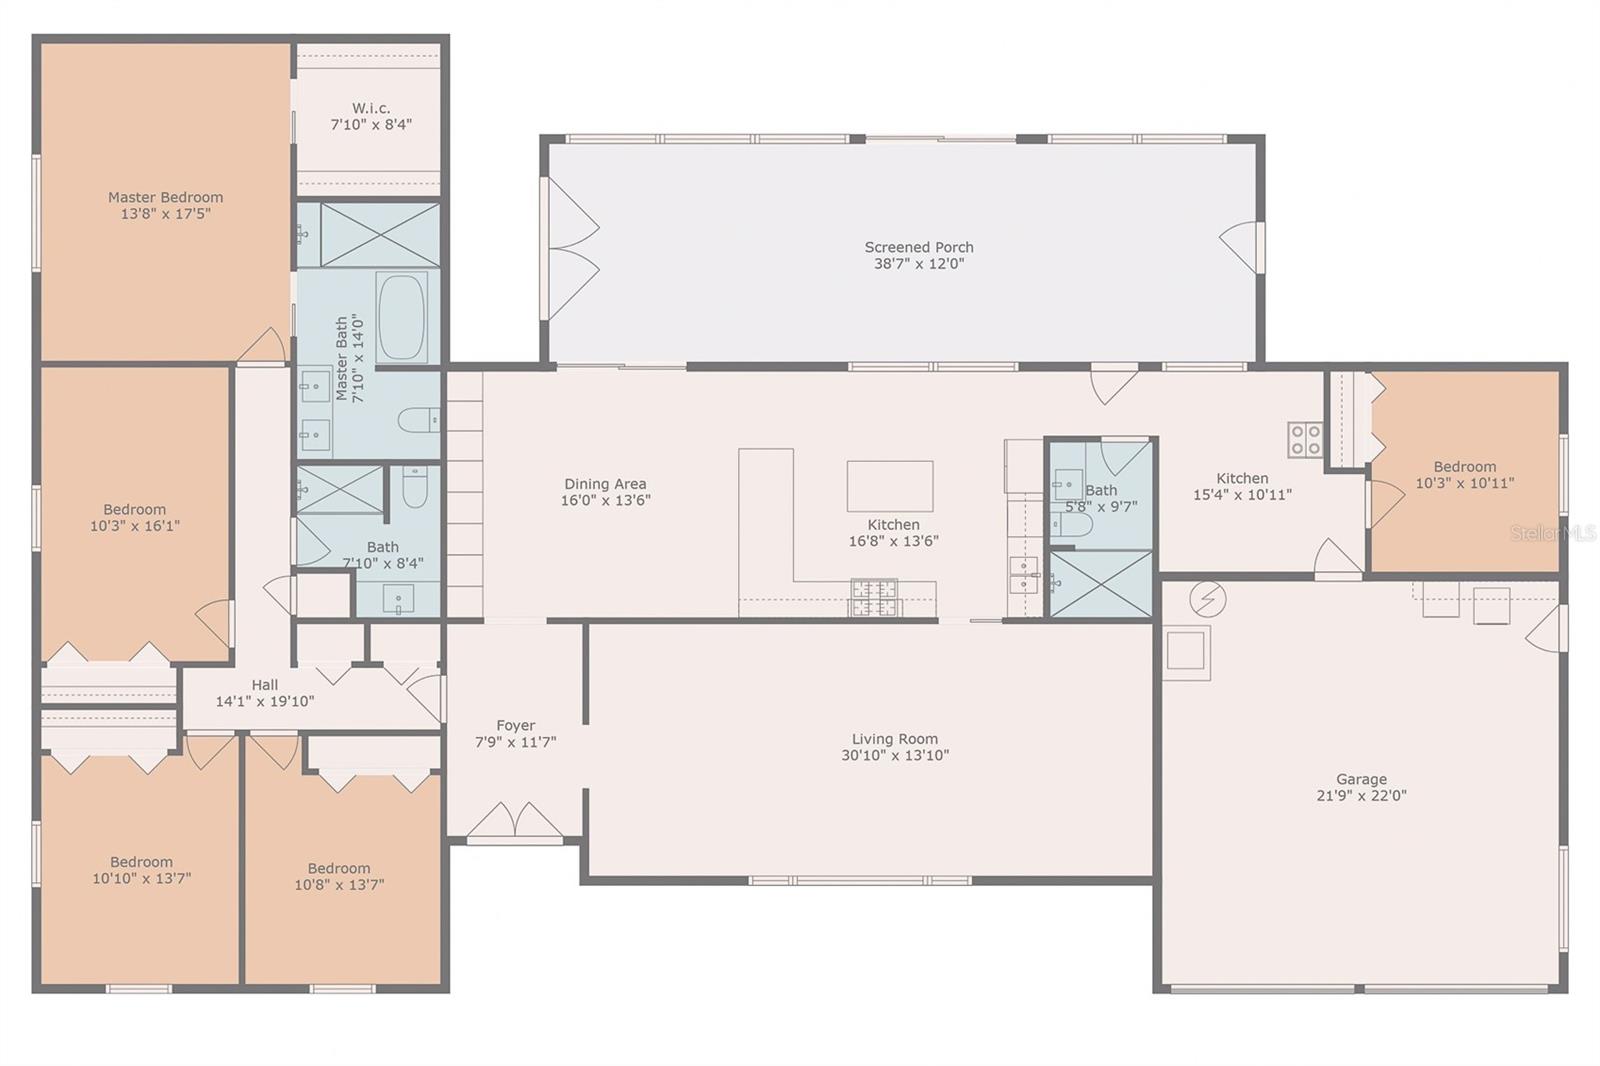
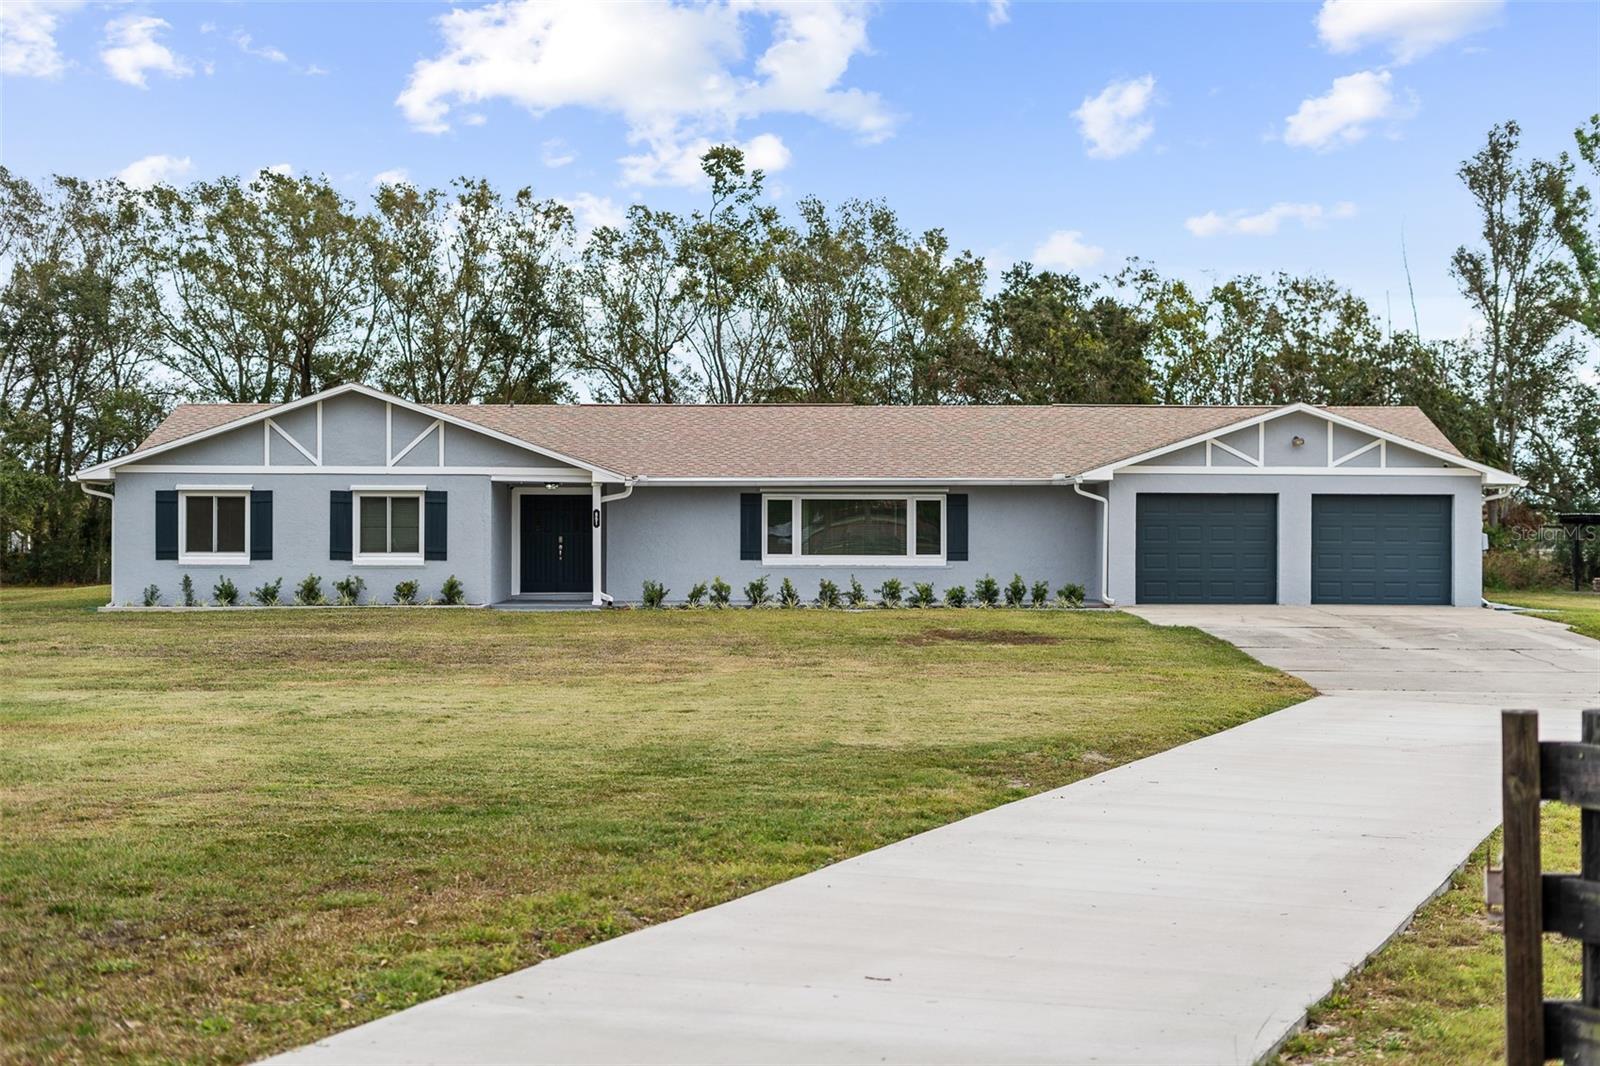
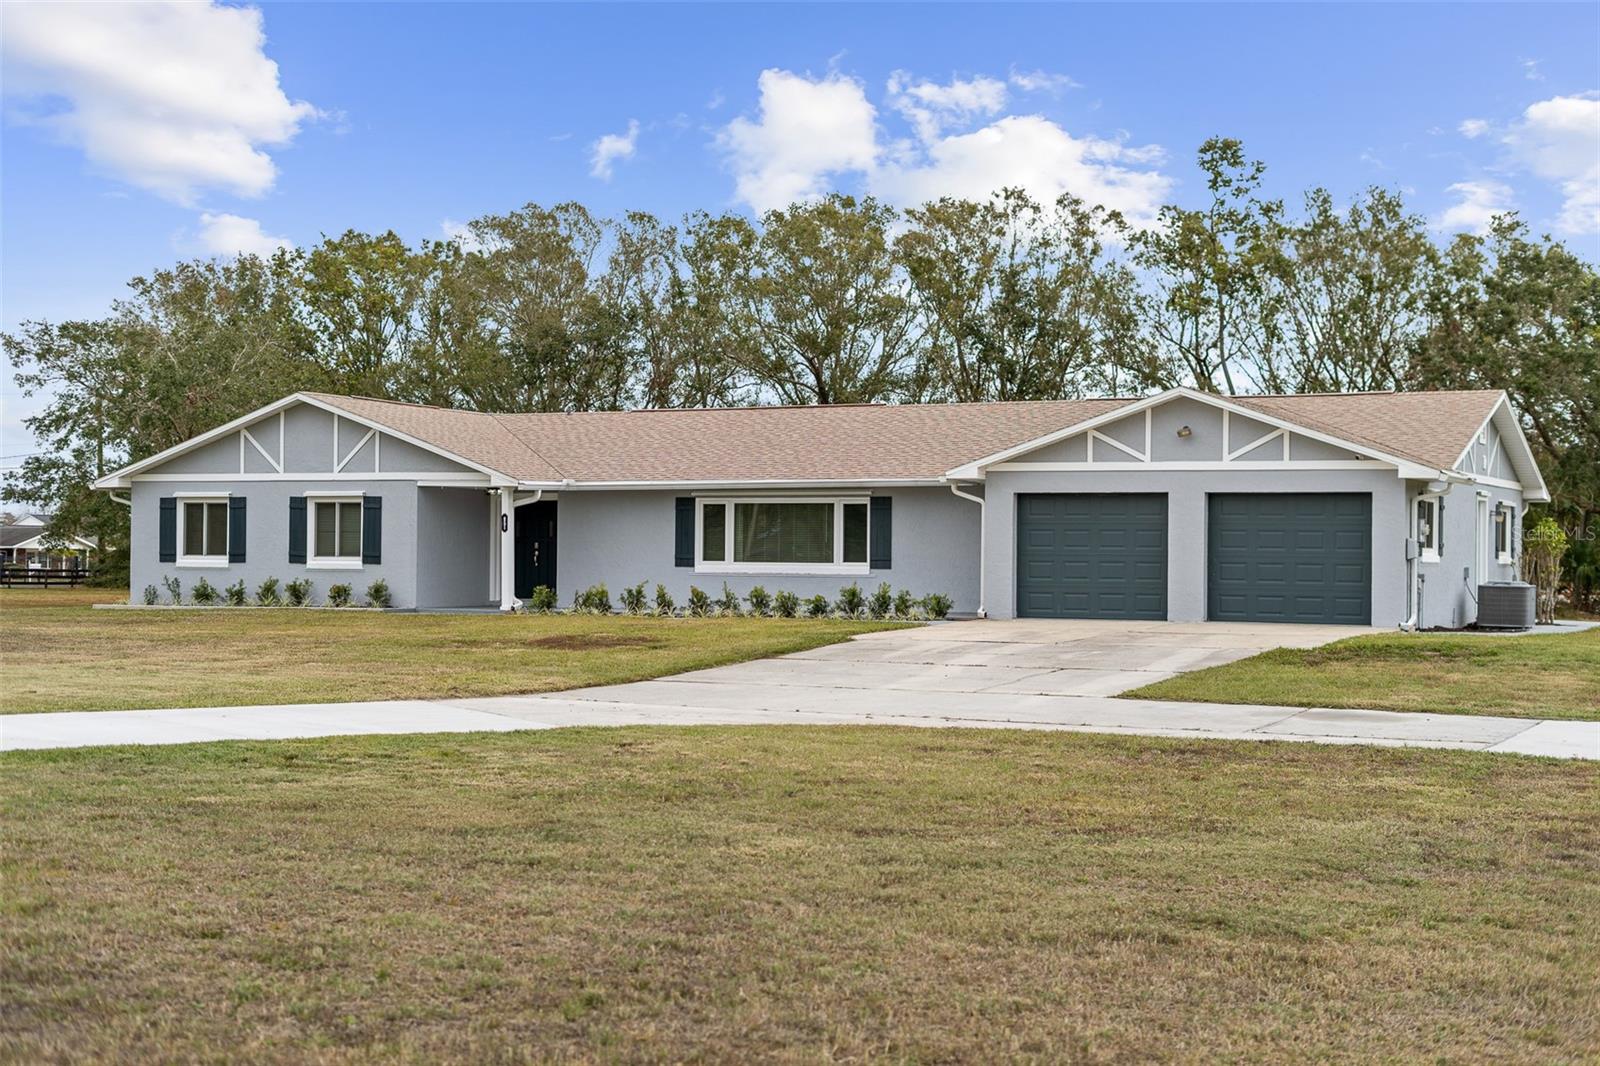
Step into your dream home nestled on an expansive 4.95-acre fully fenced and freshly cleared, tilled, & graded corner lot, offering privacy and space in a highly sought-after location with seamless access to the Florida Turnpike and Highway 417. This magnificent property has been meticulously renovated to provide an unparalleled living experience, combining modern amenities with ample outdoor space for endless possibilities. Breathtaking Outdoor Features Embrace the Florida lifestyle with all-new hurricane-rated windows and doors, complemented by hurricane shutters for added peace of mind. A sleek new concrete driveway welcomes you, leading to a charming home surrounded by newly installed concrete landscaping planters and fresh landscaping that beautifully frames the property. Enjoy the outdoors with spacious new patios at the front, side, and rear of the home, perfect for entertaining or simply relaxing in your private oasis. A colossal pole barn equipped with working electrical and fans, alongside a generously sized storage shed, provides abundant space for projects, storage, or hobbies. Modern and Comfortable Interior Enhancements Inside, the home has been thoughtfully expanded, enhancing the overall square footage under air. The owner suite boasts an expanded layout with a luxurious primary bath, ensuring comfort and elegance. The kitchen is a chef’s delight, featuring brand-new cabinets, sleek quartz countertops, state-of-the-art appliances, and stylish tile flooring. Each bathroom has been transformed with new vanities, toilets, showers, updated plumbing, tile flooring, and quartz countertops. The main living areas shine with new recessed lighting and exquisite wood luxury vinyl plank flooring, creating a warm and inviting atmosphere. State-of-the-Art Systems and Upgrades This property is equipped with a new HVAC systems (2020 & 2024) ensuring year-round comfort, a newly expanded septic drainfield, and all-new updated electrical systems complete with safety outlets for utmost safety and convenience. Enjoy pure and soft water with the latest water softener and filtration system. Unmatched Location and Opportunity Located in a prime area with easy access to major highways, this property offers the perfect blend of country serenity and city convenience. Whether you’re looking for a private retreat or a place to host family and friends, this home provides an extraordinary setting to create lasting memories. Not to mention the 5th bedroom sits just off what was once a secondary kitchen, this area could easily be turned into a full mother in-law suite with complete kitchen full bath and a great size room with its own entry through the garage if you are looking to keep a family member close and independent or just potential secure some additional income. Don’t miss out on this unique opportunity to own a beautifully renovated and spacious property in a fantastic location. Your dream lifestyle awaits!
Build Your Team
Quickly find investor-friendly professionals who can help you succeed in real estate investing at any stage of the investing journey.


Agents
Match with investor-friendly agents who can help you find, analyze, and close your next deal


Lenders
Get the best funding…find investor-friendly lenders who specialize in your deal strategy


Property Managers
Transition to passive investing. Find a trusted property management partnership that lasts.


Tax Pros & Accountants
Taxes and financial reporting made easy—find experts to create tax savings strategies, file taxes, and more
Location
Property Details
Parking
- Description: Garage
- Details: Attached
- Garage Spaces: 2
- Spaces Total: 0
Bedroom Information
- # of Bedrooms: 5
Bathroom Information
- # of Baths (Full): 3
- # of Baths (Total): 3.0
Interior Features
- # of Rooms: 9
- # of Stories: 1
Exterior Features
- Exterior Walls Materials: Concrete Block
- Foundation: Slab
- Roof Type: Gable or Hip
- Roof Material: Shingle
Land Information
- Land Use: Residential
- Land Use Subtype: Single Family Residential
Lot Information
- Parcel ID: 172530315000060210
- Lot Size: 215578 sqft
Property Information
- Property Type: Single Family Residence
- Year Built: 1983
Tax Information
- Annual Tax: $621
Utilities
- Water & Sewer: Private, Well
- Heating: Central, Electric
- Cooling: Central Air
Location
- County: Osceola
Listing Details
Investment Summary
- Monthly Cash Flow
- -$2,389
- Cap Rate
- 3.3%
- Cash-on-Cash Return
- -12.5%
- Debt Coverage Ratio
- 0.53
- Internal Rate of Return (5 years)
- -8.1%
Cash Flow
Net Operating Income (NOI) minus mortgage payments.
Calculation:
NOI - Mortgage Payments
Cap Rate (Market Value)
Capitalization Rate is a rate of return that compares the yearly Net Operating Income (NOI) to the market value.
Calculation:
NOI / Market Value
Cash-on-Cash Return (CoC)
Annual Cash Flow / Cash Invested
Calculation:
Annual cash flow divided by initial cash invested.
Debt Coverage Ratio (DCR)
Net Operating Income (NOI) divided by total debt payments.
Calculation:
NOI / Total Debt Payments
Internal Rate of Return (IRR)
A metric for assessing profitability over time. IRR is the discount rate at which the net present value (NPV) of all future cash flows (positive and negative) from an investment equals zero — including both periodic cash flow (such as rent) and a projected sale at the end of the holding period. It represents the expected annualized return, accounting for income, expenses, and the recovery of capital through a future sale.
Purchase Details
Purchase PriceThe price paid for the property. Purchase price:
| $995,000 |
|---|---|
Amount FinancedThe amount of the purchase financed through a loan. Amount financed:
| -$796,000 |
Down paymentThe initial payment made towards the purchase. Down payment:
| $199,000 |
Closing CostsFees and expenses associated with purchasing a property, typically ranging from 2% to 5% of the home’s purchase price, paid at the end of a home purchase to cover services like lending, title transfer, and taxes. Closing costs:
| $29,850 |
Rehab CostsCosts incurred to repair or improve the property, including: roof, flooring, exterior siding, kitchen, exterior paint, bathrooms, etc. Rehab costs:
| $0 |
Initial Cash InvestedThe total initial cash invested in the property. Calculation:Down payment + Buying costs + Rehab costs Initial cash invested:
| $228,850 |
Square Feet (SQFT)The total square footage of the property. Square feet:
| 3,167 |
Cost Per Square FootCost per square foot of the property. Calculation:Purchase Price / Square Feet Cost per square foot:
| $314 |
Monthly Rent Per Square FootMonthly rent divided by the number of square feet. This ratio helps investors compare rental income efficiency across properties, markets, and unit sizes Calculation:Monthly Rent / Square Feet Monthly rent per square foot:
| $1.26 |
Financing Details
Loan AmountThe total sum of money borrowed from a lender to finance a property purchase. Calculation:Purchase Price - Down Payment
Loan amount:
| $796,000 |
|---|---|
Loan to Value Ratio (LTV)Loan amount divided by the market value of the property. Calculation:Loan Amount / Market Value
Loan to value ratio:
| 80.0% |
Loan TypeThe type of loan (e.g., fixed, adjustable).
Loan type:
| Amortizing |
TermThe loan repayment period in years.
Term:
| 30 years |
Interest RateThe percentage a lender charges on the borrowed amount of a loan, determining the cost of borrowing money.
Interest rate:
| 6.625% |
Principal & Interest (PI)The principal is the portion of the loan payment that reduces the loan balance. The interest is the lender's charge for borrowing money. Calculation:(P * r * (1 + r) ** n) / ((1 + r) ** n - 1) Where:
P = Loan amount (principal)
Principal & interest:
| $5,097 |
Property TaxesAnnual taxes levied by local governments on real estate properties. These taxes fund public services like schools, roads, and emergency services.
Property tax:
| $52 |
InsuranceThe costs for insurance coverage to protect against financial losses due to risks like fire, natural disasters, theft, liability, or tenant-related damages. Calculation:Assumes 7% of gross rental income, unless insurance rates are specified.
Insurance:
| $280 |
Private Mortgage Insurance (PMI)A fee that borrowers pay when they take out a conventional loan with a loan-to-value (LTV) ratio above 80%.
Private mortgage insurance (PMI):
| $0 |
Monthly PaymentThe fixed amount a borrower pays each month to repay a loan. It typically includes principal and interest (P&I) and may also cover property taxes, insurance, HOA fees, and PMI if escrowed. Monthly payment:
| $5,429 |
Operating Income
| % Rent | Monthly | Yearly | |
|---|---|---|---|
Gross RentThe total rental income received from tenants before deducting any expenses. Includes base rent, late fees, pet fees, parking fees, and other recurring charges.
Gross rent:
| $4,000 | $48,000 | |
Vacancy LossExpected loss of rent due to vacancies.
Vacancy loss:
(6%)
| 6% | -$240 | -$2,880 |
Operating IncomeGross rental income minus vacancy loss. Calculation:Gross rent - Vacancy loss
Operating income:
| $3,760 | $45,120 |
Operating Expenses
| % Rent | Monthly | Yearly | |
|---|---|---|---|
Property TaxesAnnual taxes levied by local governments on real estate properties. These taxes fund public services like schools, roads, and emergency services. | 1% | -$52 | -$622 |
InsuranceThe costs for insurance coverage to protect against financial losses due to risks like fire, natural disasters, theft, liability, or tenant-related damages. Calculation:Assumes 7% of gross rental income, unless insurance rates are specified. | 7% | -$280 | -$3,360 |
Property ManagementThe costs associated with hiring a property manager to handle the day-to-day operations of a rental property. Includes management fees, leasing fes, eviction fees, etc. Calculation:Assumes 8% of gross rental income. | 8% | -$320 | -$3,840 |
Repairs & MaintenanceOngoing costs for routine upkeep and minor fixes needed to keep a property in good working condition. Calculation:Assumes 5% of gross rental income. Varies by property age and condition. | 5% | -$200 | -$2,400 |
Capital ExpensesLarge, infrequent costs for major improvements or replacements, like a new roof, HVAC system, or appliances. Calculation:Assumes 5% of gross rental income. Varies by property age. | 5% | -$200 | -$2,400 |
HOA FeesRegular dues paid to a Homeowners Association for community maintenance, amenities, and management. Similar fees include: Condo Association Fees, Co-op Maintenance Fees, etc. | n/a | n/a | n/a |
Operating ExpensesRecurring costs required to maintain and manage a rental property, including property taxes, insurance, maintenance, repairs, utilities (if paid by the owner), property management fees, and other day-to-day expenses. Calculation:Insurance + Property Taxes + Property Management + Repairs & Maintenance + Capital Expenditures + HOA Fees | 26% | -$1,052 | -$12,622 |
Cash Flow
| Monthly | Yearly | |
|---|---|---|
Net Operating Income (NOI)The income generated from a property after deducting all operating expenses but before deducting mortgage payments, taxes, and capital expenditures. Calculation:Gross Operating Income - Operating Expenses
Net operating income:
| $2,708 | $32,496 |
Mortgage PaymentThe fixed amount a borrower pays each month to repay a loan. It typically includes principal and interest (P&I) and may also cover property taxes, insurance, HOA fees, and PMI if escrowed. | -$5,097 | -$61,164 |
Cash FlowNet Operating Income (NOI) minus mortgage payments. Calculation:NOI - Mortgage Payments | $2,389 | $28,668 |