$479,999
Investment Summary
- Monthly Cash Flow
- -$1,751
- Cap Rate
- 1.7%
- Cash-on-Cash Return
- -19.0%
- Debt Coverage Ratio
- 0.28
- Internal Rate of Return (5 years)
- -14.4%
Cash Flow
Net Operating Income (NOI) minus mortgage payments.
Calculation:
NOI - Mortgage Payments
Cap Rate (Market Value)
Capitalization Rate is a rate of return that compares the yearly Net Operating Income (NOI) to the market value.
Calculation:
NOI / Market Value
Cash-on-Cash Return (CoC)
Annual Cash Flow / Cash Invested
Calculation:
Annual cash flow divided by initial cash invested.
Debt Coverage Ratio (DCR)
Net Operating Income (NOI) divided by total debt payments.
Calculation:
NOI / Total Debt Payments
Internal Rate of Return (IRR)
A metric for assessing profitability over time. IRR is the discount rate at which the net present value (NPV) of all future cash flows (positive and negative) from an investment equals zero — including both periodic cash flow (such as rent) and a projected sale at the end of the holding period. It represents the expected annualized return, accounting for income, expenses, and the recovery of capital through a future sale.
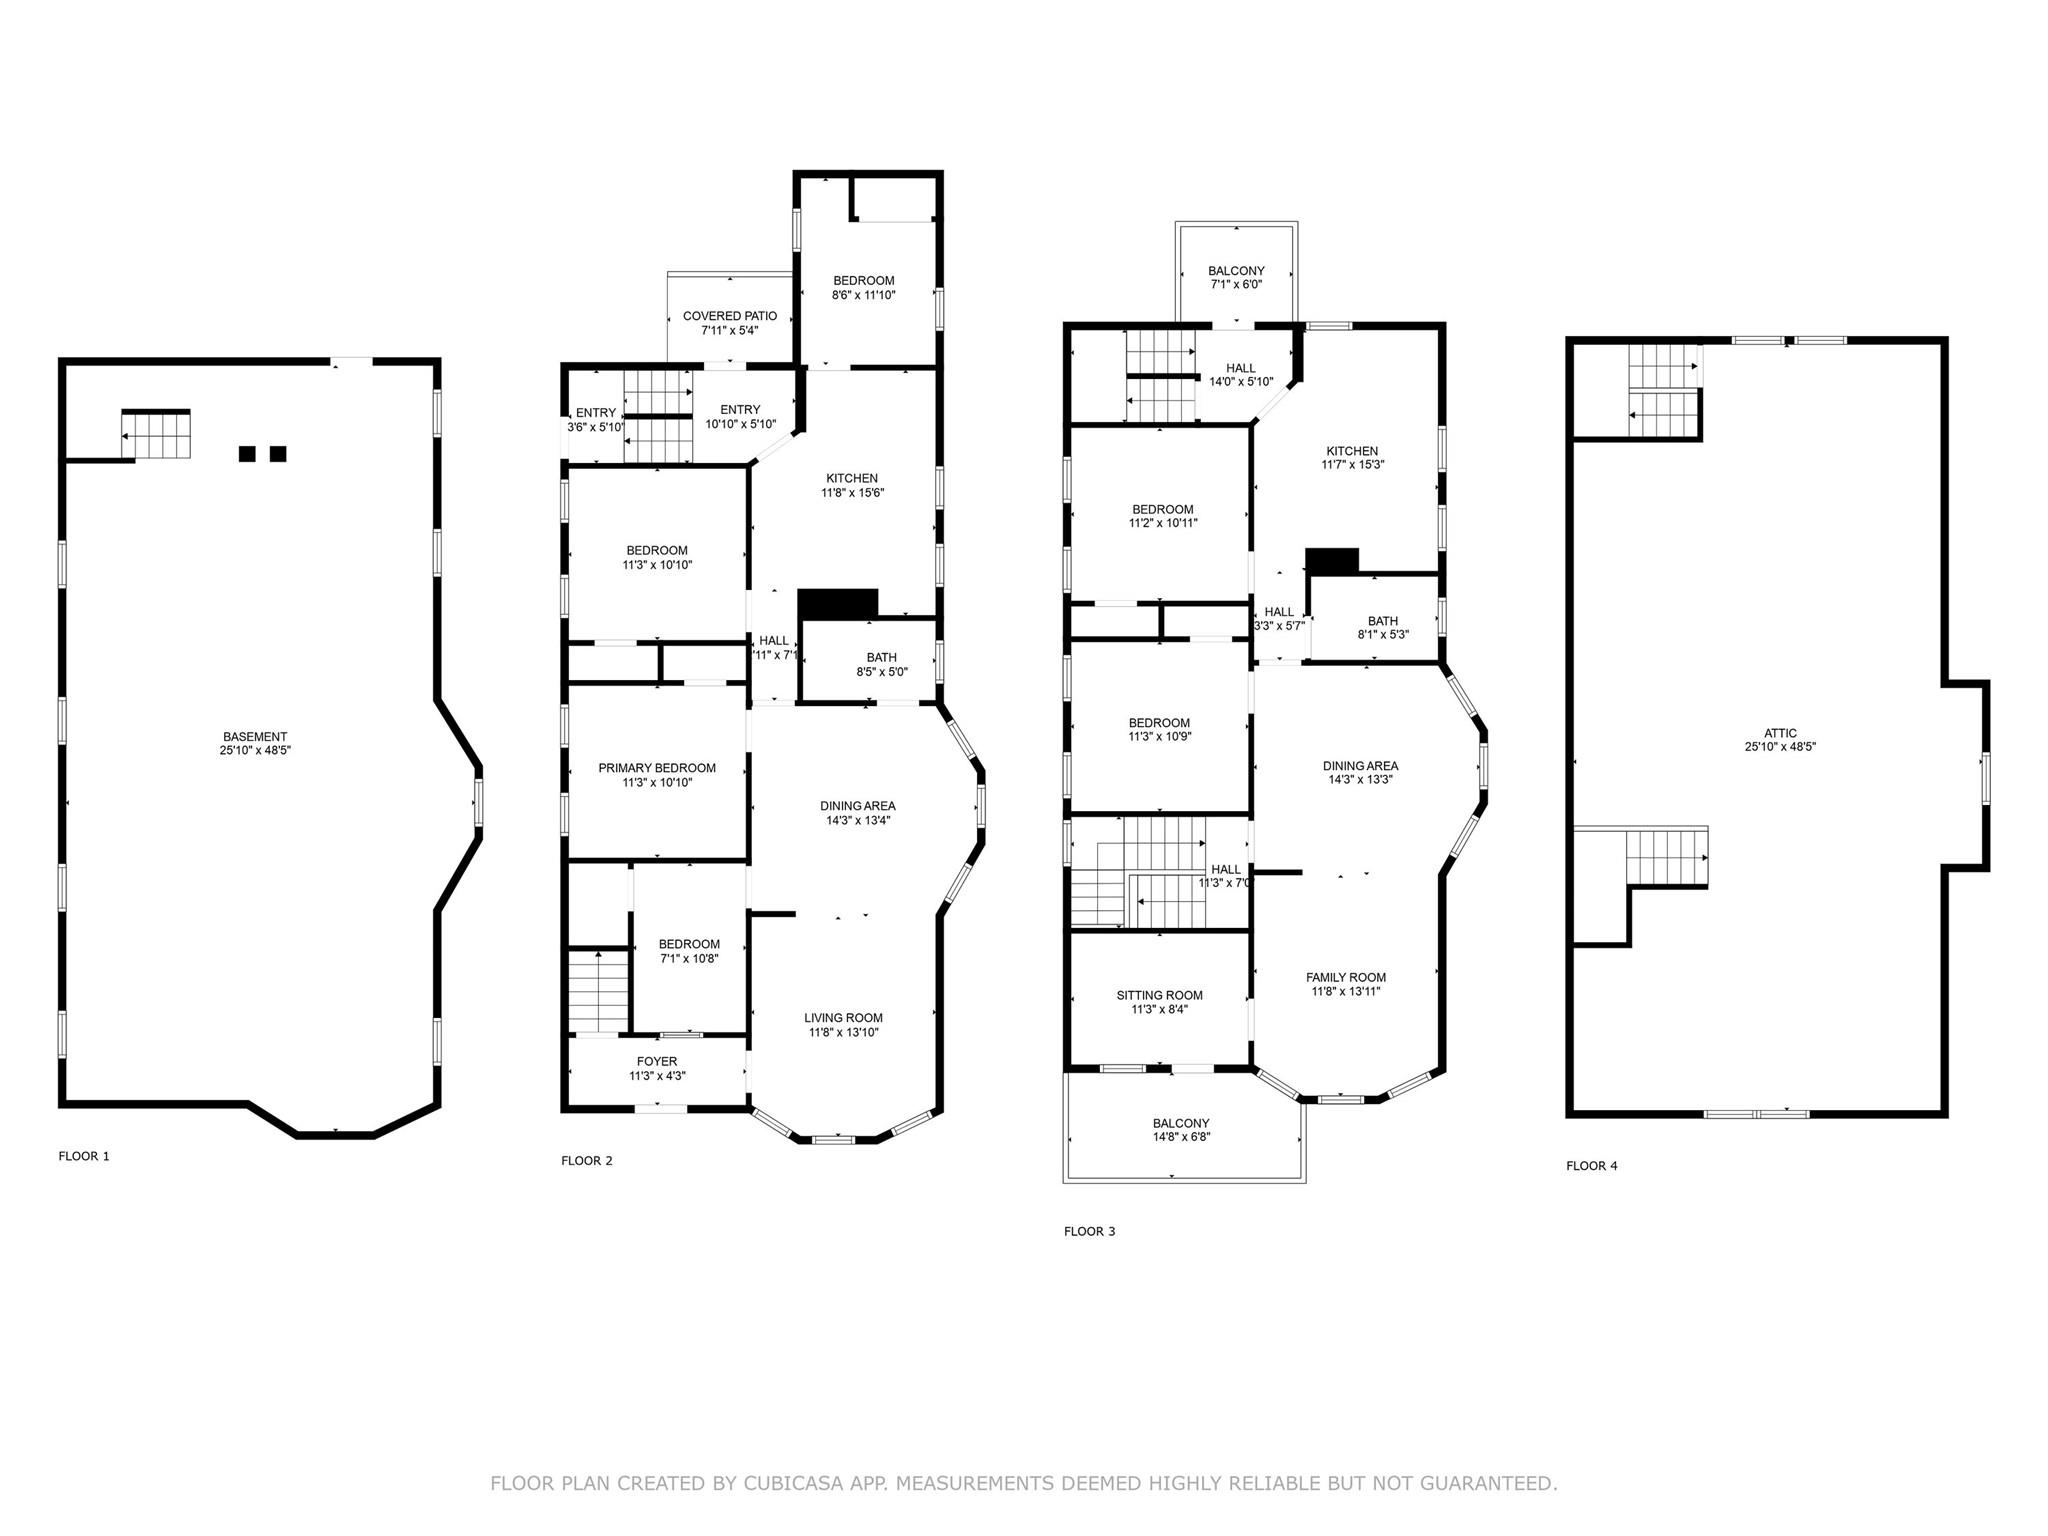
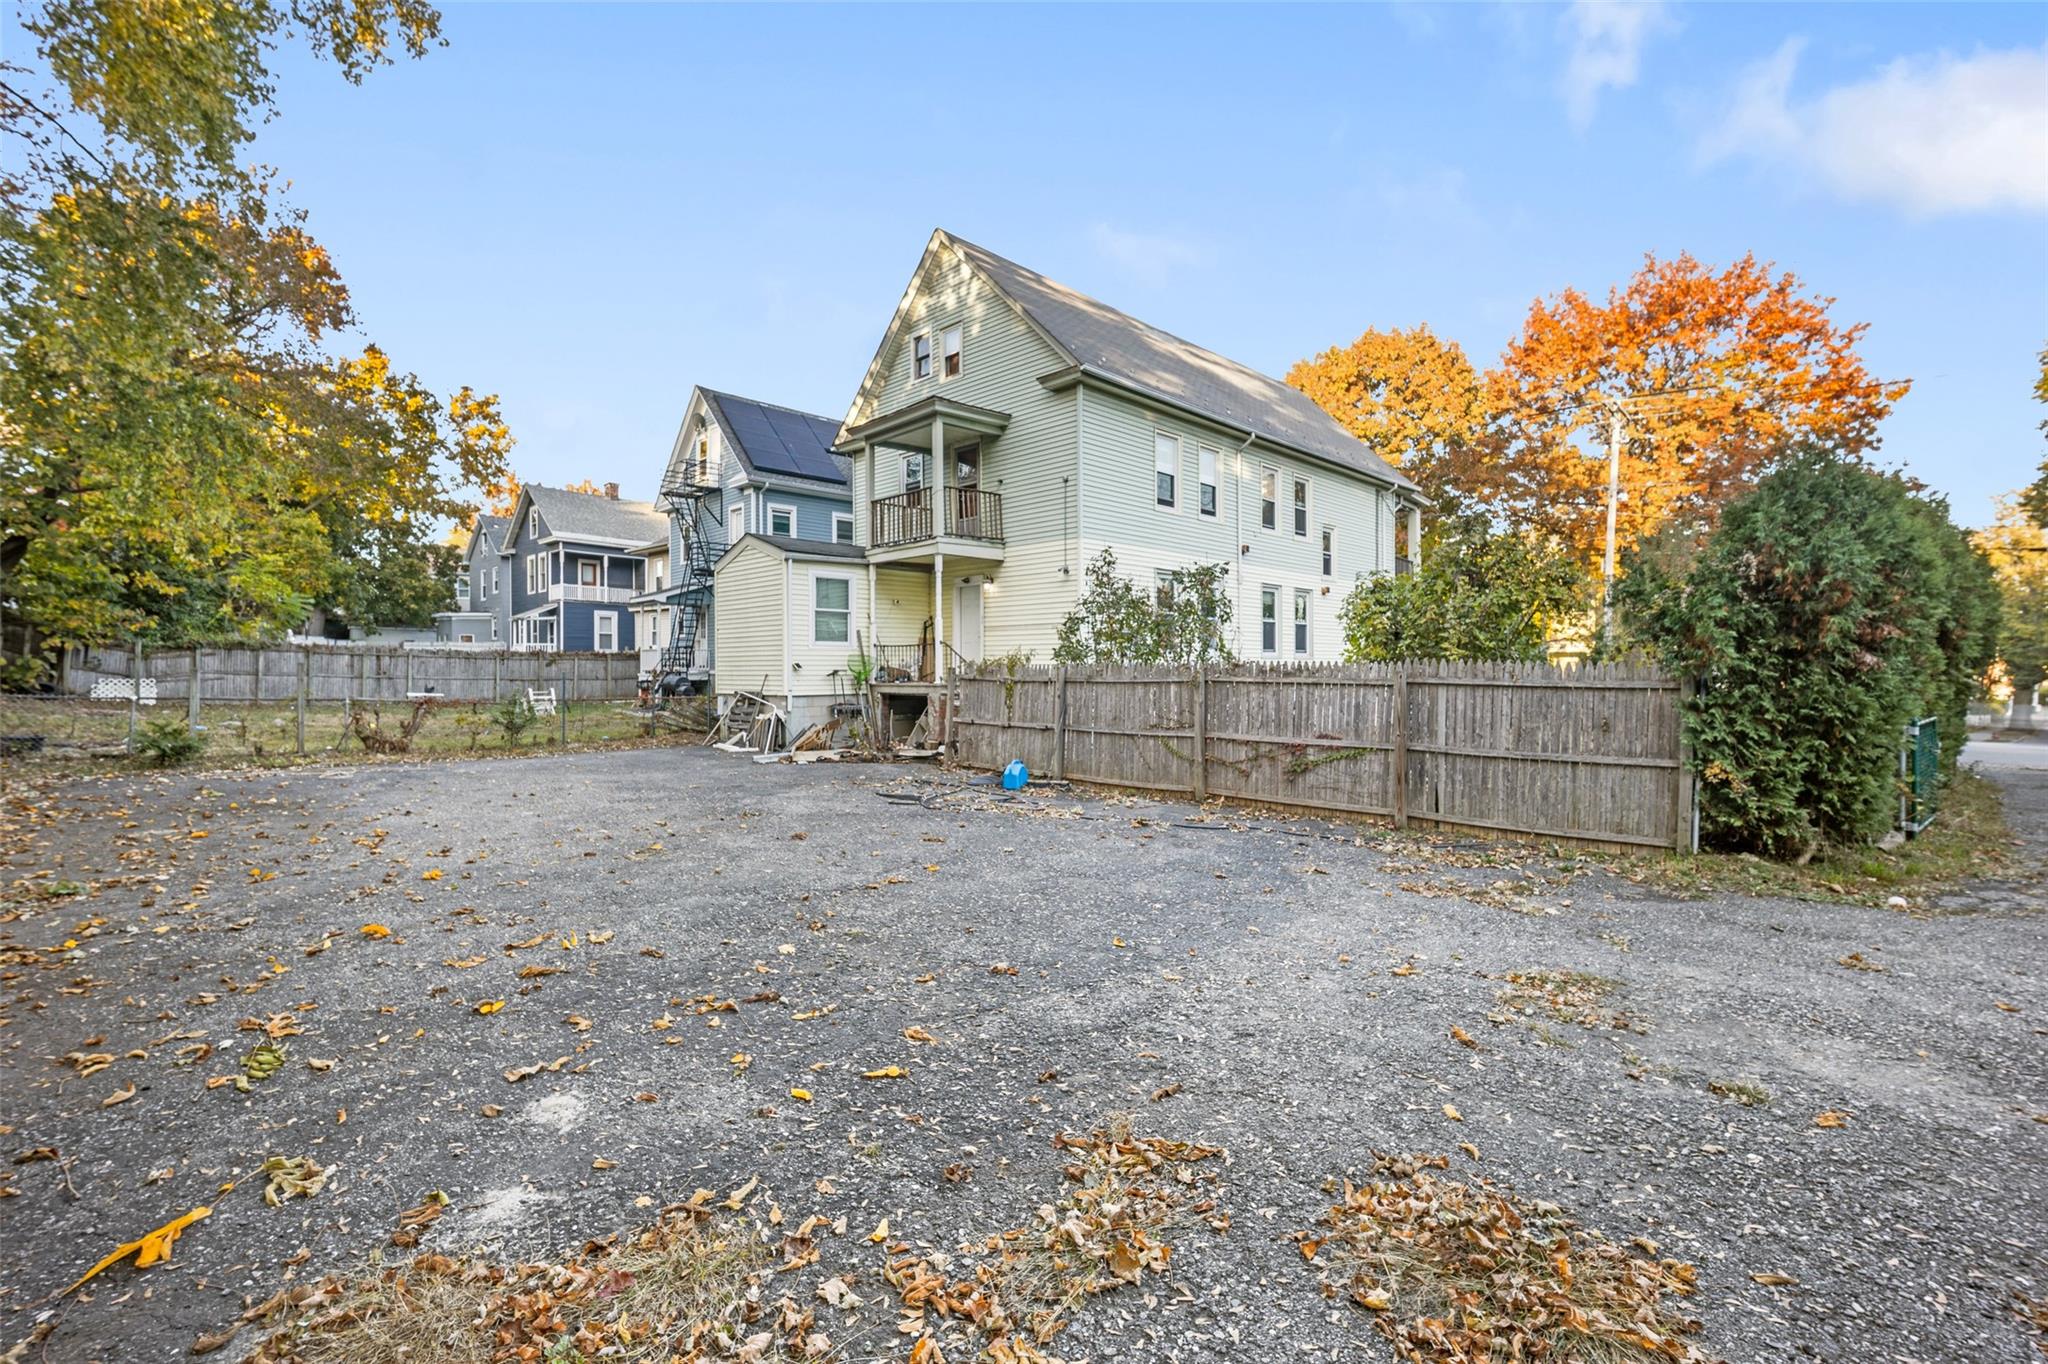
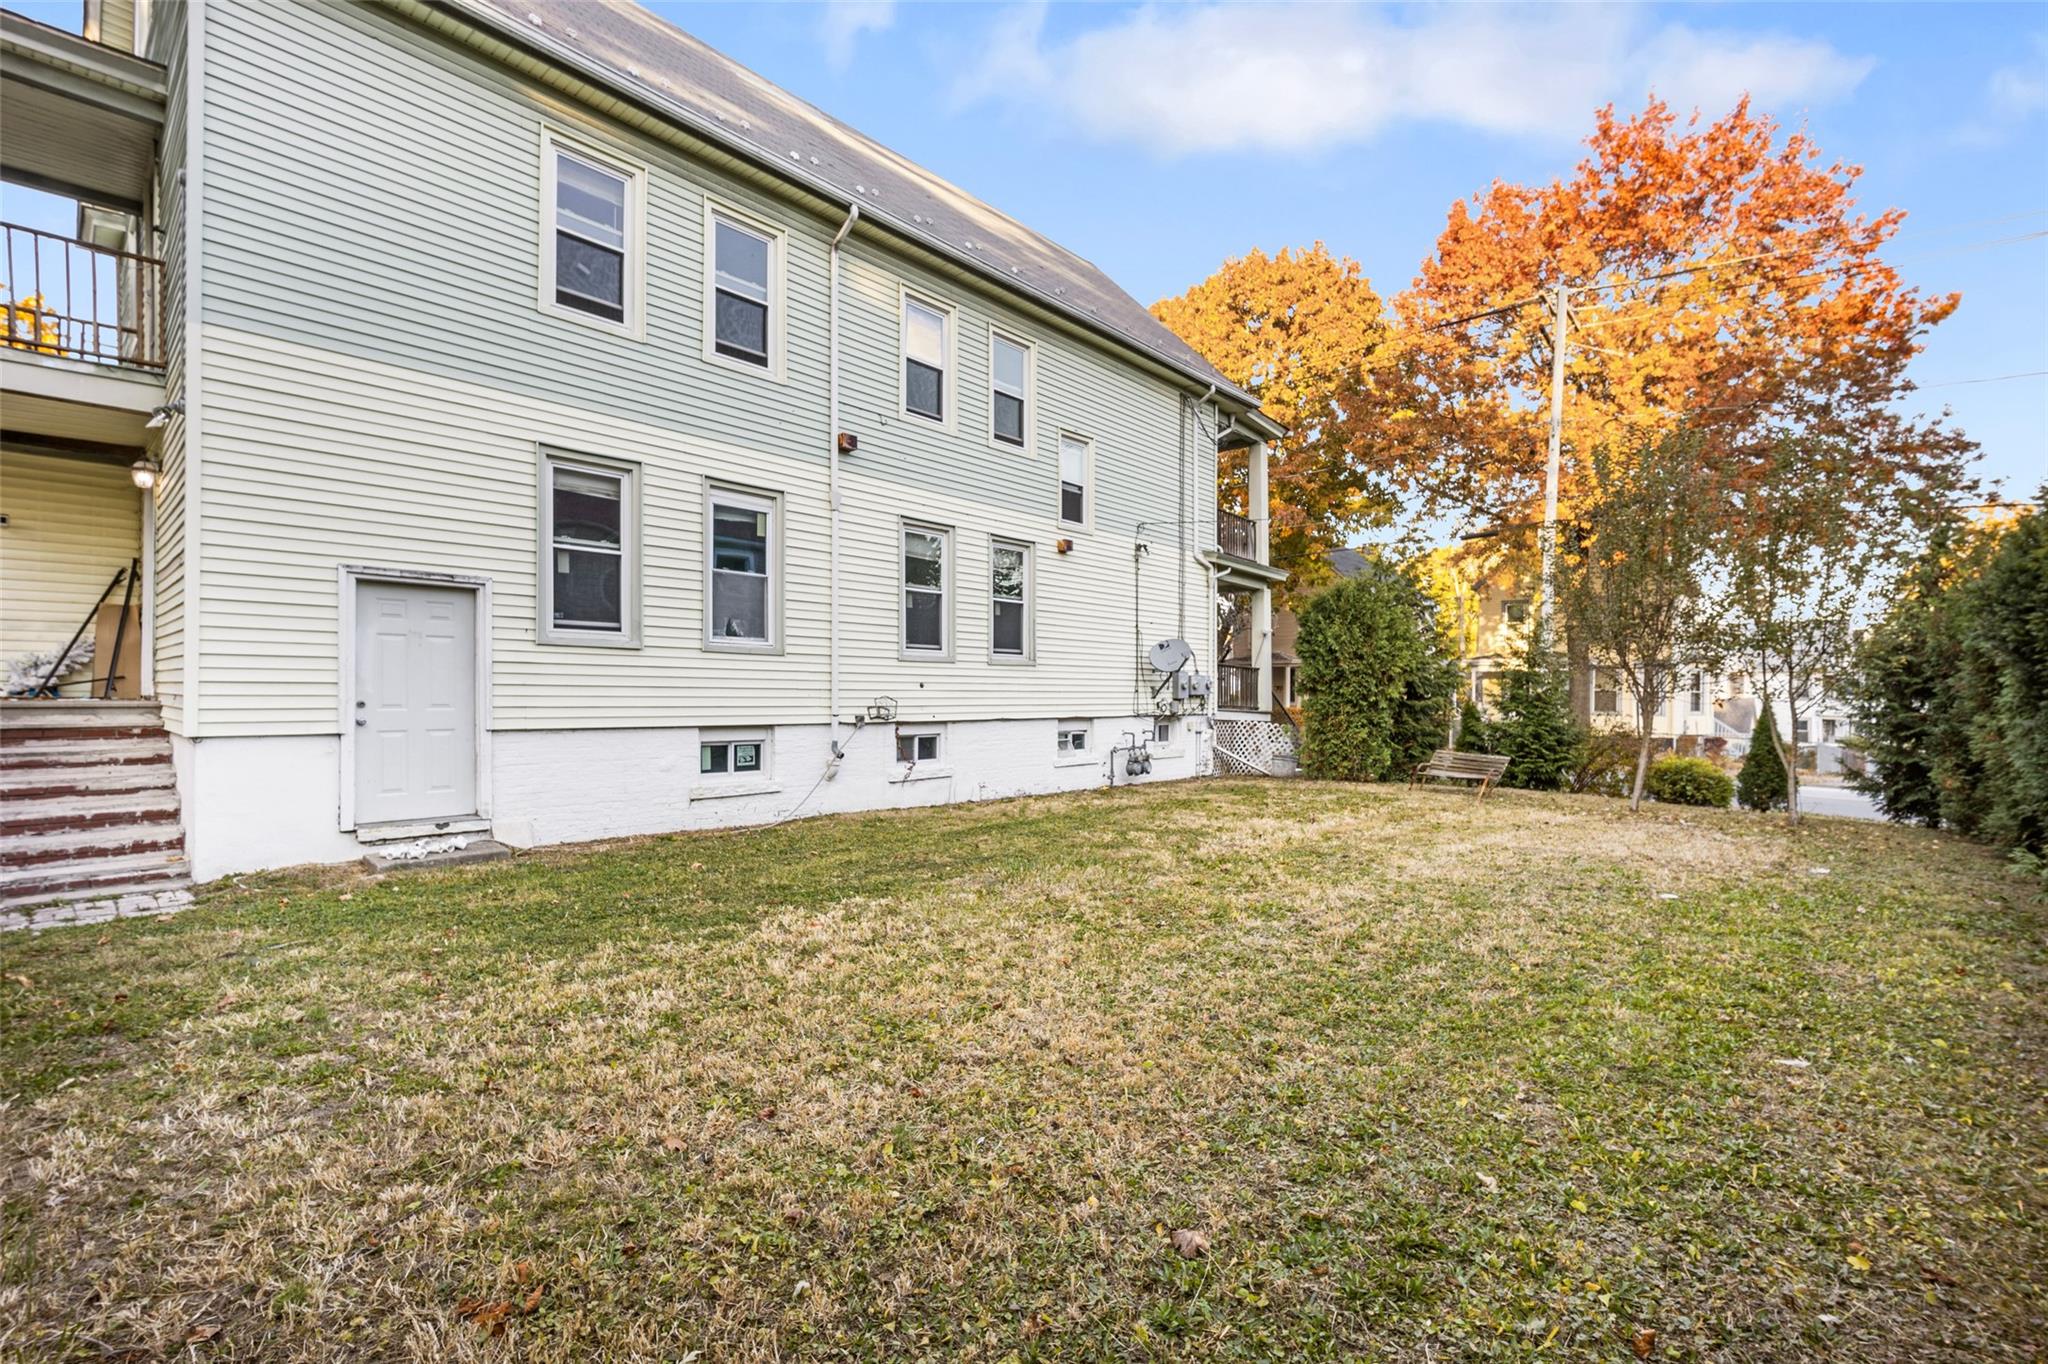
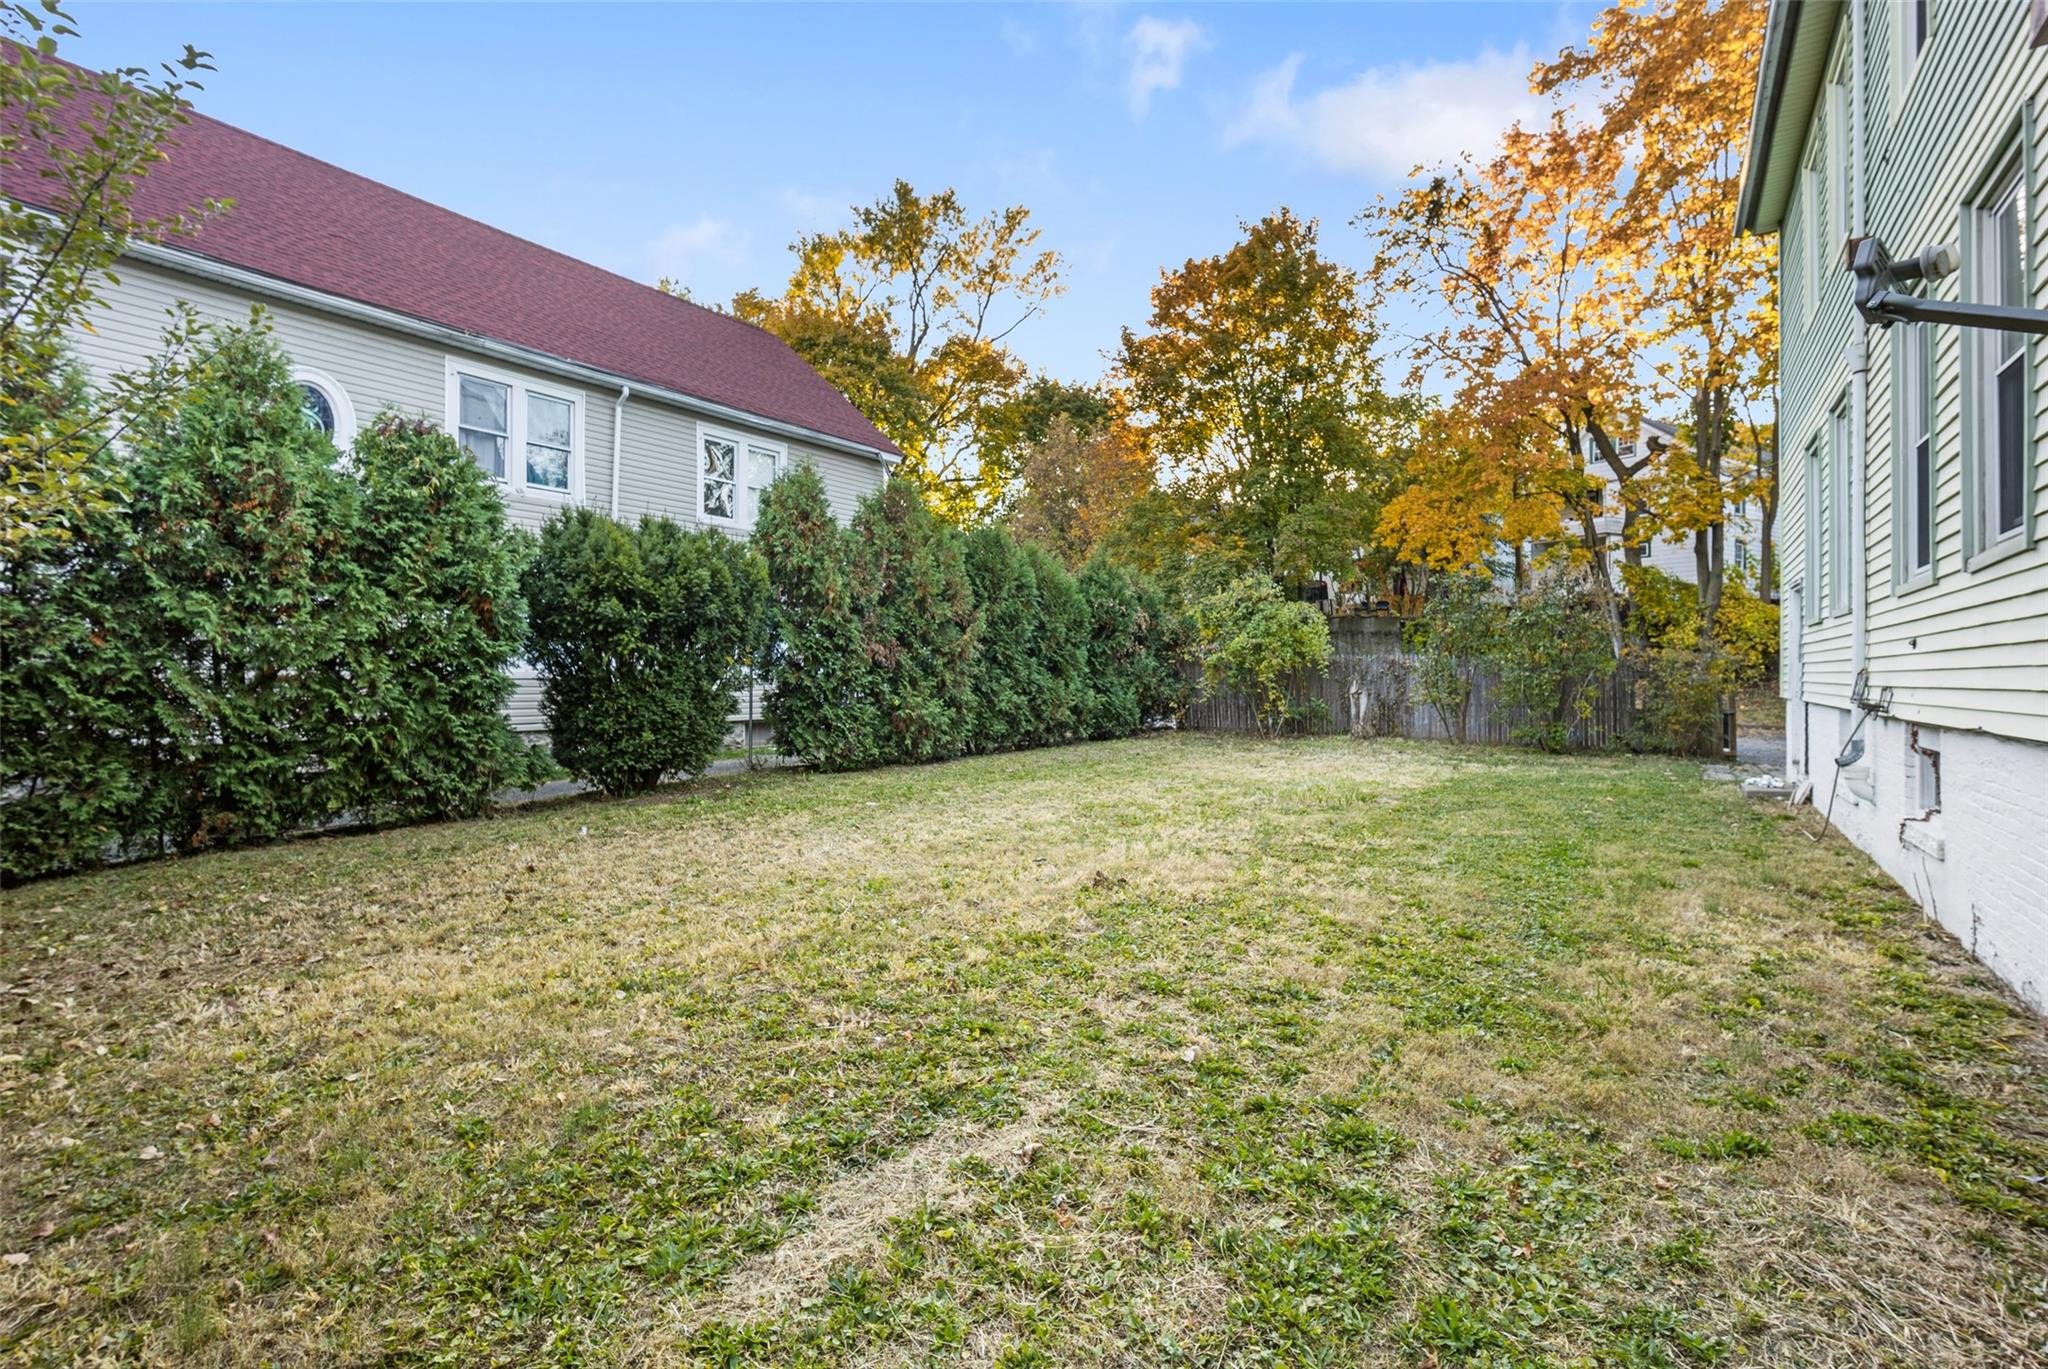
Property Description
PRIME 2-FAMILY INVESTMENT offers a Epic Opportunity for passive income or leverage into commercial. This 2-Family investment opportunity is sited on a huge double lot just shy of a quarter of an acre on the south side of Poughkeepsie. Perfect for the Owner Investor who lives in one unit while the rental income pays your mortgage. Unique property features that add value include private off street oversized parking lot for 8+ cars behind the home; private recessed driveway with gate on the left side of the Duplex could qualify for college housing and 12’ privacy evergreens with rare XL yard and additional green space behind the parking lot awaiting your vision of a greenhouse, hobby shed or additional parking spaces. This 6 bedroom 2 full bathrooms 2 kitchens 2508SF of living space, 1254SF of rentable attic non-living storage space. Total approximate square footage 5,016SF Easy conversion to 3-family passive income by converting attic into Studio/Loft or LEVERAGE into COMMERCIAL by expanding the building footprint constructing an addition onto the left side of the building adding more units (studios)The proposed expansion could be contained within the green buildable lot utilizing the pre-existing front and rear building envelope which would not interfere with the rear parking lot. Perfect for the builder or developer looking for land with built in infrastructure. Infinite options to GO BIG you won't regret adding this workhorse to your portfolio. Municipal gas water and sewer. Hardwood floors, 2019 new fence, 2018 new windows & attic insulation 2024 Taxes $12,582. Apartment A 4Bed/1Bath Apartment w/front porch; Apt B 2Bed/1Bath w/ front balcony sunroom 1254SF. Full walk up Attic/Loft/Studio 1254SF if rentable storage space Full walk out Basement with side entry door 1254SF has electric dryer hook up new mechanicals electric panels in 2015 Cute cherry blossom tree lined Street. Unlimited potential with something for everyone so don’t miss out FIRST TIME HOMEBUYERS as this homestead could seed your retirement fund! Highest and best use commercial redevelopment. Close to Rt#9, Hudson Valley Historical Attractions, Recreational Amenities, Culinary & Distillery Experiences, Vassar, Marist College and two Hospitals Buyers Choice: Own and occupy as landlord 2-Family passive income as investor 3-Family w/ converted attic loft studio as builder 6+Commercial as developer
Build Your Team
Quickly find investor-friendly professionals who can help you succeed in real estate investing at any stage of the investing journey.


Agents
Match with investor-friendly agents who can help you find, analyze, and close your next deal


Lenders
Get the best funding…find investor-friendly lenders who specialize in your deal strategy


Property Managers
Transition to passive investing. Find a trusted property management partnership that lasts.


Tax Pros & Accountants
Taxes and financial reporting made easy—find experts to create tax savings strategies, file taxes, and more
Location
Property Details
Parking
- Description: 2 Cars, Off Street
- Details: Driveway, Oversized, Parking Lot, Private
- Garage Spaces: 0
- Spaces Total: 0
Bedroom Information
- # of Bedrooms: 6
Bathroom Information
- # of Baths (Full): 2
- # of Baths (Total): 2.0
Interior Features
- # of Stories: 2
- Basement: Yes
- Basement Description: Full, Storage Space, Walk-Out Access
Exterior Features
- Exterior Walls Materials: Wood
Land Information
- Land Use: Residential Income
- Land Use Subtype: Duplex
Lot Information
- Parcel ID: 1313006161313148700000
- Lot Size: 10019 sqft
Property Information
- Property Type: Duplex
- Year Built: 1920
Tax Information
- Annual Tax: $12,582
Utilities
- Water & Sewer: Public
- Heating: Forced Air, Natural Gas
- Cooling: Separate Meters, Wall/Window Unit(s)
Location
- County: Dutchess
Listing Details
Investment Summary
- Monthly Cash Flow
- -$1,751
- Cap Rate
- 1.7%
- Cash-on-Cash Return
- -19.0%
- Debt Coverage Ratio
- 0.28
- Internal Rate of Return (5 years)
- -14.4%
Cash Flow
Net Operating Income (NOI) minus mortgage payments.
Calculation:
NOI - Mortgage Payments
Cap Rate (Market Value)
Capitalization Rate is a rate of return that compares the yearly Net Operating Income (NOI) to the market value.
Calculation:
NOI / Market Value
Cash-on-Cash Return (CoC)
Annual Cash Flow / Cash Invested
Calculation:
Annual cash flow divided by initial cash invested.
Debt Coverage Ratio (DCR)
Net Operating Income (NOI) divided by total debt payments.
Calculation:
NOI / Total Debt Payments
Internal Rate of Return (IRR)
A metric for assessing profitability over time. IRR is the discount rate at which the net present value (NPV) of all future cash flows (positive and negative) from an investment equals zero — including both periodic cash flow (such as rent) and a projected sale at the end of the holding period. It represents the expected annualized return, accounting for income, expenses, and the recovery of capital through a future sale.
Purchase Details
Purchase PriceThe price paid for the property. Purchase price:
| $479,999 |
|---|---|
Amount FinancedThe amount of the purchase financed through a loan. Amount financed:
| -$383,999 |
Down paymentThe initial payment made towards the purchase. Down payment:
| $96,000 |
Closing CostsFees and expenses associated with purchasing a property, typically ranging from 2% to 5% of the home’s purchase price, paid at the end of a home purchase to cover services like lending, title transfer, and taxes. Closing costs:
| $14,400 |
Rehab CostsCosts incurred to repair or improve the property, including: roof, flooring, exterior siding, kitchen, exterior paint, bathrooms, etc. Rehab costs:
| $0 |
Initial Cash InvestedThe total initial cash invested in the property. Calculation:Down payment + Buying costs + Rehab costs Initial cash invested:
| $110,400 |
Square Feet (SQFT)The total square footage of the property. Square feet:
| 0 |
Cost Per Square FootCost per square foot of the property. Calculation:Purchase Price / Square Feet Cost per square foot:
| n/a |
Monthly Rent Per Square FootMonthly rent divided by the number of square feet. This ratio helps investors compare rental income efficiency across properties, markets, and unit sizes Calculation:Monthly Rent / Square Feet Monthly rent per square foot:
| n/a |
Financing Details
Loan AmountThe total sum of money borrowed from a lender to finance a property purchase. Calculation:Purchase Price - Down Payment
Loan amount:
| $383,999 |
|---|---|
Loan to Value Ratio (LTV)Loan amount divided by the market value of the property. Calculation:Loan Amount / Market Value
Loan to value ratio:
| 80.0% |
Loan TypeThe type of loan (e.g., fixed, adjustable).
Loan type:
| Amortizing |
TermThe loan repayment period in years.
Term:
| 30 years |
Interest RateThe percentage a lender charges on the borrowed amount of a loan, determining the cost of borrowing money.
Interest rate:
| 6.500% |
Principal & Interest (PI)The principal is the portion of the loan payment that reduces the loan balance. The interest is the lender's charge for borrowing money. Calculation:(P * r * (1 + r) ** n) / ((1 + r) ** n - 1) Where:
P = Loan amount (principal)
Principal & interest:
| $2,427 |
Property TaxesAnnual taxes levied by local governments on real estate properties. These taxes fund public services like schools, roads, and emergency services.
Property tax:
| $1,049 |
InsuranceThe costs for insurance coverage to protect against financial losses due to risks like fire, natural disasters, theft, liability, or tenant-related damages. Calculation:Assumes 7% of gross rental income, unless insurance rates are specified.
Insurance:
| $175 |
Private Mortgage Insurance (PMI)A fee that borrowers pay when they take out a conventional loan with a loan-to-value (LTV) ratio above 80%.
Private mortgage insurance (PMI):
| $0 |
Monthly PaymentThe fixed amount a borrower pays each month to repay a loan. It typically includes principal and interest (P&I) and may also cover property taxes, insurance, HOA fees, and PMI if escrowed. Monthly payment:
| $3,651 |
Operating Income
| % Rent | Monthly | Yearly | |
|---|---|---|---|
Gross RentThe total rental income received from tenants before deducting any expenses. Includes base rent, late fees, pet fees, parking fees, and other recurring charges.
Gross rent:
| $2,500 | $30,000 | |
Vacancy LossExpected loss of rent due to vacancies.
Vacancy loss:
(6%)
| 6% | -$150 | -$1,800 |
Operating IncomeGross rental income minus vacancy loss. Calculation:Gross rent - Vacancy loss
Operating income:
| $2,350 | $28,200 |
Operating Expenses
| % Rent | Monthly | Yearly | |
|---|---|---|---|
Property TaxesAnnual taxes levied by local governments on real estate properties. These taxes fund public services like schools, roads, and emergency services. | 42% | -$1,049 | -$12,582 |
InsuranceThe costs for insurance coverage to protect against financial losses due to risks like fire, natural disasters, theft, liability, or tenant-related damages. Calculation:Assumes 7% of gross rental income, unless insurance rates are specified. | 7% | -$175 | -$2,100 |
Property ManagementThe costs associated with hiring a property manager to handle the day-to-day operations of a rental property. Includes management fees, leasing fes, eviction fees, etc. Calculation:Assumes 8% of gross rental income. | 8% | -$200 | -$2,400 |
Repairs & MaintenanceOngoing costs for routine upkeep and minor fixes needed to keep a property in good working condition. Calculation:Assumes 5% of gross rental income. Varies by property age and condition. | 5% | -$125 | -$1,500 |
Capital ExpensesLarge, infrequent costs for major improvements or replacements, like a new roof, HVAC system, or appliances. Calculation:Assumes 5% of gross rental income. Varies by property age. | 5% | -$125 | -$1,500 |
HOA FeesRegular dues paid to a Homeowners Association for community maintenance, amenities, and management. Similar fees include: Condo Association Fees, Co-op Maintenance Fees, etc. | n/a | n/a | n/a |
Operating ExpensesRecurring costs required to maintain and manage a rental property, including property taxes, insurance, maintenance, repairs, utilities (if paid by the owner), property management fees, and other day-to-day expenses. Calculation:Insurance + Property Taxes + Property Management + Repairs & Maintenance + Capital Expenditures + HOA Fees | 67% | -$1,674 | -$20,082 |
Cash Flow
| Monthly | Yearly | |
|---|---|---|
Net Operating Income (NOI)The income generated from a property after deducting all operating expenses but before deducting mortgage payments, taxes, and capital expenditures. Calculation:Gross Operating Income - Operating Expenses
Net operating income:
| $676 | $8,112 |
Mortgage PaymentThe fixed amount a borrower pays each month to repay a loan. It typically includes principal and interest (P&I) and may also cover property taxes, insurance, HOA fees, and PMI if escrowed. | -$2,427 | -$29,124 |
Cash FlowNet Operating Income (NOI) minus mortgage payments. Calculation:NOI - Mortgage Payments | $1,751 | $21,012 |