$775,000
Investment Summary
We noticed that HOA fees are missing—this is a standard expense and should be considered in your estimate.
- Monthly Cash Flow
- -$1,531
- Cap Rate
- 3.8%
- Cash-on-Cash Return
- -10.3%
- Debt Coverage Ratio
- 0.61
- Internal Rate of Return (5 years)
- -6.0%
Cash Flow
Net Operating Income (NOI) minus mortgage payments.
Calculation:
NOI - Mortgage Payments
Cap Rate (Market Value)
Capitalization Rate is a rate of return that compares the yearly Net Operating Income (NOI) to the market value.
Calculation:
NOI / Market Value
Cash-on-Cash Return (CoC)
Annual Cash Flow / Cash Invested
Calculation:
Annual cash flow divided by initial cash invested.
Debt Coverage Ratio (DCR)
Net Operating Income (NOI) divided by total debt payments.
Calculation:
NOI / Total Debt Payments
Internal Rate of Return (IRR)
A metric for assessing profitability over time. IRR is the discount rate at which the net present value (NPV) of all future cash flows (positive and negative) from an investment equals zero — including both periodic cash flow (such as rent) and a projected sale at the end of the holding period. It represents the expected annualized return, accounting for income, expenses, and the recovery of capital through a future sale.
Property Description
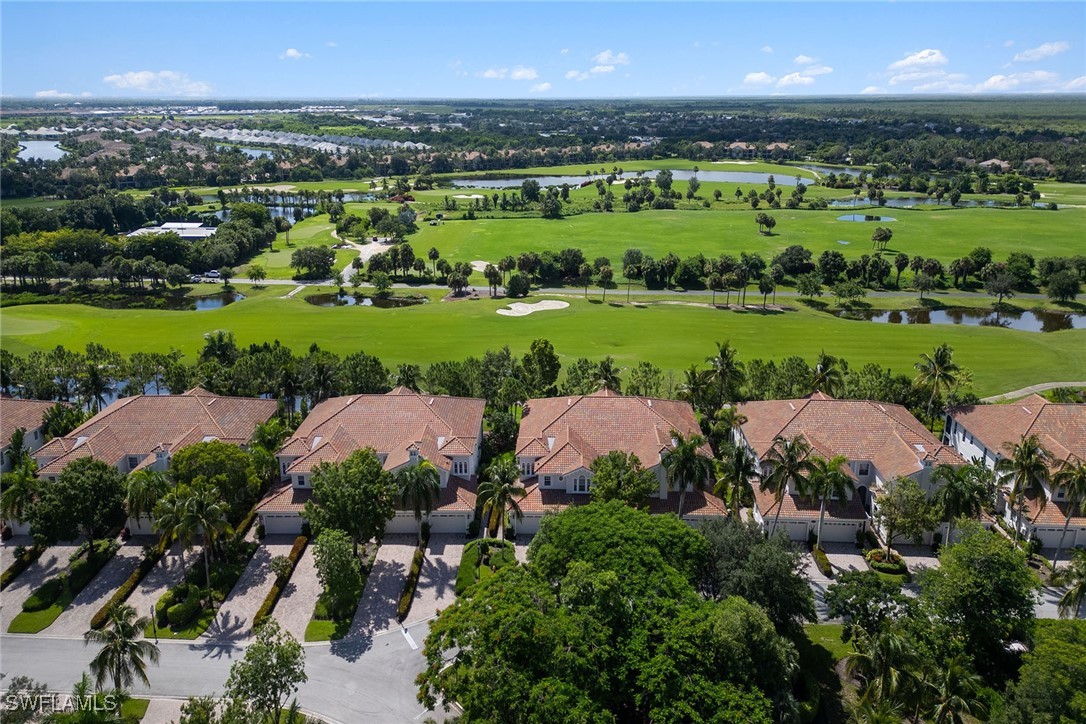
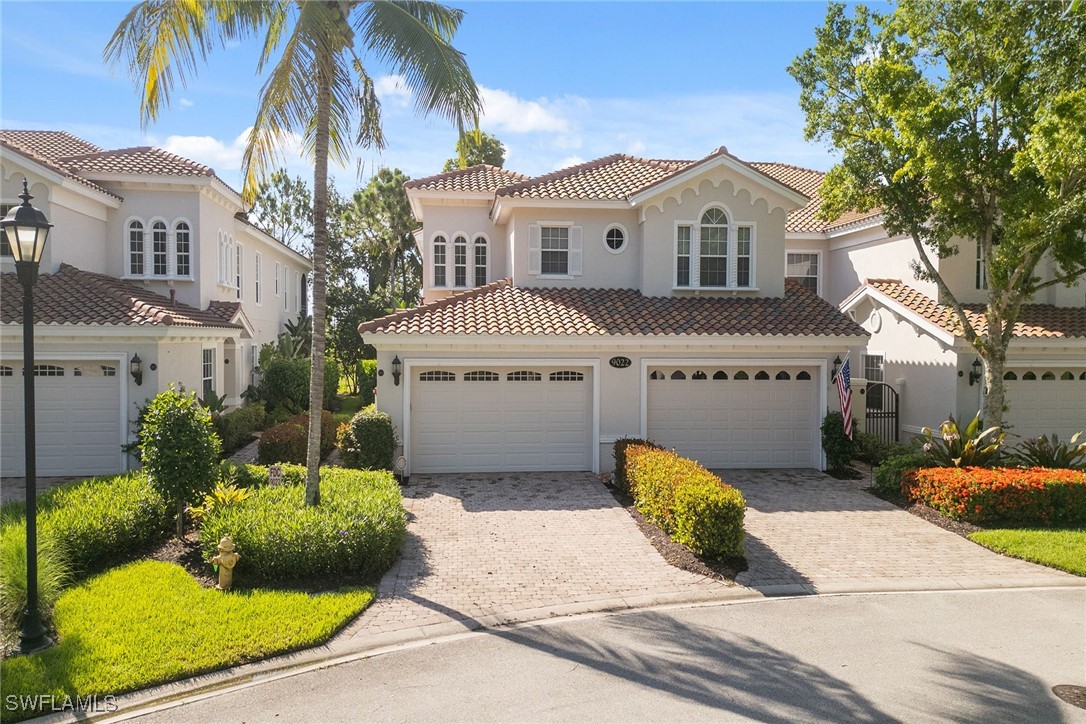
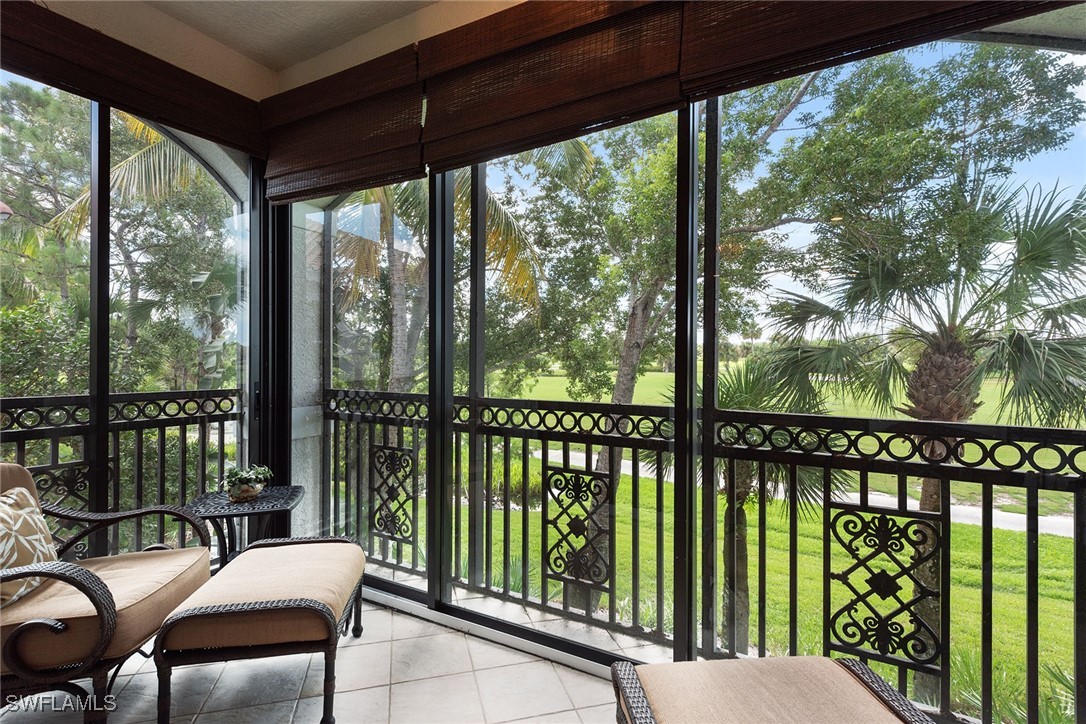
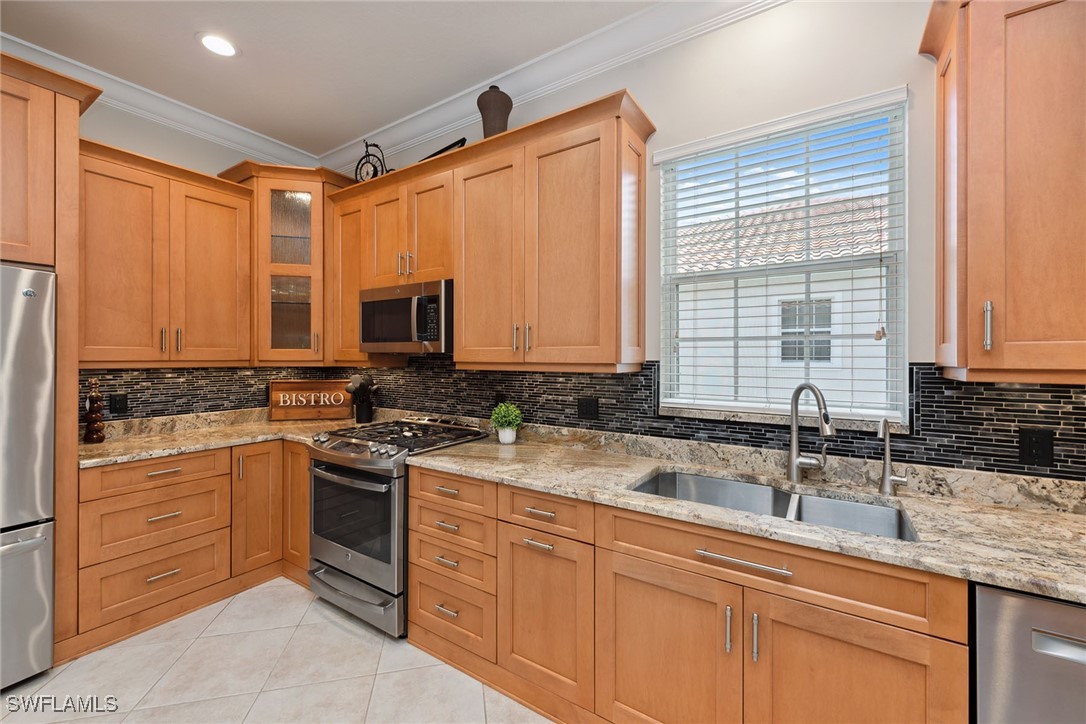
Experience elevated resort-style living in this exquisitely turnkey-furnished second-floor end-unit, in the exclusive double-gated Cascada enclave in Fiddler’s Creek. Spanning 3,010 square feet, this spacious coach home lives like a single-family home and offers three bedrooms plus a study, three full baths and an attached two-car garage—all thoughtfully designed for comfort, privacy and low-maintenance luxury. Enjoy sweeping views of The Rookery golf course from the tiled, screened lanai that doubles as a sunroom. Whether sipping morning coffee or enjoying evening cocktails, this serene space is the spot to unwind, with glass sliders that seamlessly blend indoor and outdoor living. The open, split-bedroom floor plan features elegant upgrades throughout, including crown molding, arched doorways, designer light fixtures, recessed lighting and diagonal tile flooring. The gourmet kitchen is a chef’s dream, boasting granite countertops, solid maple cabinetry, under-cabinet lighting, a mosaic tile backsplash, walk-in pantry, breakfast bar and stainless appliances—highlighted by a natural gas cooktop with warming drawer, newer microwave, French door refrigerator and dishwasher. The expansive owner’s suite provides lanai access, two custom walk-in closets and a spa-inspired en-suite bath with dual vanities, full-width mirrors, makeup station, soaking tub, and a frameless glass walk-in shower. The first guest suite offers its own walk-in closet and private en-suite bath with a glass-enclosed shower. A generously sized second guest suite—ideal as a second primary—features its bath with a shower-tub combo. Double doors open to a spacious study, ideal for a home office or reading retreat. The laundry room is equipped with white cabinetry, a utility sink, and Samsung front-load washer and dryer. Additional upgrades include a 2022 tankless water heater and a built-in shaft for an optional private elevator. A fully paid CDD bond adds even more value. Residents of Fiddler’s Creek enjoy world-class amenities, including a 54,000-square-foot clubhouse, resort-style pool with food and beverage service, fitness center with classes and personal training, spa services, active tennis and pickleball programs, bocce, steam and sauna rooms, and multiple on-site dining venues. An extensive calendar of classes, clubs and social events ensures there's always something to enjoy. Optional memberships provide access to the newly renovated Creek Course and a spectacular new golf clubhouse, beach club privileges and marina services. Ideally between Marco Island’s white sand beaches and the cultural and culinary delights of downtown Naples, this home offers effortless access to boating, paddleboarding, nature parks, fine dining, boutique shopping and a nearby executive airport. Don’t miss this rare opportunity to own a move-in ready home in one of Southwest Florida’s sought-after communities.
Build Your Team
Quickly find investor-friendly professionals who can help you succeed in real estate investing at any stage of the investing journey.


Agents
Match with investor-friendly agents who can help you find, analyze, and close your next deal


Lenders
Get the best funding…find investor-friendly lenders who specialize in your deal strategy


Property Managers
Transition to passive investing. Find a trusted property management partnership that lasts.


Tax Pros & Accountants
Taxes and financial reporting made easy—find experts to create tax savings strategies, file taxes, and more
Location
Property Details
Parking
- Details: Attached, Garage, Paved, Garage Door Opener
- Garage Spaces: 2
- Spaces Total: 0
Bedroom Information
- # of Bedrooms: 3
Bathroom Information
- # of Baths (Full): 3
- # of Baths (Total): 3.0
Interior Features
- # of Rooms: 10
- # of Stories: 2
Exterior Features
- Roof Material: Tile
Land Information
- Land Use: Residential
- Land Use Subtype: Condominium Unit
Lot Information
- Parcel ID: 25600101889
- Lot Size: 0 sqft
Property Information
- Property Type: Condominium
- Style: Contemporary, Low Rise
- Year Built: 2002
Tax Information
- Annual Tax: $8,813
Utilities
- Water & Sewer: Public
- Heating: Central, Electric
- Cooling: Central Air, Ceiling Fan(s), Electric
Location
- County: Collier
Listing Details
Investment Summary
We noticed that HOA fees are missing—this is a standard expense and should be considered in your estimate.
- Monthly Cash Flow
- -$1,531
- Cap Rate
- 3.8%
- Cash-on-Cash Return
- -10.3%
- Debt Coverage Ratio
- 0.61
- Internal Rate of Return (5 years)
- -6.0%
Cash Flow
Net Operating Income (NOI) minus mortgage payments.
Calculation:
NOI - Mortgage Payments
Cap Rate (Market Value)
Capitalization Rate is a rate of return that compares the yearly Net Operating Income (NOI) to the market value.
Calculation:
NOI / Market Value
Cash-on-Cash Return (CoC)
Annual Cash Flow / Cash Invested
Calculation:
Annual cash flow divided by initial cash invested.
Debt Coverage Ratio (DCR)
Net Operating Income (NOI) divided by total debt payments.
Calculation:
NOI / Total Debt Payments
Internal Rate of Return (IRR)
A metric for assessing profitability over time. IRR is the discount rate at which the net present value (NPV) of all future cash flows (positive and negative) from an investment equals zero — including both periodic cash flow (such as rent) and a projected sale at the end of the holding period. It represents the expected annualized return, accounting for income, expenses, and the recovery of capital through a future sale.
Purchase Details
Purchase PriceThe price paid for the property. Purchase price:
| $775,000 |
|---|---|
Amount FinancedThe amount of the purchase financed through a loan. Amount financed:
| -$620,000 |
Down paymentThe initial payment made towards the purchase. Down payment:
| $155,000 |
Closing CostsFees and expenses associated with purchasing a property, typically ranging from 2% to 5% of the home’s purchase price, paid at the end of a home purchase to cover services like lending, title transfer, and taxes. Closing costs:
| $23,250 |
Rehab CostsCosts incurred to repair or improve the property, including: roof, flooring, exterior siding, kitchen, exterior paint, bathrooms, etc. Rehab costs:
| $0 |
Initial Cash InvestedThe total initial cash invested in the property. Calculation:Down payment + Buying costs + Rehab costs Initial cash invested:
| $178,250 |
Square Feet (SQFT)The total square footage of the property. Square feet:
| 3,010 |
Cost Per Square FootCost per square foot of the property. Calculation:Purchase Price / Square Feet Cost per square foot:
| $257 |
Monthly Rent Per Square FootMonthly rent divided by the number of square feet. This ratio helps investors compare rental income efficiency across properties, markets, and unit sizes Calculation:Monthly Rent / Square Feet Monthly rent per square foot:
| $1.53 |
Financing Details
Loan AmountThe total sum of money borrowed from a lender to finance a property purchase. Calculation:Purchase Price - Down Payment
Loan amount:
| $620,000 |
|---|---|
Loan to Value Ratio (LTV)Loan amount divided by the market value of the property. Calculation:Loan Amount / Market Value
Loan to value ratio:
| 80.0% |
Loan TypeThe type of loan (e.g., fixed, adjustable).
Loan type:
| Amortizing |
TermThe loan repayment period in years.
Term:
| 30 years |
Interest RateThe percentage a lender charges on the borrowed amount of a loan, determining the cost of borrowing money.
Interest rate:
| 6.625% |
Principal & Interest (PI)The principal is the portion of the loan payment that reduces the loan balance. The interest is the lender's charge for borrowing money. Calculation:(P * r * (1 + r) ** n) / ((1 + r) ** n - 1) Where:
P = Loan amount (principal)
Principal & interest:
| $3,970 |
Property TaxesAnnual taxes levied by local governments on real estate properties. These taxes fund public services like schools, roads, and emergency services.
Property tax:
| $735 |
InsuranceThe costs for insurance coverage to protect against financial losses due to risks like fire, natural disasters, theft, liability, or tenant-related damages. Calculation:Assumes 7% of gross rental income, unless insurance rates are specified.
Insurance:
| $322 |
Private Mortgage Insurance (PMI)A fee that borrowers pay when they take out a conventional loan with a loan-to-value (LTV) ratio above 80%.
Private mortgage insurance (PMI):
| $0 |
Monthly PaymentThe fixed amount a borrower pays each month to repay a loan. It typically includes principal and interest (P&I) and may also cover property taxes, insurance, HOA fees, and PMI if escrowed. Monthly payment:
| $5,027 |
Operating Income
| % Rent | Monthly | Yearly | |
|---|---|---|---|
Gross RentThe total rental income received from tenants before deducting any expenses. Includes base rent, late fees, pet fees, parking fees, and other recurring charges.
Gross rent:
| $4,600 | $55,200 | |
Vacancy LossExpected loss of rent due to vacancies.
Vacancy loss:
(6%)
| 6% | -$276 | -$3,312 |
Operating IncomeGross rental income minus vacancy loss. Calculation:Gross rent - Vacancy loss
Operating income:
| $4,324 | $51,888 |
Operating Expenses
| % Rent | Monthly | Yearly | |
|---|---|---|---|
Property TaxesAnnual taxes levied by local governments on real estate properties. These taxes fund public services like schools, roads, and emergency services. | 16% | -$735 | -$8,814 |
InsuranceThe costs for insurance coverage to protect against financial losses due to risks like fire, natural disasters, theft, liability, or tenant-related damages. Calculation:Assumes 7% of gross rental income, unless insurance rates are specified. | 7% | -$322 | -$3,864 |
Property ManagementThe costs associated with hiring a property manager to handle the day-to-day operations of a rental property. Includes management fees, leasing fes, eviction fees, etc. Calculation:Assumes 8% of gross rental income. | 8% | -$368 | -$4,416 |
Repairs & MaintenanceOngoing costs for routine upkeep and minor fixes needed to keep a property in good working condition. Calculation:Assumes 5% of gross rental income. Varies by property age and condition. | 5% | -$230 | -$2,760 |
Capital ExpensesLarge, infrequent costs for major improvements or replacements, like a new roof, HVAC system, or appliances. Calculation:Assumes 5% of gross rental income. Varies by property age. | 5% | -$230 | -$2,760 |
HOA FeesRegular dues paid to a Homeowners Association for community maintenance, amenities, and management. Similar fees include: Condo Association Fees, Co-op Maintenance Fees, etc. | n/a | n/a | n/a |
Operating ExpensesRecurring costs required to maintain and manage a rental property, including property taxes, insurance, maintenance, repairs, utilities (if paid by the owner), property management fees, and other day-to-day expenses. Calculation:Insurance + Property Taxes + Property Management + Repairs & Maintenance + Capital Expenditures + HOA Fees | 41% | -$1,885 | -$22,614 |
Cash Flow
| Monthly | Yearly | |
|---|---|---|
Net Operating Income (NOI)The income generated from a property after deducting all operating expenses but before deducting mortgage payments, taxes, and capital expenditures. Calculation:Gross Operating Income - Operating Expenses
Net operating income:
| $2,439 | $29,268 |
Mortgage PaymentThe fixed amount a borrower pays each month to repay a loan. It typically includes principal and interest (P&I) and may also cover property taxes, insurance, HOA fees, and PMI if escrowed. | -$3,970 | -$47,640 |
Cash FlowNet Operating Income (NOI) minus mortgage payments. Calculation:NOI - Mortgage Payments | $1,531 | $18,372 |