$825,000
Investment Summary
- Monthly Cash Flow
- -$2,285
- Cap Rate
- 2.4%
- Cash-on-Cash Return
- -14.5%
- Debt Coverage Ratio
- 0.41
- Internal Rate of Return (5 years)
- -10.0%
Cash Flow
Net Operating Income (NOI) minus mortgage payments.
Calculation:
NOI - Mortgage Payments
Cap Rate (Market Value)
Capitalization Rate is a rate of return that compares the yearly Net Operating Income (NOI) to the market value.
Calculation:
NOI / Market Value
Cash-on-Cash Return (CoC)
Annual Cash Flow / Cash Invested
Calculation:
Annual cash flow divided by initial cash invested.
Debt Coverage Ratio (DCR)
Net Operating Income (NOI) divided by total debt payments.
Calculation:
NOI / Total Debt Payments
Internal Rate of Return (IRR)
A metric for assessing profitability over time. IRR is the discount rate at which the net present value (NPV) of all future cash flows (positive and negative) from an investment equals zero — including both periodic cash flow (such as rent) and a projected sale at the end of the holding period. It represents the expected annualized return, accounting for income, expenses, and the recovery of capital through a future sale.
Property Description
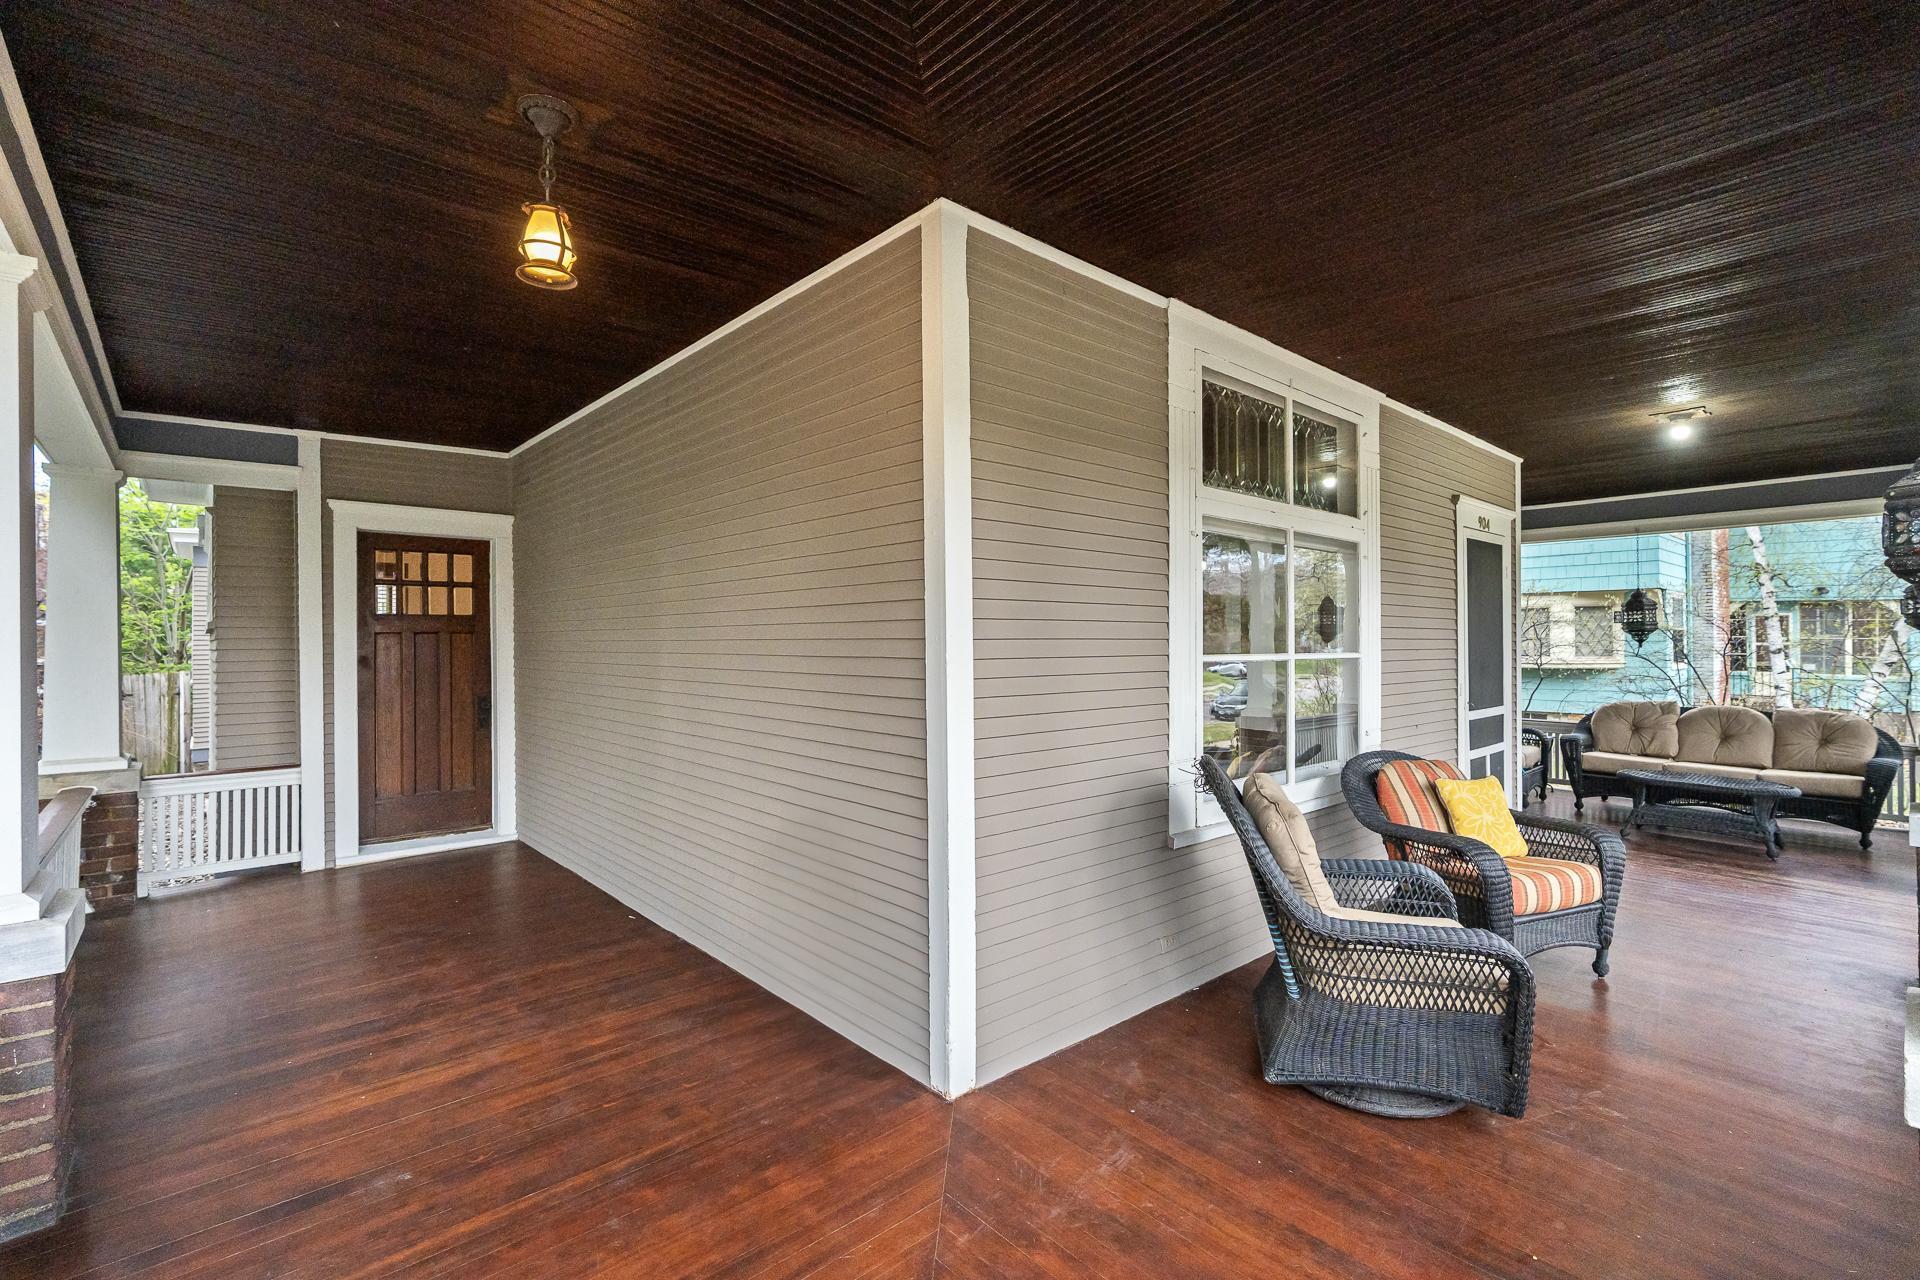
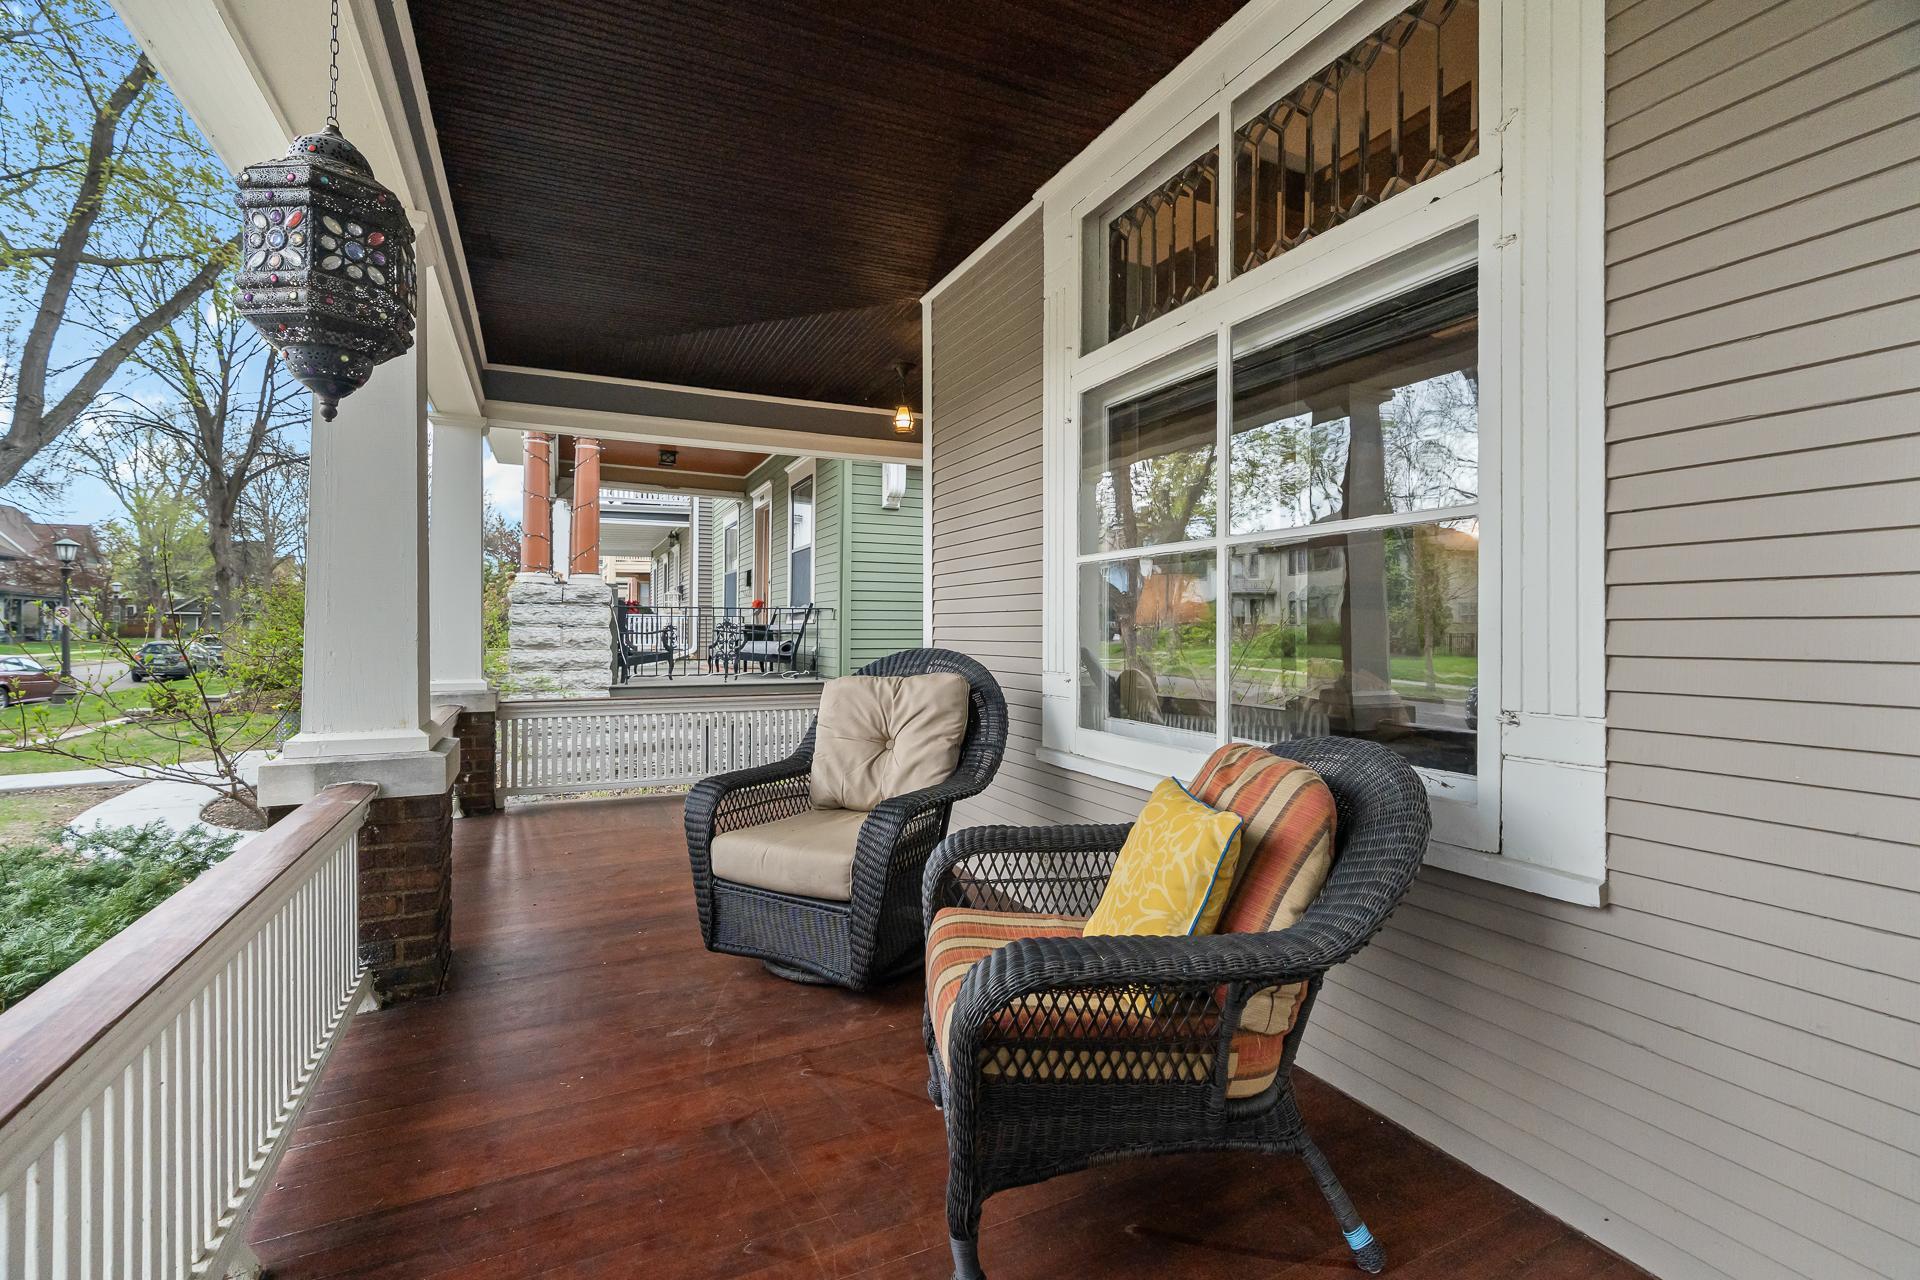
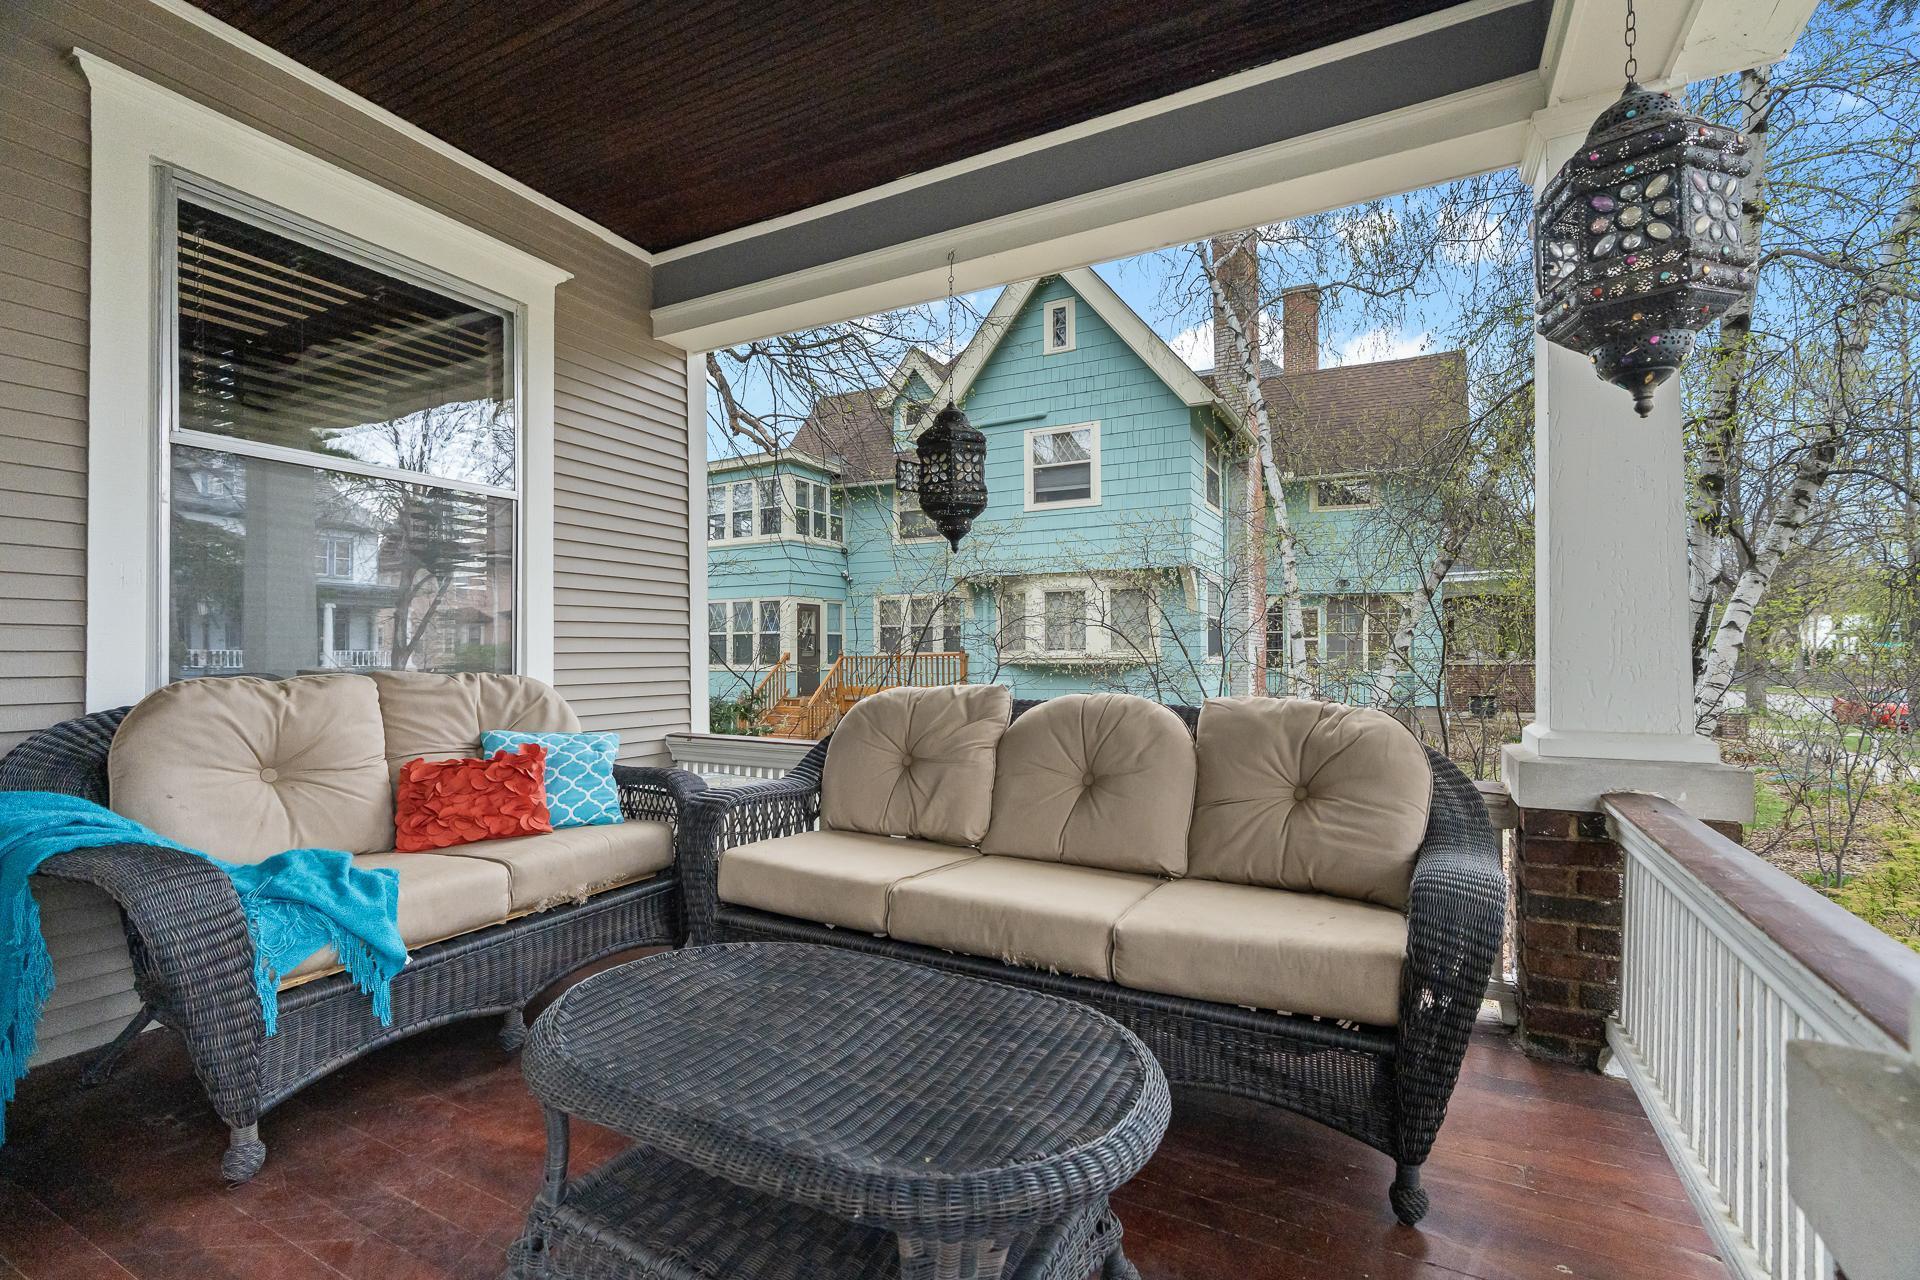
Stunning Summit Hill Classic with Modern Touches & Exceptional Character! Nestled in the heart of the highly sought-after Summit Hill neighborhood, this gorgeous and spacious home perfectly blends timeless charm with thoughtful updates. From the moment you step onto the beautiful wraparound porch and into the charming vestibule, you’re welcomed into a grand foyer showcasing impeccable original millwork and a stunning staircase that gracefully ascends to the upper level—a true statement of craftsmanship and elegance. Inside, the main level features original hardwood floors and millwork that are truly second to none. The living room boasts coffered ceilings, a brick wood-burning fireplace, and a gorgeous leaded glass transom window overlooking the porch. The adjacent formal dining room is equally breathtaking, with a coffered ceiling, exquisite built-in buffet with leaded glass-front cabinets, and elegant chandeliers adding a touch of vintage glam. Just off the dining room, a cozy den with original hardwoods and another coffered ceiling leads to a beautifully updated tiled powder room. The kitchen has been tastefully modernized with maple cabinetry, granite countertops, stainless steel appliances, a spacious center island, and a sunny informal dining area. A true hidden gem on the main floor is the slate-finished wine cellar—stylish and sophisticated. Tucked discreetly within this space is a secondary staircase that leads directly to the upper level, providing a unique and private transition between floors.You will also find a tiled laundry room on the main floor, offering nice cabinet storage, granite countertops and a laundry tub. Upstairs, you’ll find five bedrooms, each with hardwood floors and ample closet/storage space. The luxurious primary suite features two closets, a versatile sitting area, and a discreet closeted staircase leading to a large 27x14 upper-level expansion area—ideal for a studio, home gym, playroom, or future living space- easy opportunity for add'l sq footage. The second floor also offers a fully tiled bath and a stunning fifth bedroom enclosed by walls of glass—an inspiring space perfect for a sunroom, den, or office. The finished lower level includes stained glossy concrete floors, a spacious family/game room with a wet bar, a private office space, a stylish three-quarter bath with a sauna, and plenty of storage. A walkout staircase leads directly to the private backyard paver patio area which connects the home to the two-car carriage house garage. The garage’s upper level is ready for finishing touches—imagine a guest suite, studio, or workshop! Every inch of this home has been lovingly maintained and thoughtfully updated, preserving its incredible architectural integrity while offering modern convenience. This is your chance to own a truly special property in one of St. Paul’s most cherished neighborhoods.
Build Your Team
Quickly find investor-friendly professionals who can help you succeed in real estate investing at any stage of the investing journey.


Agents
Match with investor-friendly agents who can help you find, analyze, and close your next deal


Lenders
Get the best funding…find investor-friendly lenders who specialize in your deal strategy


Property Managers
Transition to passive investing. Find a trusted property management partnership that lasts.


Tax Pros & Accountants
Taxes and financial reporting made easy—find experts to create tax savings strategies, file taxes, and more
Location
Property Details
Parking
- Description: Detached Garage
- Details: Garage Door Opener
- Garage Spaces: 2
- Spaces Total: 0
Bedroom Information
- # of Bedrooms: 5
Bathroom Information
- # of Baths (Full): 2
- # of Baths (Partial): 2
- # of Baths (Total): 4.0
Interior Features
- # of Rooms: 13
- # of Stories: 2
- Basement: Yes
- Basement Description: Finished, Full
- Fireplace: Yes
Exterior Features
- Exterior Walls Materials: Wood
Land Information
- Land Use: Residential
- Land Use Subtype: Single Family Residential
Lot Information
- Parcel ID: 022823310048
- Lot Size: 6098 sqft
Property Information
- Property Type: Single Family Residence
- Style: (SF) Single Family
- Year Built: 1887
Tax Information
- Annual Tax: $13,686
Location
- County: Ramsey
Listing Details
Investment Summary
- Monthly Cash Flow
- -$2,285
- Cap Rate
- 2.4%
- Cash-on-Cash Return
- -14.5%
- Debt Coverage Ratio
- 0.41
- Internal Rate of Return (5 years)
- -10.0%
Cash Flow
Net Operating Income (NOI) minus mortgage payments.
Calculation:
NOI - Mortgage Payments
Cap Rate (Market Value)
Capitalization Rate is a rate of return that compares the yearly Net Operating Income (NOI) to the market value.
Calculation:
NOI / Market Value
Cash-on-Cash Return (CoC)
Annual Cash Flow / Cash Invested
Calculation:
Annual cash flow divided by initial cash invested.
Debt Coverage Ratio (DCR)
Net Operating Income (NOI) divided by total debt payments.
Calculation:
NOI / Total Debt Payments
Internal Rate of Return (IRR)
A metric for assessing profitability over time. IRR is the discount rate at which the net present value (NPV) of all future cash flows (positive and negative) from an investment equals zero — including both periodic cash flow (such as rent) and a projected sale at the end of the holding period. It represents the expected annualized return, accounting for income, expenses, and the recovery of capital through a future sale.
Purchase Details
Purchase PriceThe price paid for the property. Purchase price:
| $825,000 |
|---|---|
Amount FinancedThe amount of the purchase financed through a loan. Amount financed:
| -$660,000 |
Down paymentThe initial payment made towards the purchase. Down payment:
| $165,000 |
Closing CostsFees and expenses associated with purchasing a property, typically ranging from 2% to 5% of the home’s purchase price, paid at the end of a home purchase to cover services like lending, title transfer, and taxes. Closing costs:
| $24,750 |
Rehab CostsCosts incurred to repair or improve the property, including: roof, flooring, exterior siding, kitchen, exterior paint, bathrooms, etc. Rehab costs:
| $0 |
Initial Cash InvestedThe total initial cash invested in the property. Calculation:Down payment + Buying costs + Rehab costs Initial cash invested:
| $189,750 |
Square Feet (SQFT)The total square footage of the property. Square feet:
| 4,380 |
Cost Per Square FootCost per square foot of the property. Calculation:Purchase Price / Square Feet Cost per square foot:
| $188 |
Monthly Rent Per Square FootMonthly rent divided by the number of square feet. This ratio helps investors compare rental income efficiency across properties, markets, and unit sizes Calculation:Monthly Rent / Square Feet Monthly rent per square foot:
| $0.91 |
Financing Details
Loan AmountThe total sum of money borrowed from a lender to finance a property purchase. Calculation:Purchase Price - Down Payment
Loan amount:
| $660,000 |
|---|---|
Loan to Value Ratio (LTV)Loan amount divided by the market value of the property. Calculation:Loan Amount / Market Value
Loan to value ratio:
| 80.0% |
Loan TypeThe type of loan (e.g., fixed, adjustable).
Loan type:
| Amortizing |
TermThe loan repayment period in years.
Term:
| 30 years |
Interest RateThe percentage a lender charges on the borrowed amount of a loan, determining the cost of borrowing money.
Interest rate:
| 5.875% |
Principal & Interest (PI)The principal is the portion of the loan payment that reduces the loan balance. The interest is the lender's charge for borrowing money. Calculation:(P * r * (1 + r) ** n) / ((1 + r) ** n - 1) Where:
P = Loan amount (principal)
Principal & interest:
| $3,904 |
Property TaxesAnnual taxes levied by local governments on real estate properties. These taxes fund public services like schools, roads, and emergency services.
Property tax:
| $1,141 |
InsuranceThe costs for insurance coverage to protect against financial losses due to risks like fire, natural disasters, theft, liability, or tenant-related damages. Calculation:Assumes 7% of gross rental income, unless insurance rates are specified.
Insurance:
| $280 |
Private Mortgage Insurance (PMI)A fee that borrowers pay when they take out a conventional loan with a loan-to-value (LTV) ratio above 80%.
Private mortgage insurance (PMI):
| $0 |
Monthly PaymentThe fixed amount a borrower pays each month to repay a loan. It typically includes principal and interest (P&I) and may also cover property taxes, insurance, HOA fees, and PMI if escrowed. Monthly payment:
| $5,325 |
Operating Income
| % Rent | Monthly | Yearly | |
|---|---|---|---|
Gross RentThe total rental income received from tenants before deducting any expenses. Includes base rent, late fees, pet fees, parking fees, and other recurring charges.
Gross rent:
| $4,000 | $48,000 | |
Vacancy LossExpected loss of rent due to vacancies.
Vacancy loss:
(6%)
| 6% | -$240 | -$2,880 |
Operating IncomeGross rental income minus vacancy loss. Calculation:Gross rent - Vacancy loss
Operating income:
| $3,760 | $45,120 |
Operating Expenses
| % Rent | Monthly | Yearly | |
|---|---|---|---|
Property TaxesAnnual taxes levied by local governments on real estate properties. These taxes fund public services like schools, roads, and emergency services. | 29% | -$1,141 | -$13,686 |
InsuranceThe costs for insurance coverage to protect against financial losses due to risks like fire, natural disasters, theft, liability, or tenant-related damages. Calculation:Assumes 7% of gross rental income, unless insurance rates are specified. | 7% | -$280 | -$3,360 |
Property ManagementThe costs associated with hiring a property manager to handle the day-to-day operations of a rental property. Includes management fees, leasing fes, eviction fees, etc. Calculation:Assumes 8% of gross rental income. | 8% | -$320 | -$3,840 |
Repairs & MaintenanceOngoing costs for routine upkeep and minor fixes needed to keep a property in good working condition. Calculation:Assumes 5% of gross rental income. Varies by property age and condition. | 5% | -$200 | -$2,400 |
Capital ExpensesLarge, infrequent costs for major improvements or replacements, like a new roof, HVAC system, or appliances. Calculation:Assumes 5% of gross rental income. Varies by property age. | 5% | -$200 | -$2,400 |
HOA FeesRegular dues paid to a Homeowners Association for community maintenance, amenities, and management. Similar fees include: Condo Association Fees, Co-op Maintenance Fees, etc. | n/a | n/a | n/a |
Operating ExpensesRecurring costs required to maintain and manage a rental property, including property taxes, insurance, maintenance, repairs, utilities (if paid by the owner), property management fees, and other day-to-day expenses. Calculation:Insurance + Property Taxes + Property Management + Repairs & Maintenance + Capital Expenditures + HOA Fees | 54% | -$2,141 | -$25,686 |
Cash Flow
| Monthly | Yearly | |
|---|---|---|
Net Operating Income (NOI)The income generated from a property after deducting all operating expenses but before deducting mortgage payments, taxes, and capital expenditures. Calculation:Gross Operating Income - Operating Expenses
Net operating income:
| $1,619 | $19,428 |
Mortgage PaymentThe fixed amount a borrower pays each month to repay a loan. It typically includes principal and interest (P&I) and may also cover property taxes, insurance, HOA fees, and PMI if escrowed. | -$3,904 | -$46,848 |
Cash FlowNet Operating Income (NOI) minus mortgage payments. Calculation:NOI - Mortgage Payments | $2,285 | $27,420 |