$2,149,900
Investment Summary
- Monthly Cash Flow
- -$6,024
- Cap Rate
- 2.3%
- Cash-on-Cash Return
- -14.6%
- Debt Coverage Ratio
- 0.41
- Internal Rate of Return (5 years)
- -10.1%
Cash Flow
Net Operating Income (NOI) minus mortgage payments.
Calculation:
NOI - Mortgage Payments
Cap Rate (Market Value)
Capitalization Rate is a rate of return that compares the yearly Net Operating Income (NOI) to the market value.
Calculation:
NOI / Market Value
Cash-on-Cash Return (CoC)
Annual Cash Flow / Cash Invested
Calculation:
Annual cash flow divided by initial cash invested.
Debt Coverage Ratio (DCR)
Net Operating Income (NOI) divided by total debt payments.
Calculation:
NOI / Total Debt Payments
Internal Rate of Return (IRR)
A metric for assessing profitability over time. IRR is the discount rate at which the net present value (NPV) of all future cash flows (positive and negative) from an investment equals zero — including both periodic cash flow (such as rent) and a projected sale at the end of the holding period. It represents the expected annualized return, accounting for income, expenses, and the recovery of capital through a future sale.
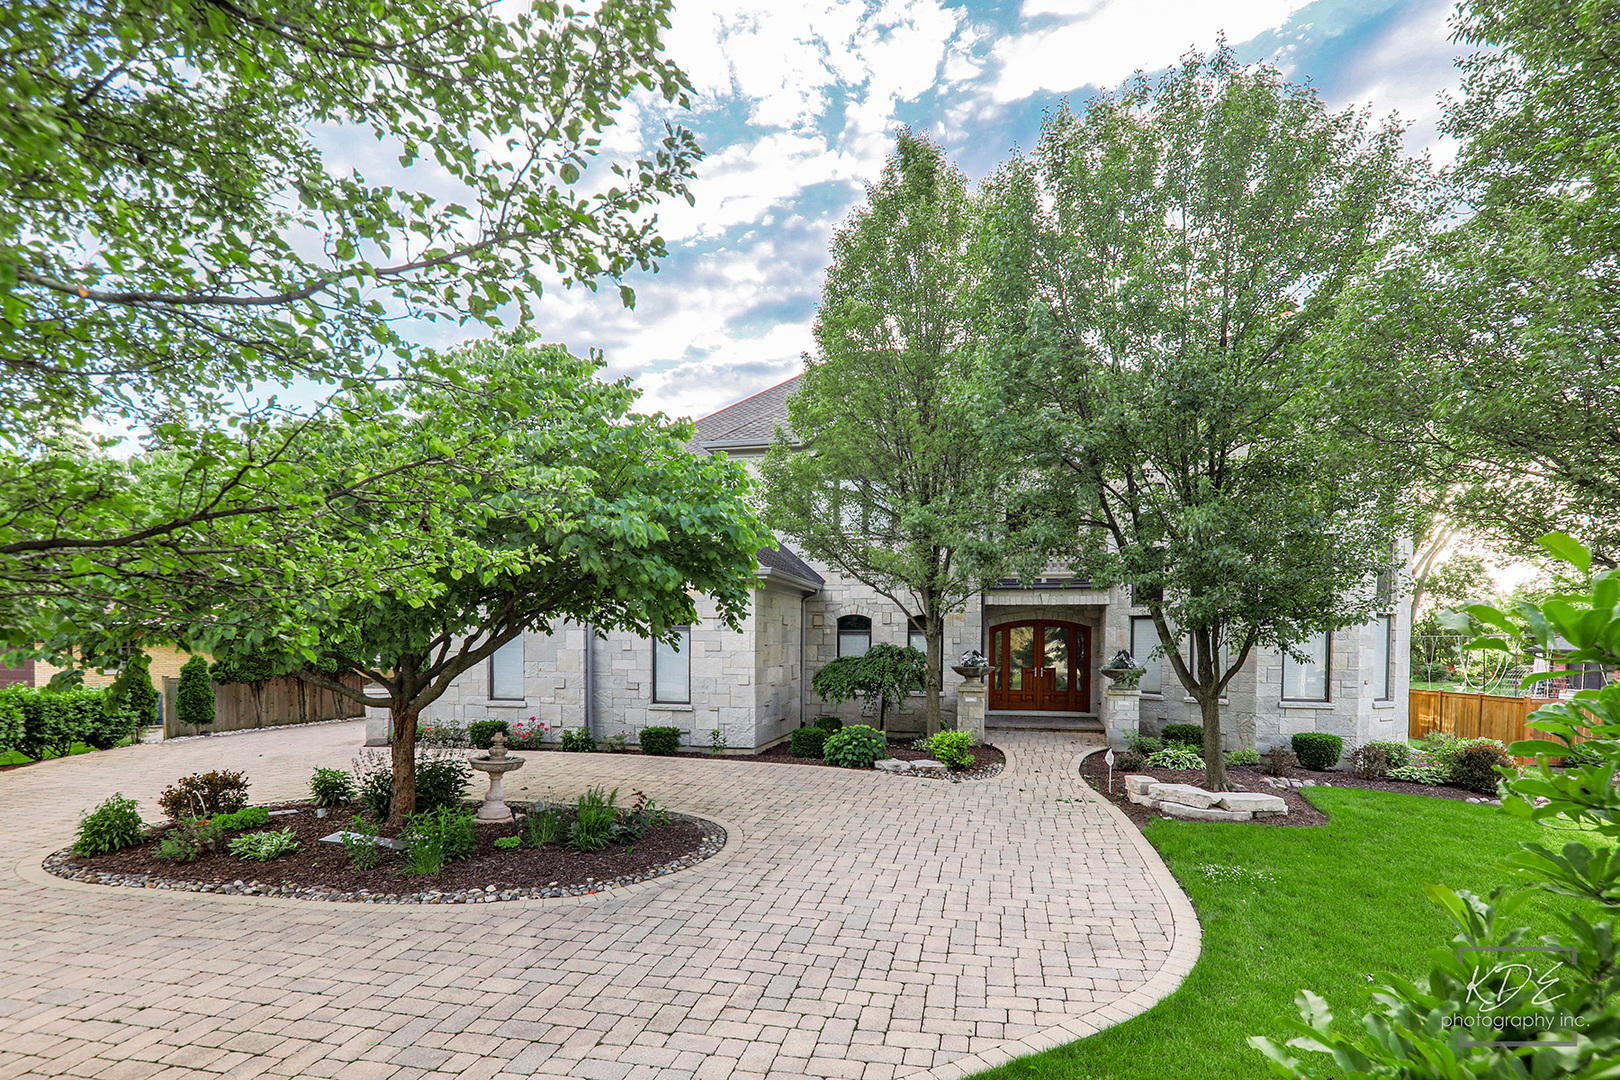
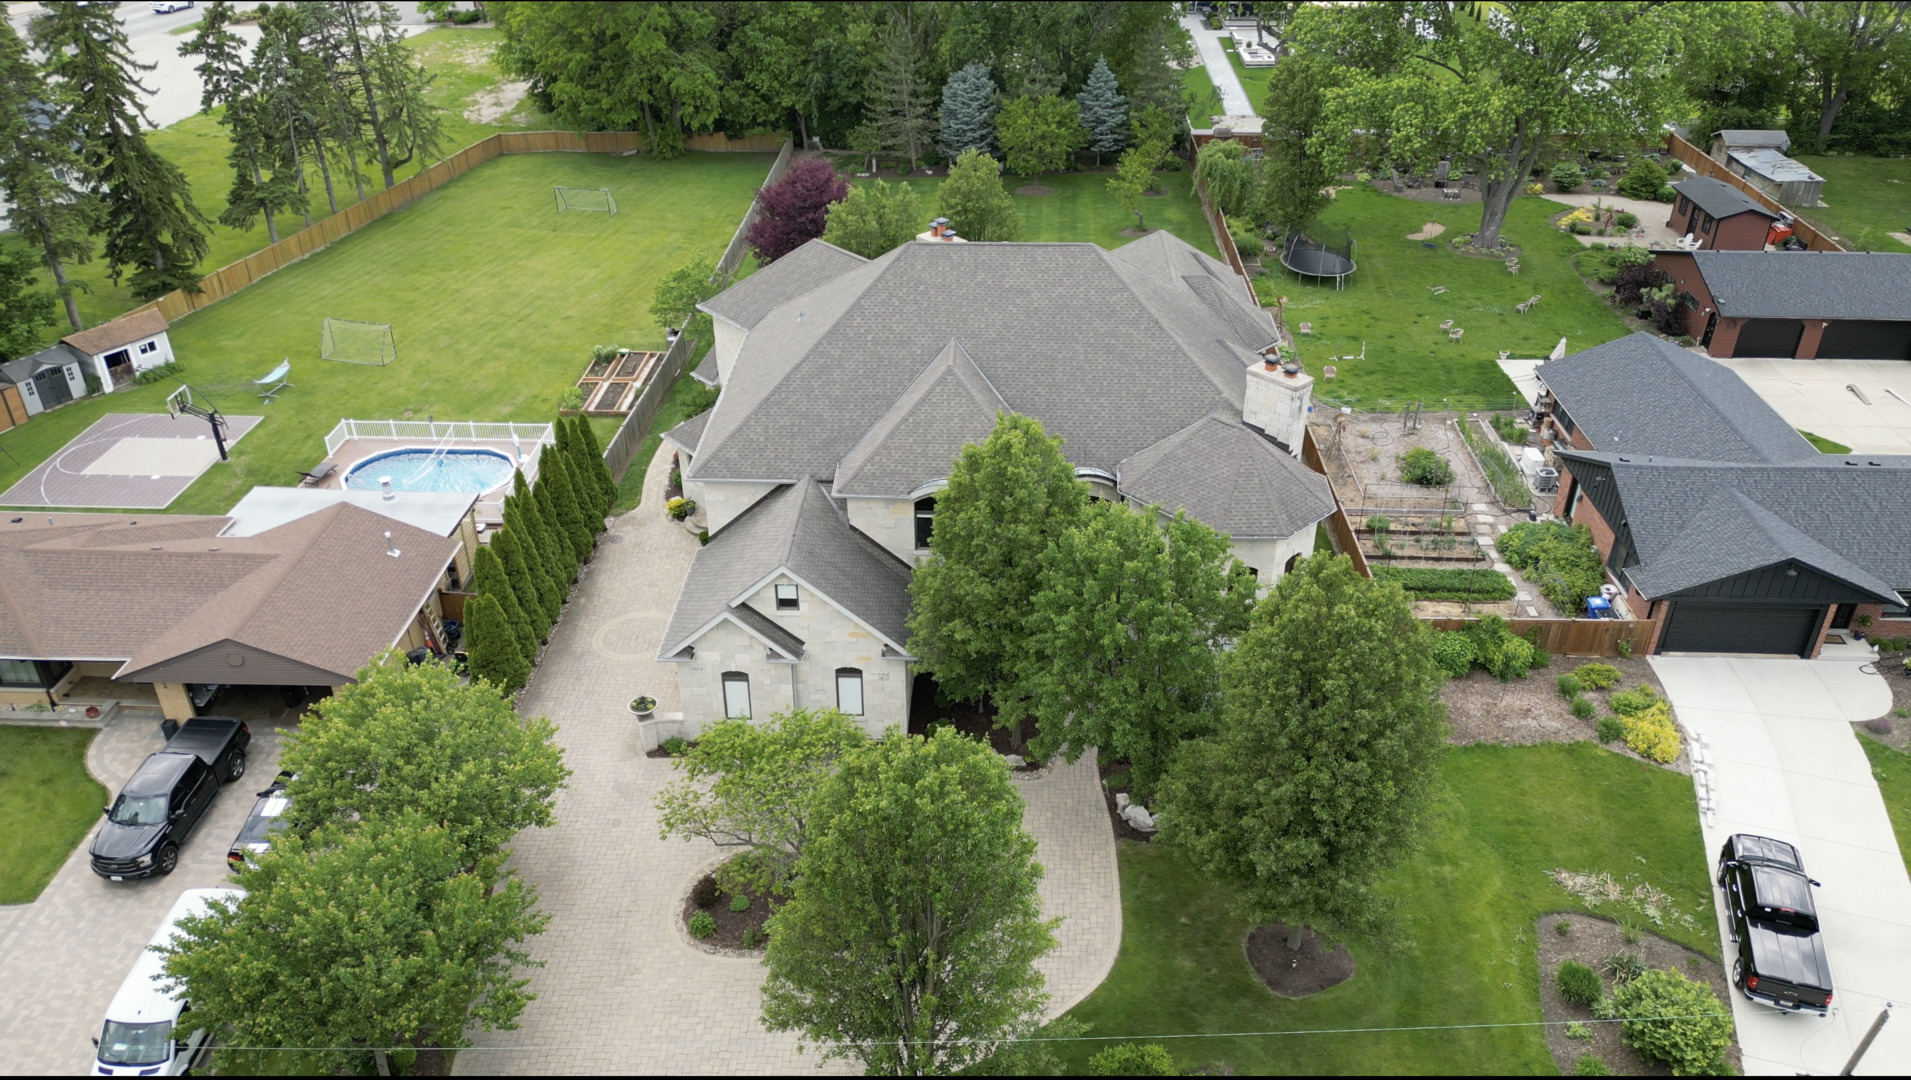
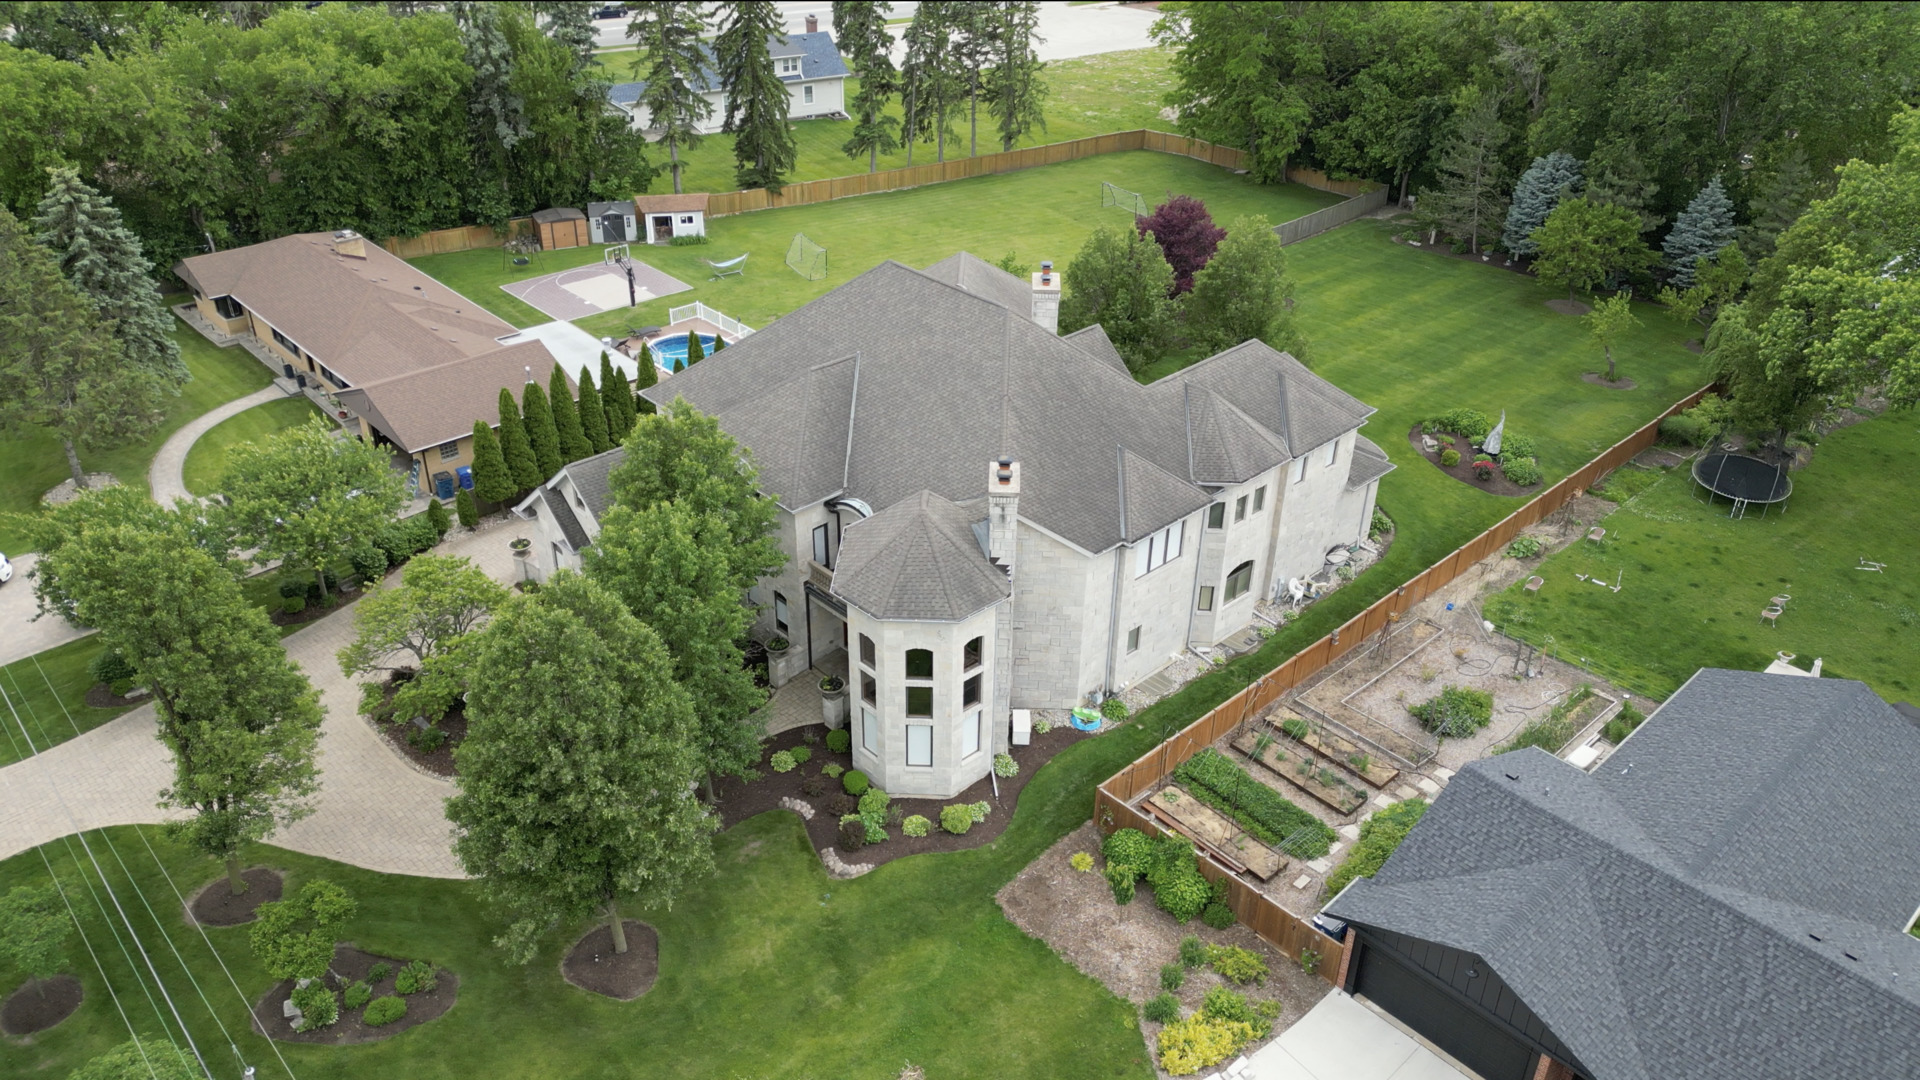
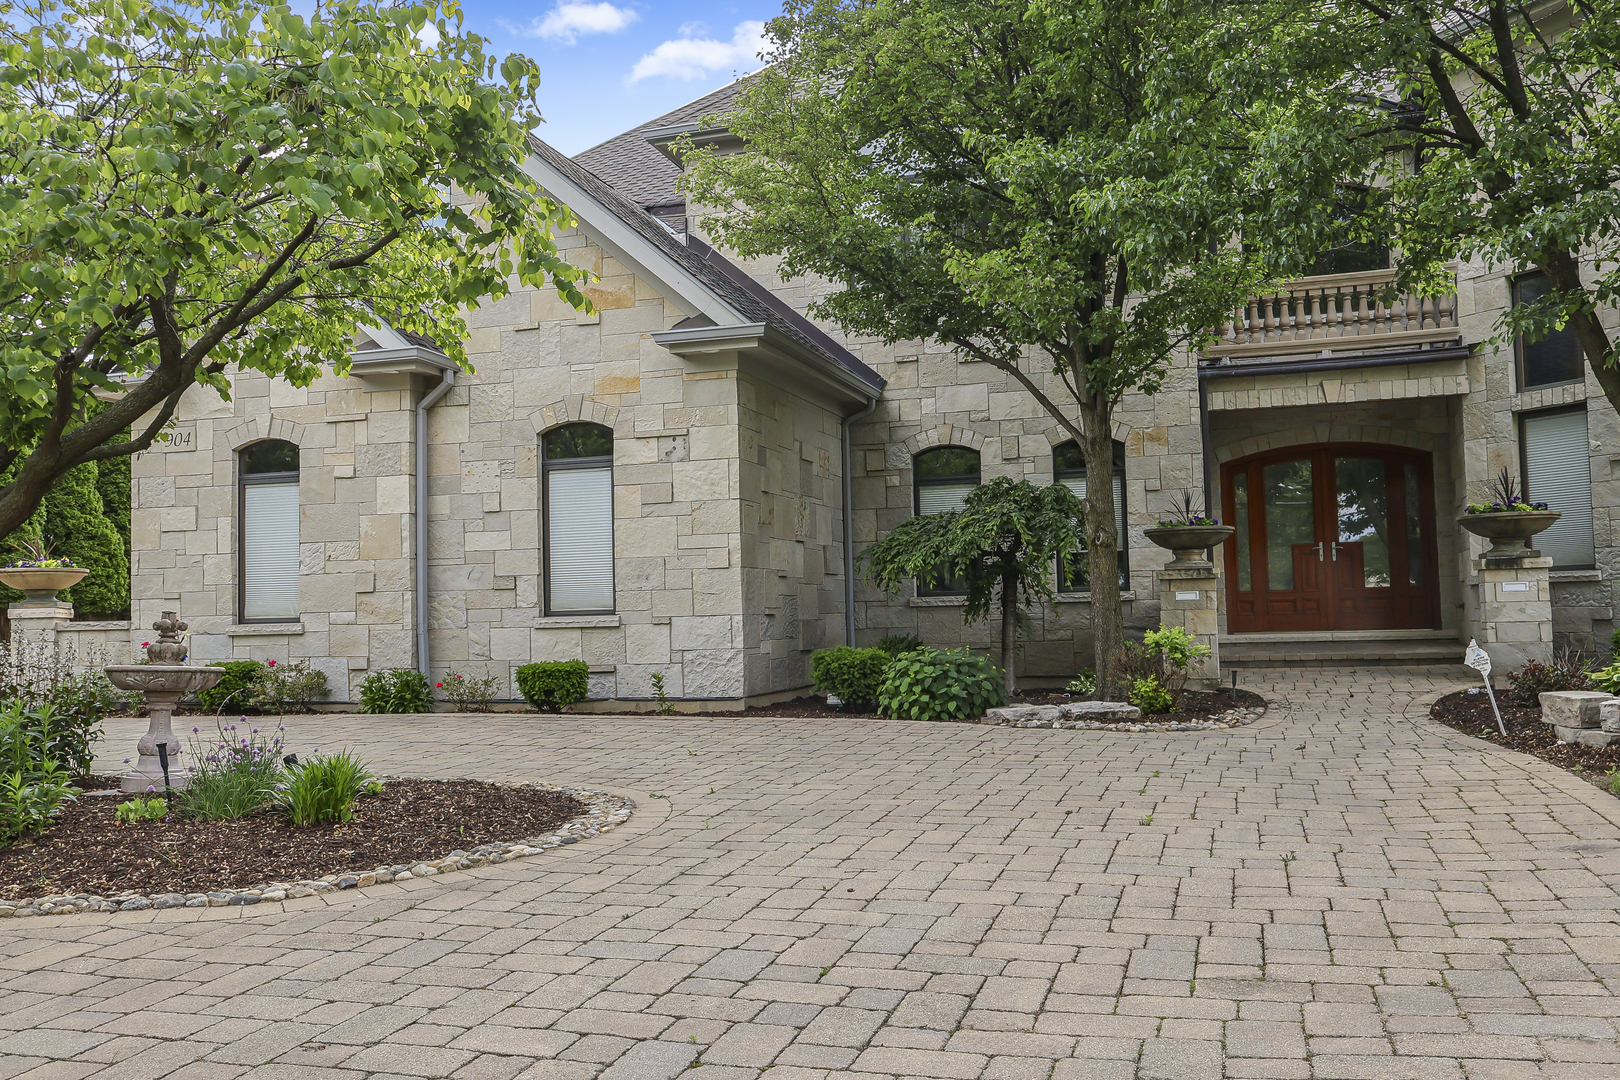
Property Description
Experience unparalleled luxury in this meticulously crafted 6-bedroom, 5.5-bathroom home, situated in a top-tier school district. Built by an old-world carpenter with solid 2x6 plywood construction, this residence exemplifies impeccable quality and attention to detail, promising both elegance and comfort. Every inch of this home has been thoughtfully considered and maintained to the highest standards. With approximately two years remaining on a home warranty, new owners can enjoy peace of mind. Exceptional construction custom-built by a master carpenter, this home features: Solid 2x6 plywood construction** ensuring durability and longevity and High-end finishes** and superior craftsmanship throughout. The heart of the home is the expansive gourmet kitchen, equipped with: Neff solid marine plywood self-closing cabinets. Top-of-the-line Subzero refrigerator. Wolf double oven and 6-burner gas stove. A huge pantry for ample storage. Exquisite flooring and stonework featuring Brazilian cherry hardwood flooring throughout. Granite stonework in bathrooms, kitchen, work areas, and foyer. Architectural Grandeur including Impressive 20-foot ceilings. Hand-forged iron railings on the second floor. Imported luxury finishes, including Italian interior doors and trim. Four interior fireplaces and one exterior fireplace. Four spacious bedrooms on the second floor. Master suite on the main floor with two professionally organized walk-in closets and a luxurious bath suite featuring separate sink counters and a granite walk-in shower with multi-spray and rain features. Versatile fourth floor with additional space that can be used as an 8th bedroom, game room, or office. In-law arrangement available in multiple locations. Multiple laundry locations: Two laundry rooms on the second floor. One laundry room on the main floor. Recessed lighting throughout the house ensures a bright and inviting atmosphere. Fully finished basement, Includes a full kitchen with cabinets imported from Italy. Ample storage space and a full walk-in pantry. Additional mini side kitchen for convenience. Additional amenities: Media room or potential 7th bedroom. Whole-house vacuum system with wood floor attachment and three sweep inlets. Whole-house generator for uninterrupted power. Modern comforts offering: Radiant heated floors on the first floor and basement. State-of-the-art alarm system. Heated 3-car garage with extra-wide doors. Toto toilets in all 5.5 bathrooms. Convenient basement door entrance from the garage. Outdoor paradise includes a professionally landscaped backyard. Two elegant balconies for outdoor relaxation. Pella windows and exterior screens with built-in shades. Nestled in a prestigious school district, this luxurious home offers unmatched comfort, style, and convenience. Cost-effective high-efficiency utilities. Every detail reflects superior quality and timeless elegance. Make this dream home yours today!
Build Your Team
Quickly find investor-friendly professionals who can help you succeed in real estate investing at any stage of the investing journey.


Agents
Match with investor-friendly agents who can help you find, analyze, and close your next deal


Lenders
Get the best funding…find investor-friendly lenders who specialize in your deal strategy


Property Managers
Transition to passive investing. Find a trusted property management partnership that lasts.


Tax Pros & Accountants
Taxes and financial reporting made easy—find experts to create tax savings strategies, file taxes, and more
Location
Property Details
Parking
- Description: Attached Garage
- Details: On Site, Attached, Garage, Driveway
- Garage Spaces: 3
- Spaces Total: 3
Bedroom Information
- # of Bedrooms: 6
Bathroom Information
- # of Baths (Full): 5
- # of Baths (Partial): 1
- # of Baths (Total): 6.0
Interior Features
- # of Rooms: 16
- # of Stories: 2
- Attic: Yes
- Basement: Yes
- Basement Description: Sump Pump, Finished, Full
- Fireplace: Yes
Exterior Features
- Exterior Walls Materials: Masonry
- Foundation: Concrete Perimeter
- Roof Material: Asphalt
Land Information
- Land Use: Residential
- Land Use Subtype: Single Family Residential
Lot Information
- Parcel ID: 0814106006
- Lot Size: 0 sqft
Property Information
- Property Type: Single Family Residence
- Style: Contemporary, Mediterranean
- Year Built: 2003
Tax Information
- Annual Tax: $23,888
Utilities
- Water & Sewer: Public
- Heating: Natural Gas, Forced Air, Radiant, Zoned
- Cooling: Ceiling Fan(s), Central Air, Zoned
Location
- County: Cook
Listing Details
Investment Summary
- Monthly Cash Flow
- -$6,024
- Cap Rate
- 2.3%
- Cash-on-Cash Return
- -14.6%
- Debt Coverage Ratio
- 0.41
- Internal Rate of Return (5 years)
- -10.1%
Cash Flow
Net Operating Income (NOI) minus mortgage payments.
Calculation:
NOI - Mortgage Payments
Cap Rate (Market Value)
Capitalization Rate is a rate of return that compares the yearly Net Operating Income (NOI) to the market value.
Calculation:
NOI / Market Value
Cash-on-Cash Return (CoC)
Annual Cash Flow / Cash Invested
Calculation:
Annual cash flow divided by initial cash invested.
Debt Coverage Ratio (DCR)
Net Operating Income (NOI) divided by total debt payments.
Calculation:
NOI / Total Debt Payments
Internal Rate of Return (IRR)
A metric for assessing profitability over time. IRR is the discount rate at which the net present value (NPV) of all future cash flows (positive and negative) from an investment equals zero — including both periodic cash flow (such as rent) and a projected sale at the end of the holding period. It represents the expected annualized return, accounting for income, expenses, and the recovery of capital through a future sale.
Purchase Details
Purchase PriceThe price paid for the property. Purchase price:
| $2,149,900 |
|---|---|
Amount FinancedThe amount of the purchase financed through a loan. Amount financed:
| -$1,719,920 |
Down paymentThe initial payment made towards the purchase. Down payment:
| $429,980 |
Closing CostsFees and expenses associated with purchasing a property, typically ranging from 2% to 5% of the home’s purchase price, paid at the end of a home purchase to cover services like lending, title transfer, and taxes. Closing costs:
| $64,497 |
Rehab CostsCosts incurred to repair or improve the property, including: roof, flooring, exterior siding, kitchen, exterior paint, bathrooms, etc. Rehab costs:
| $0 |
Initial Cash InvestedThe total initial cash invested in the property. Calculation:Down payment + Buying costs + Rehab costs Initial cash invested:
| $494,477 |
Square Feet (SQFT)The total square footage of the property. Square feet:
| 5,615 |
Cost Per Square FootCost per square foot of the property. Calculation:Purchase Price / Square Feet Cost per square foot:
| $383 |
Monthly Rent Per Square FootMonthly rent divided by the number of square feet. This ratio helps investors compare rental income efficiency across properties, markets, and unit sizes Calculation:Monthly Rent / Square Feet Monthly rent per square foot:
| $1.59 |
Financing Details
Loan AmountThe total sum of money borrowed from a lender to finance a property purchase. Calculation:Purchase Price - Down Payment
Loan amount:
| $1,719,920 |
|---|---|
Loan to Value Ratio (LTV)Loan amount divided by the market value of the property. Calculation:Loan Amount / Market Value
Loan to value ratio:
| 80.0% |
Loan TypeThe type of loan (e.g., fixed, adjustable).
Loan type:
| Amortizing |
TermThe loan repayment period in years.
Term:
| 30 years |
Interest RateThe percentage a lender charges on the borrowed amount of a loan, determining the cost of borrowing money.
Interest rate:
| 5.875% |
Principal & Interest (PI)The principal is the portion of the loan payment that reduces the loan balance. The interest is the lender's charge for borrowing money. Calculation:(P * r * (1 + r) ** n) / ((1 + r) ** n - 1) Where:
P = Loan amount (principal)
Principal & interest:
| $10,174 |
Property TaxesAnnual taxes levied by local governments on real estate properties. These taxes fund public services like schools, roads, and emergency services.
Property tax:
| $1,991 |
InsuranceThe costs for insurance coverage to protect against financial losses due to risks like fire, natural disasters, theft, liability, or tenant-related damages. Calculation:Assumes 7% of gross rental income, unless insurance rates are specified.
Insurance:
| $623 |
Private Mortgage Insurance (PMI)A fee that borrowers pay when they take out a conventional loan with a loan-to-value (LTV) ratio above 80%.
Private mortgage insurance (PMI):
| $0 |
Monthly PaymentThe fixed amount a borrower pays each month to repay a loan. It typically includes principal and interest (P&I) and may also cover property taxes, insurance, HOA fees, and PMI if escrowed. Monthly payment:
| $12,788 |
Operating Income
| % Rent | Monthly | Yearly | |
|---|---|---|---|
Gross RentThe total rental income received from tenants before deducting any expenses. Includes base rent, late fees, pet fees, parking fees, and other recurring charges.
Gross rent:
| $8,900 | $106,800 | |
Vacancy LossExpected loss of rent due to vacancies.
Vacancy loss:
(6%)
| 6% | -$534 | -$6,408 |
Operating IncomeGross rental income minus vacancy loss. Calculation:Gross rent - Vacancy loss
Operating income:
| $8,366 | $100,392 |
Operating Expenses
| % Rent | Monthly | Yearly | |
|---|---|---|---|
Property TaxesAnnual taxes levied by local governments on real estate properties. These taxes fund public services like schools, roads, and emergency services. | 22% | -$1,991 | -$23,888 |
InsuranceThe costs for insurance coverage to protect against financial losses due to risks like fire, natural disasters, theft, liability, or tenant-related damages. Calculation:Assumes 7% of gross rental income, unless insurance rates are specified. | 7% | -$623 | -$7,476 |
Property ManagementThe costs associated with hiring a property manager to handle the day-to-day operations of a rental property. Includes management fees, leasing fes, eviction fees, etc. Calculation:Assumes 8% of gross rental income. | 8% | -$712 | -$8,544 |
Repairs & MaintenanceOngoing costs for routine upkeep and minor fixes needed to keep a property in good working condition. Calculation:Assumes 5% of gross rental income. Varies by property age and condition. | 5% | -$445 | -$5,340 |
Capital ExpensesLarge, infrequent costs for major improvements or replacements, like a new roof, HVAC system, or appliances. Calculation:Assumes 5% of gross rental income. Varies by property age. | 5% | -$445 | -$5,340 |
HOA FeesRegular dues paid to a Homeowners Association for community maintenance, amenities, and management. Similar fees include: Condo Association Fees, Co-op Maintenance Fees, etc. | n/a | n/a | n/a |
Operating ExpensesRecurring costs required to maintain and manage a rental property, including property taxes, insurance, maintenance, repairs, utilities (if paid by the owner), property management fees, and other day-to-day expenses. Calculation:Insurance + Property Taxes + Property Management + Repairs & Maintenance + Capital Expenditures + HOA Fees | 47% | -$4,216 | -$50,588 |
Cash Flow
| Monthly | Yearly | |
|---|---|---|
Net Operating Income (NOI)The income generated from a property after deducting all operating expenses but before deducting mortgage payments, taxes, and capital expenditures. Calculation:Gross Operating Income - Operating Expenses
Net operating income:
| $4,150 | $49,800 |
Mortgage PaymentThe fixed amount a borrower pays each month to repay a loan. It typically includes principal and interest (P&I) and may also cover property taxes, insurance, HOA fees, and PMI if escrowed. | -$10,174 | -$122,088 |
Cash FlowNet Operating Income (NOI) minus mortgage payments. Calculation:NOI - Mortgage Payments | $6,024 | $72,288 |