$350,000
Investment Summary
- Monthly Cash Flow
- -$446
- Cap Rate
- 4.6%
- Cash-on-Cash Return
- -6.6%
- Debt Coverage Ratio
- 0.75
- Internal Rate of Return (5 years)
- -2.4%
Cash Flow
Net Operating Income (NOI) minus mortgage payments.
Calculation:
NOI - Mortgage Payments
Cap Rate (Market Value)
Capitalization Rate is a rate of return that compares the yearly Net Operating Income (NOI) to the market value.
Calculation:
NOI / Market Value
Cash-on-Cash Return (CoC)
Annual Cash Flow / Cash Invested
Calculation:
Annual cash flow divided by initial cash invested.
Debt Coverage Ratio (DCR)
Net Operating Income (NOI) divided by total debt payments.
Calculation:
NOI / Total Debt Payments
Internal Rate of Return (IRR)
A metric for assessing profitability over time. IRR is the discount rate at which the net present value (NPV) of all future cash flows (positive and negative) from an investment equals zero — including both periodic cash flow (such as rent) and a projected sale at the end of the holding period. It represents the expected annualized return, accounting for income, expenses, and the recovery of capital through a future sale.
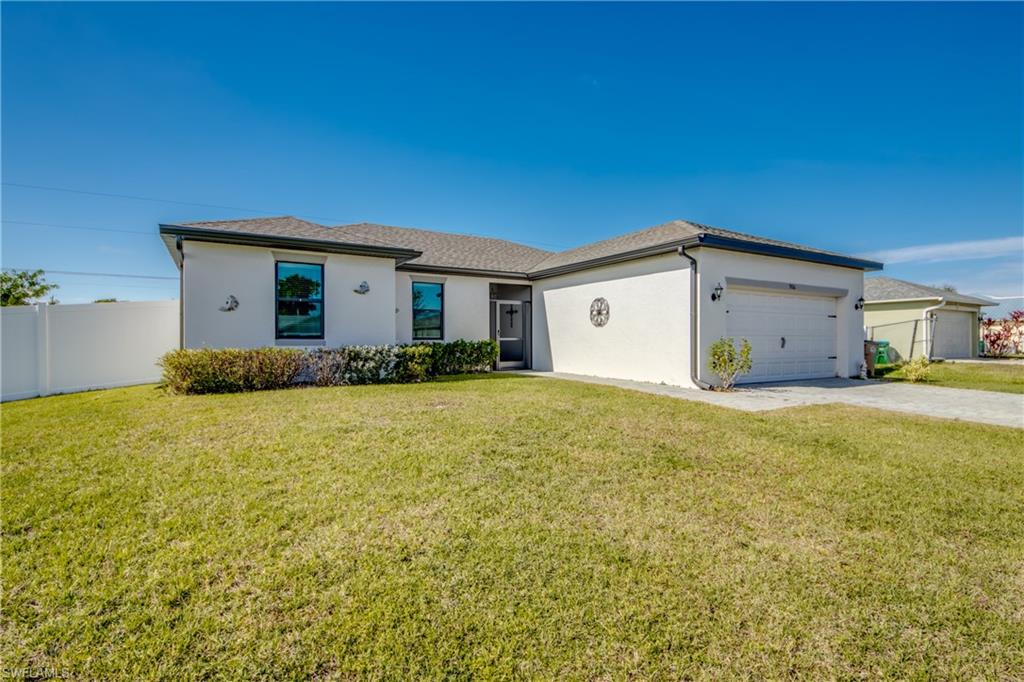
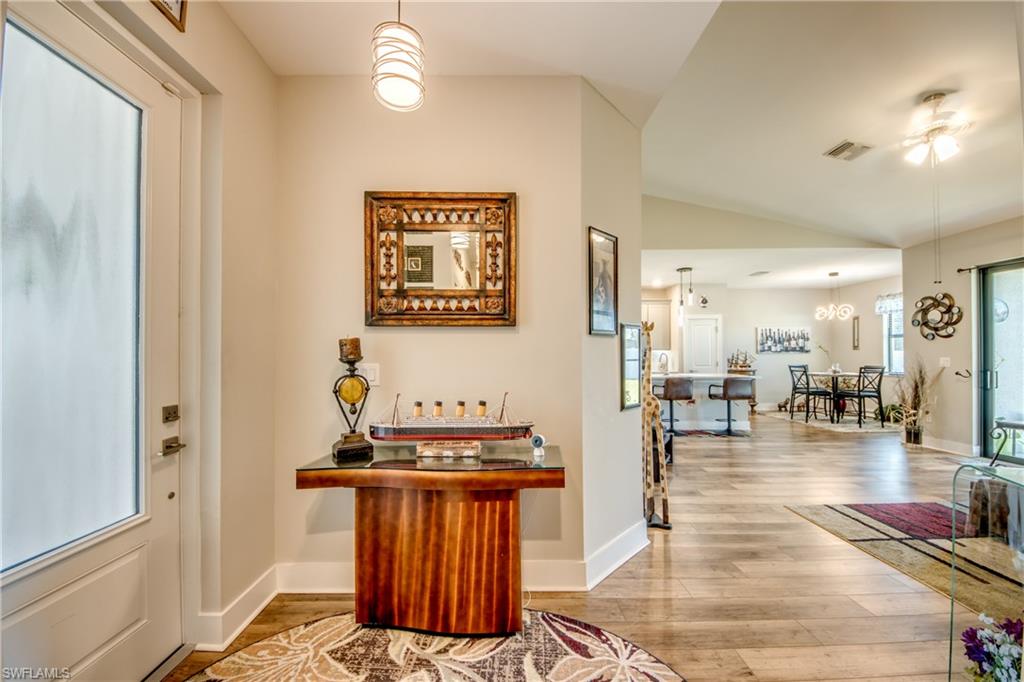
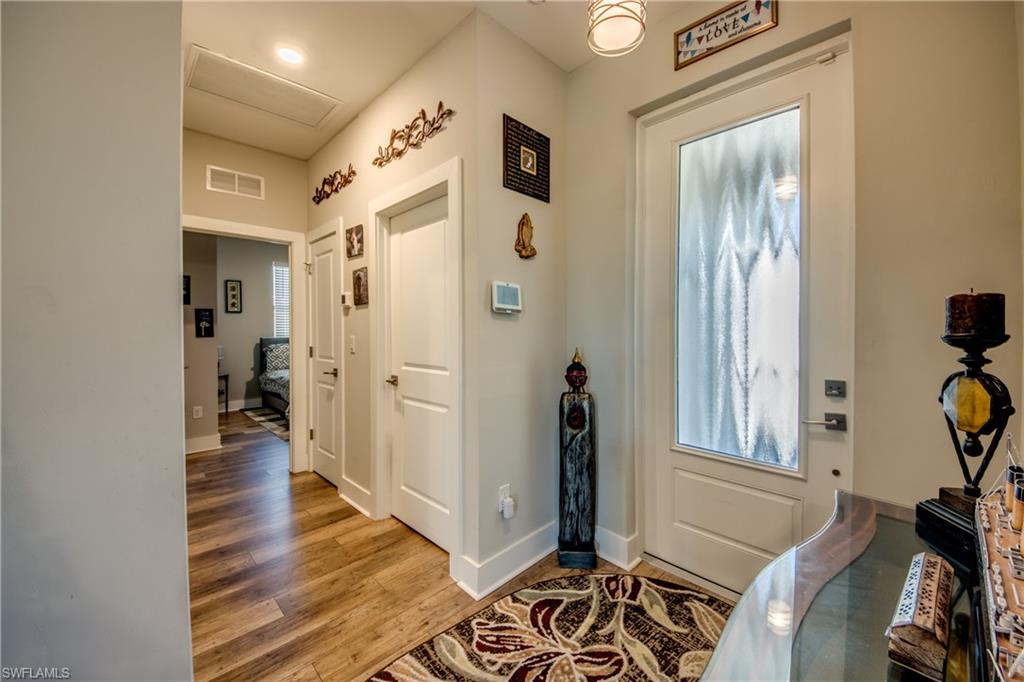
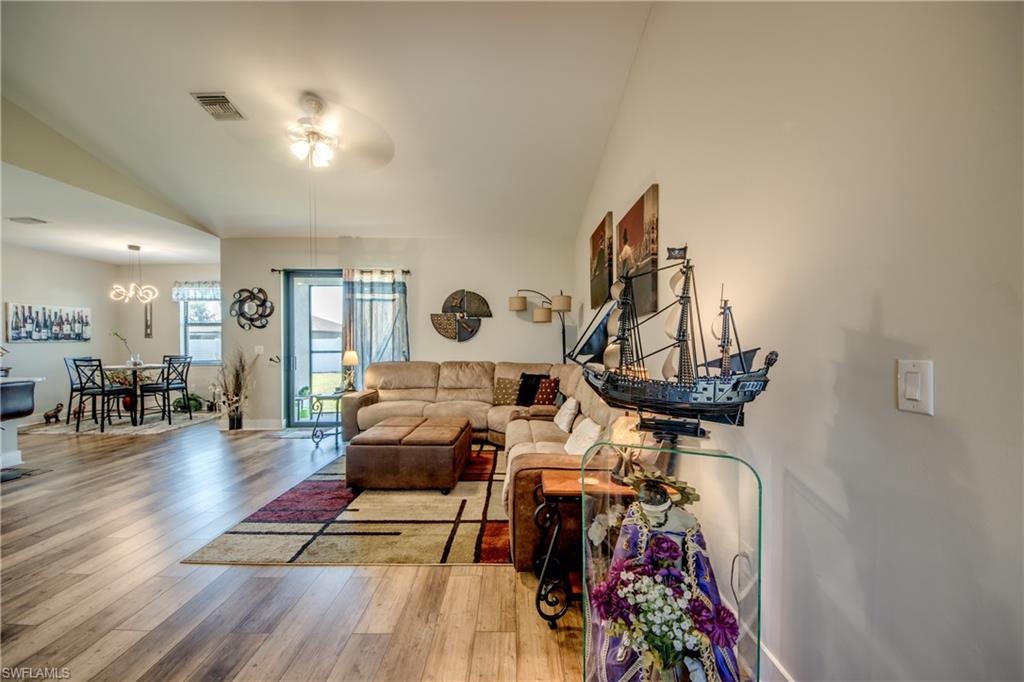
Property Description
Why wait for new construction when you can have it all right now? This 2022-built Brickell Model by LGI Homes outshines the competition, boasting all the upgrades and none of the headaches. The builder kinks have already been worked out, and costly add-ons like window treatments, ceiling fans, a screened lanai, and a fully fenced backyard are already included. This spacious home features three bedrooms, two full bathrooms, and a flex room that’s perfect for a den/home office, gym, or relaxation space. The open-concept kitchen and living area flow effortlessly to the covered patio, making it the ideal spot for entertaining, whether it’s family dinners, game nights, or simply unwinding after a long day. The kitchen is a showstopper with its gorgeous quartz countertops, a massive center island perfect for meal prep or hosting, and soft-close shaker style cabinets with crown molding. Under-cabinet lighting and a beautifully designed backsplash complete the space, while stainless steel Whirlpool® appliances ensure both style and functionality. This home is packed with thoughtful extras, including storm-smart construction, IMPACT GLASS windows and doors, and a hurricane-reinforced garage door for added peace of mind. The two-car garage features a sleek epoxy-coated floor and a Wi-Fi-enabled opener for convenience. The fully fenced yard(with gate) is perfect for pets or storing a small boat or camper, while the automatic sprinkler system ensures easy maintenance. Situated outside of a flood zone, this property does not require flood insurance, saving you money and worry. It’s already connected to city water and sewer too with a small balance to be assumed by buyer. This part of Cape Coral has no HOA fees or rent restrictions to limit your freedom, pet friendly too! If you like boating and fishing, the public boat launch is nearby with access to Pine Island Sound or nearby saltwater canals and lakes. If you like freshwater fishing and boating we’ve got you covered there too. . . Freshwater boat ramps nearby for that too! The Coral Oaks Golf Course is a city owned, public 18-hole golf course and is just a short drive away. You KNOW all the reasons Cape Coral has been chosen as a TOP DESTINATION in the country for waterfront living, affordability, quality of life and safest cities to live! AND we found the perfect getaway for you! Come see what Cape Coral has to offer with over 400 miles of canals and an unparalleled lifestyle! Truly a waterfront wonderland! Easy access to nearby beaches, international airports, shopping, schools, public library, the forthcoming Seven Islands development project and all of the wonderful Southwest Florida lifestyle amenities we are blessed to enjoy! NO flooding from Hurricane Ian. Why settle for basic when you can have better than new? Schedule your private showing today and prepare to fall in love!
Build Your Team
Quickly find investor-friendly professionals who can help you succeed in real estate investing at any stage of the investing journey.


Agents
Match with investor-friendly agents who can help you find, analyze, and close your next deal


Lenders
Get the best funding…find investor-friendly lenders who specialize in your deal strategy


Property Managers
Transition to passive investing. Find a trusted property management partnership that lasts.


Tax Pros & Accountants
Taxes and financial reporting made easy—find experts to create tax savings strategies, file taxes, and more
Location
Property Details
Parking
- Description: Attached, Driveway, Garage, Paved, GarageDoorOpener
- Details: Garage Door Opener, Paved, Attached
- Garage Spaces: 2
- Spaces Total: 2
Bedroom Information
- # of Bedrooms: 3
Bathroom Information
- # of Baths (Full): 2
- # of Baths (Total): 2.0
Interior Features
- # of Stories: 1
Exterior Features
- Exterior Walls Materials: Stucco
- Roof Type: IRR/Cathedral
- Roof Material: Shingle
Land Information
- Land Use: Residential
- Land Use Subtype: Single Family Residential
Lot Information
- Parcel ID: 224423C204484.0490
- Lot Size: 10454 sqft
Property Information
- Property Type: Single Family Residence
- Style: Ranch, Single Family
- Year Built: 2022
Tax Information
- Annual Tax: $4,540
Utilities
- Heating: Central, Electric
- Cooling: Ceiling Fan(s)
Location
- County: Lee
Listing Details
Investment Summary
- Monthly Cash Flow
- -$446
- Cap Rate
- 4.6%
- Cash-on-Cash Return
- -6.6%
- Debt Coverage Ratio
- 0.75
- Internal Rate of Return (5 years)
- -2.4%
Cash Flow
Net Operating Income (NOI) minus mortgage payments.
Calculation:
NOI - Mortgage Payments
Cap Rate (Market Value)
Capitalization Rate is a rate of return that compares the yearly Net Operating Income (NOI) to the market value.
Calculation:
NOI / Market Value
Cash-on-Cash Return (CoC)
Annual Cash Flow / Cash Invested
Calculation:
Annual cash flow divided by initial cash invested.
Debt Coverage Ratio (DCR)
Net Operating Income (NOI) divided by total debt payments.
Calculation:
NOI / Total Debt Payments
Internal Rate of Return (IRR)
A metric for assessing profitability over time. IRR is the discount rate at which the net present value (NPV) of all future cash flows (positive and negative) from an investment equals zero — including both periodic cash flow (such as rent) and a projected sale at the end of the holding period. It represents the expected annualized return, accounting for income, expenses, and the recovery of capital through a future sale.
Purchase Details
Purchase PriceThe price paid for the property. Purchase price:
| $350,000 |
|---|---|
Amount FinancedThe amount of the purchase financed through a loan. Amount financed:
| -$280,000 |
Down paymentThe initial payment made towards the purchase. Down payment:
| $70,000 |
Closing CostsFees and expenses associated with purchasing a property, typically ranging from 2% to 5% of the home’s purchase price, paid at the end of a home purchase to cover services like lending, title transfer, and taxes. Closing costs:
| $10,500 |
Rehab CostsCosts incurred to repair or improve the property, including: roof, flooring, exterior siding, kitchen, exterior paint, bathrooms, etc. Rehab costs:
| $0 |
Initial Cash InvestedThe total initial cash invested in the property. Calculation:Down payment + Buying costs + Rehab costs Initial cash invested:
| $80,500 |
Square Feet (SQFT)The total square footage of the property. Square feet:
| 1,680 |
Cost Per Square FootCost per square foot of the property. Calculation:Purchase Price / Square Feet Cost per square foot:
| $208 |
Monthly Rent Per Square FootMonthly rent divided by the number of square feet. This ratio helps investors compare rental income efficiency across properties, markets, and unit sizes Calculation:Monthly Rent / Square Feet Monthly rent per square foot:
| $1.49 |
Financing Details
Loan AmountThe total sum of money borrowed from a lender to finance a property purchase. Calculation:Purchase Price - Down Payment
Loan amount:
| $280,000 |
|---|---|
Loan to Value Ratio (LTV)Loan amount divided by the market value of the property. Calculation:Loan Amount / Market Value
Loan to value ratio:
| 80.0% |
Loan TypeThe type of loan (e.g., fixed, adjustable).
Loan type:
| Amortizing |
TermThe loan repayment period in years.
Term:
| 30 years |
Interest RateThe percentage a lender charges on the borrowed amount of a loan, determining the cost of borrowing money.
Interest rate:
| 6.625% |
Principal & Interest (PI)The principal is the portion of the loan payment that reduces the loan balance. The interest is the lender's charge for borrowing money. Calculation:(P * r * (1 + r) ** n) / ((1 + r) ** n - 1) Where:
P = Loan amount (principal)
Principal & interest:
| $1,793 |
Property TaxesAnnual taxes levied by local governments on real estate properties. These taxes fund public services like schools, roads, and emergency services.
Property tax:
| $378 |
InsuranceThe costs for insurance coverage to protect against financial losses due to risks like fire, natural disasters, theft, liability, or tenant-related damages. Calculation:Assumes 7% of gross rental income, unless insurance rates are specified.
Insurance:
| $175 |
Private Mortgage Insurance (PMI)A fee that borrowers pay when they take out a conventional loan with a loan-to-value (LTV) ratio above 80%.
Private mortgage insurance (PMI):
| $0 |
Monthly PaymentThe fixed amount a borrower pays each month to repay a loan. It typically includes principal and interest (P&I) and may also cover property taxes, insurance, HOA fees, and PMI if escrowed. Monthly payment:
| $2,346 |
Operating Income
| % Rent | Monthly | Yearly | |
|---|---|---|---|
Gross RentThe total rental income received from tenants before deducting any expenses. Includes base rent, late fees, pet fees, parking fees, and other recurring charges.
Gross rent:
| $2,500 | $30,000 | |
Vacancy LossExpected loss of rent due to vacancies.
Vacancy loss:
(6%)
| 6% | -$150 | -$1,800 |
Operating IncomeGross rental income minus vacancy loss. Calculation:Gross rent - Vacancy loss
Operating income:
| $2,350 | $28,200 |
Operating Expenses
| % Rent | Monthly | Yearly | |
|---|---|---|---|
Property TaxesAnnual taxes levied by local governments on real estate properties. These taxes fund public services like schools, roads, and emergency services. | 15% | -$378 | -$4,541 |
InsuranceThe costs for insurance coverage to protect against financial losses due to risks like fire, natural disasters, theft, liability, or tenant-related damages. Calculation:Assumes 7% of gross rental income, unless insurance rates are specified. | 7% | -$175 | -$2,100 |
Property ManagementThe costs associated with hiring a property manager to handle the day-to-day operations of a rental property. Includes management fees, leasing fes, eviction fees, etc. Calculation:Assumes 8% of gross rental income. | 8% | -$200 | -$2,400 |
Repairs & MaintenanceOngoing costs for routine upkeep and minor fixes needed to keep a property in good working condition. Calculation:Assumes 5% of gross rental income. Varies by property age and condition. | 5% | -$125 | -$1,500 |
Capital ExpensesLarge, infrequent costs for major improvements or replacements, like a new roof, HVAC system, or appliances. Calculation:Assumes 5% of gross rental income. Varies by property age. | 5% | -$125 | -$1,500 |
HOA FeesRegular dues paid to a Homeowners Association for community maintenance, amenities, and management. Similar fees include: Condo Association Fees, Co-op Maintenance Fees, etc. | n/a | n/a | n/a |
Operating ExpensesRecurring costs required to maintain and manage a rental property, including property taxes, insurance, maintenance, repairs, utilities (if paid by the owner), property management fees, and other day-to-day expenses. Calculation:Insurance + Property Taxes + Property Management + Repairs & Maintenance + Capital Expenditures + HOA Fees | 40% | -$1,003 | -$12,041 |
Cash Flow
| Monthly | Yearly | |
|---|---|---|
Net Operating Income (NOI)The income generated from a property after deducting all operating expenses but before deducting mortgage payments, taxes, and capital expenditures. Calculation:Gross Operating Income - Operating Expenses
Net operating income:
| $1,347 | $16,164 |
Mortgage PaymentThe fixed amount a borrower pays each month to repay a loan. It typically includes principal and interest (P&I) and may also cover property taxes, insurance, HOA fees, and PMI if escrowed. | -$1,793 | -$21,516 |
Cash FlowNet Operating Income (NOI) minus mortgage payments. Calculation:NOI - Mortgage Payments | $446 | $5,352 |