$2,995,000
Investment Summary
- Monthly Cash Flow
- -$9,233
- Cap Rate
- 2.4%
- Cash-on-Cash Return
- -16.1%
- Debt Coverage Ratio
- 0.40
- Internal Rate of Return (5 years)
- -11.6%
Cash Flow
Net Operating Income (NOI) minus mortgage payments.
Calculation:
NOI - Mortgage Payments
Cap Rate (Market Value)
Capitalization Rate is a rate of return that compares the yearly Net Operating Income (NOI) to the market value.
Calculation:
NOI / Market Value
Cash-on-Cash Return (CoC)
Annual Cash Flow / Cash Invested
Calculation:
Annual cash flow divided by initial cash invested.
Debt Coverage Ratio (DCR)
Net Operating Income (NOI) divided by total debt payments.
Calculation:
NOI / Total Debt Payments
Internal Rate of Return (IRR)
A metric for assessing profitability over time. IRR is the discount rate at which the net present value (NPV) of all future cash flows (positive and negative) from an investment equals zero — including both periodic cash flow (such as rent) and a projected sale at the end of the holding period. It represents the expected annualized return, accounting for income, expenses, and the recovery of capital through a future sale.
Property Description
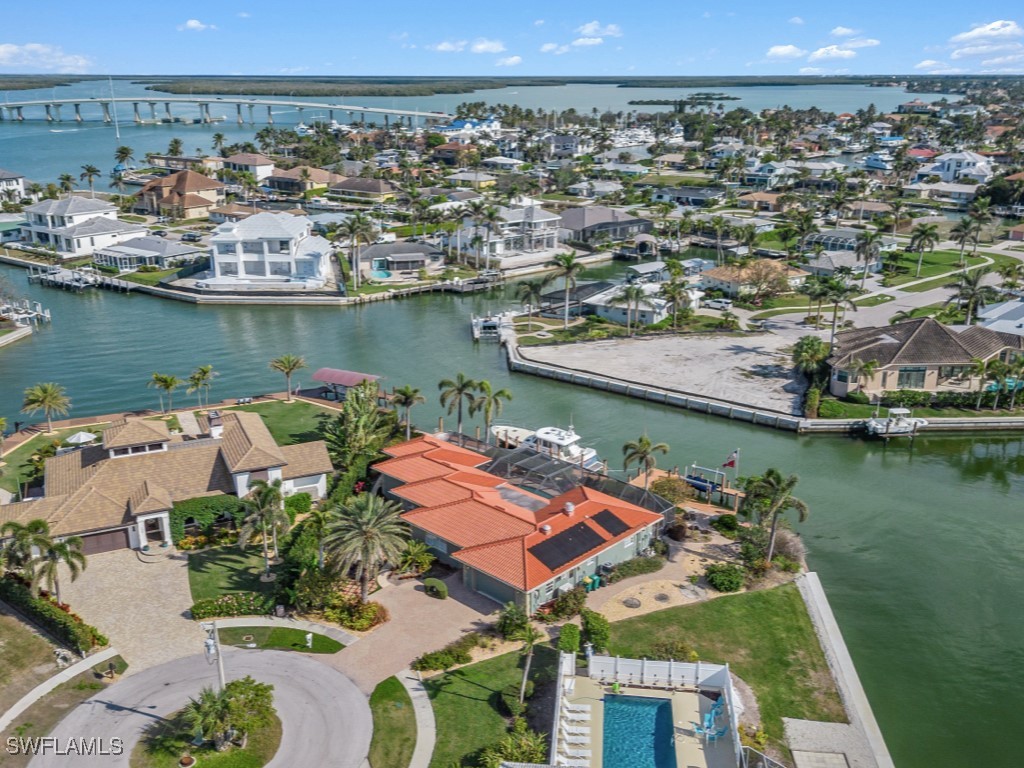
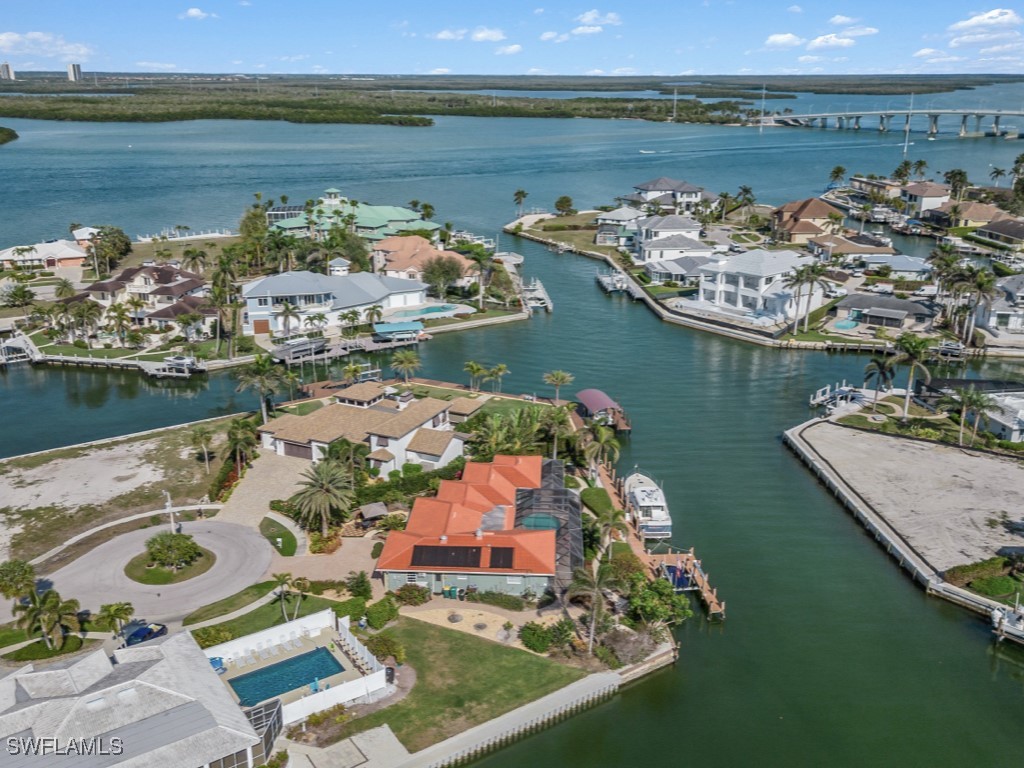
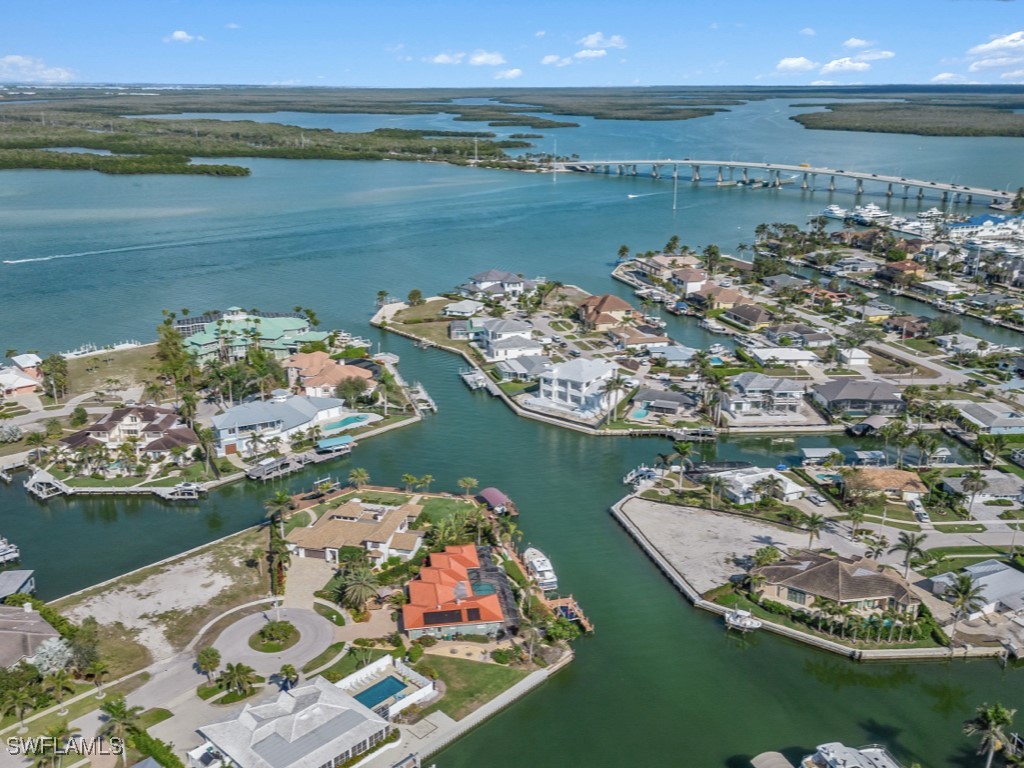
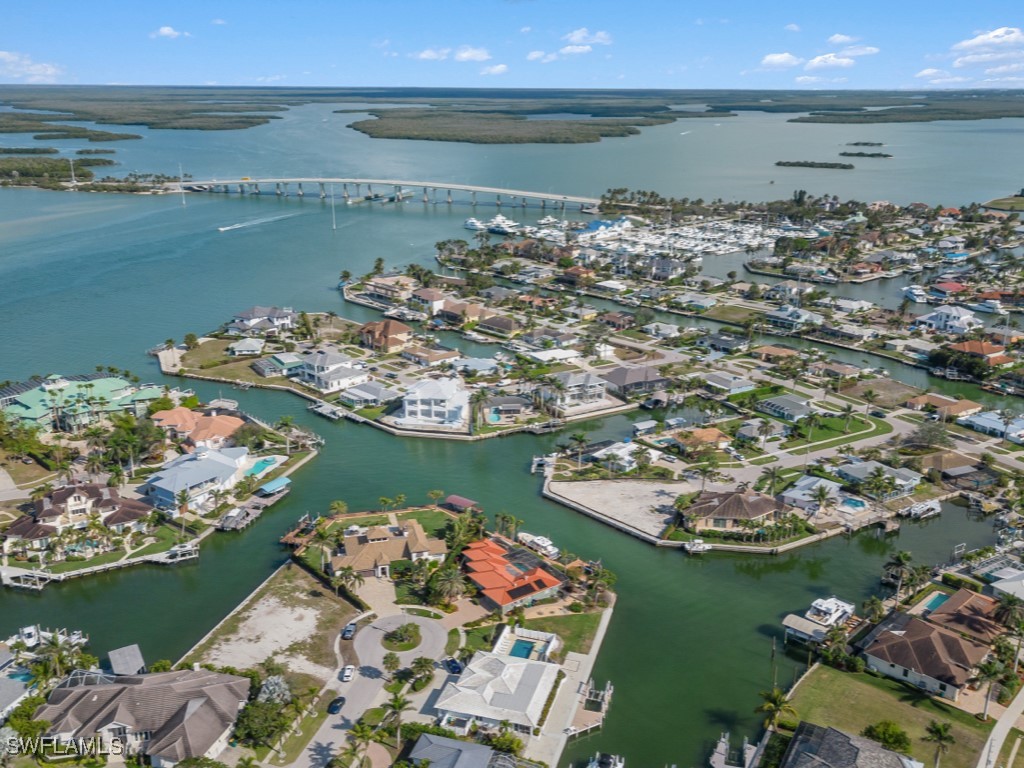
Spectacular boaters’ property is truly a piece of paradise, situated on almost a third of an acre at the end of private cul-de-sac. Designed with both relaxation and entertainment in mind, this remodeled home offers a blend of sophistication and functionality, creating the ultimate Marco Island lifestyle! Step onto the expansive screened lanai, immerse yourself in the beauty of SE spectacular sunrises that blend seamlessly with tranquil water views. Lounge by the solar-heated pool. An electric storm screen separates covered & uncovered areas. Perfect for entertaining! Property has direct-access waterfront with a 128 ft. private dock and 10,000 lb. lift. Currently, the lift is divided to provide support for 2 boats or a boat and jet ski, is easily reconverted to serve a single vessel. Experience waterfront living at its finest with 184 ft. canal frontage. A boater’s paradise with quick, DIRECT access to the Marco River and Gulf of Mexico and NO BRIDGES! The interior of this beautifully renovated retreat offers Saltillo tile flooring, white plantation shutters, a spacious great room, large den/study, huge kitchen, 3 bedrooms, 2.5 baths, laundry rm. and oversized 2 car garage. Main living area offers open floor plan with 6 sliders that open to the expansive lanai overlooking the waterway. At the heart of this home lies a chef’s dream kitchen, featuring beautiful custom KraftMaid solid wood cabinetry with custom features, white quartz counter tops, hand painted Portuguese tiled backsplash, under-cabinet lighting and newer top-of-the-line stainless steel appliances: Thermador 6-burner gas range/oven with a commercial dual-fan range hood, Whirlpool refrigerator, LG electric double conventional/microwave oven, Thermador dishwasher and Cecilware commercial indoor grill. Adjacent is the great room featuring a custom KraftMaid solid wood cabinetry entertainment center, a full wet bar with Turkish tumble stone backsplash, U-line refrigerator/ice maker, handmade copper sink and custom lighted shelving, ideal for hosting. The den/study provides a quiet space for work, relaxation or card games. Talavera tile-edged steps lead to a spacious owner’s suite featuring a luxurious ensuite bath with dual vanities and large walk-in shower with floor-to-ceiling tile, stone accents, rain-head & hand-held faucet. Bath has French door, useful as pool bath. Suite includes an extra-large walk-in closet. The home’s split floorplan with 2 spacious guest bedrooms served by large full bath with shower, whirlpool tub and solar tube lighting. Other features include 3 newer air conditioning systems (one mini-split in garage), 20KW whole-house Generac generator, buried 500-gallon propane tank, newer tile roof and PGT impact windows /sliders. The oversized garage, with epoxy flooring, New Age Bold Series cabinets/workbench. Located minutes from Marco Island’s best shopping, dining and beaches. Experience the LIFESTYLE with an assumable loan with a modest interest rate!
Build Your Team
Quickly find investor-friendly professionals who can help you succeed in real estate investing at any stage of the investing journey.


Agents
Match with investor-friendly agents who can help you find, analyze, and close your next deal


Lenders
Get the best funding…find investor-friendly lenders who specialize in your deal strategy


Property Managers
Transition to passive investing. Find a trusted property management partnership that lasts.


Tax Pros & Accountants
Taxes and financial reporting made easy—find experts to create tax savings strategies, file taxes, and more
Location
Property Details
Parking
- Description: Attached, Driveway, Garage, Paved, OnStreet, GarageDoorOpener
- Details: Attached, Driveway, Garage, Paved, On Street, Garage Door Opener
- Garage Spaces: 2
- Spaces Total: 0
Bedroom Information
- # of Bedrooms: 3
Bathroom Information
- # of Baths (Full): 2
- # of Baths (Partial): 1
- # of Baths (Total): 3.0
Interior Features
- # of Stories: 1
Exterior Features
- Roof Material: Tile
- Pool: Yes
- Solar Panels: Yes
Land Information
- Land Use: Residential
- Land Use Subtype: Single Family Residential
Lot Information
- Parcel ID: 56941880003
- Lot Size: 0 sqft
Property Information
- Property Type: Single Family Residence
- Style: Ranch, One Story
- Year Built: 1972
Tax Information
- Annual Tax: $1,212
Utilities
- Water & Sewer: Public
- Heating: Central, Electric, Zoned
- Cooling: Central Air, Ceiling Fan(s), Electric
Location
- County: Collier
Listing Details
Investment Summary
- Monthly Cash Flow
- -$9,233
- Cap Rate
- 2.4%
- Cash-on-Cash Return
- -16.1%
- Debt Coverage Ratio
- 0.40
- Internal Rate of Return (5 years)
- -11.6%
Cash Flow
Net Operating Income (NOI) minus mortgage payments.
Calculation:
NOI - Mortgage Payments
Cap Rate (Market Value)
Capitalization Rate is a rate of return that compares the yearly Net Operating Income (NOI) to the market value.
Calculation:
NOI / Market Value
Cash-on-Cash Return (CoC)
Annual Cash Flow / Cash Invested
Calculation:
Annual cash flow divided by initial cash invested.
Debt Coverage Ratio (DCR)
Net Operating Income (NOI) divided by total debt payments.
Calculation:
NOI / Total Debt Payments
Internal Rate of Return (IRR)
A metric for assessing profitability over time. IRR is the discount rate at which the net present value (NPV) of all future cash flows (positive and negative) from an investment equals zero — including both periodic cash flow (such as rent) and a projected sale at the end of the holding period. It represents the expected annualized return, accounting for income, expenses, and the recovery of capital through a future sale.
Purchase Details
Purchase PriceThe price paid for the property. Purchase price:
| $2,995,000 |
|---|---|
Amount FinancedThe amount of the purchase financed through a loan. Amount financed:
| -$2,396,000 |
Down paymentThe initial payment made towards the purchase. Down payment:
| $599,000 |
Closing CostsFees and expenses associated with purchasing a property, typically ranging from 2% to 5% of the home’s purchase price, paid at the end of a home purchase to cover services like lending, title transfer, and taxes. Closing costs:
| $89,850 |
Rehab CostsCosts incurred to repair or improve the property, including: roof, flooring, exterior siding, kitchen, exterior paint, bathrooms, etc. Rehab costs:
| $0 |
Initial Cash InvestedThe total initial cash invested in the property. Calculation:Down payment + Buying costs + Rehab costs Initial cash invested:
| $688,850 |
Square Feet (SQFT)The total square footage of the property. Square feet:
| 2,527 |
Cost Per Square FootCost per square foot of the property. Calculation:Purchase Price / Square Feet Cost per square foot:
| $1,185 |
Monthly Rent Per Square FootMonthly rent divided by the number of square feet. This ratio helps investors compare rental income efficiency across properties, markets, and unit sizes Calculation:Monthly Rent / Square Feet Monthly rent per square foot:
| $3.56 |
Financing Details
Loan AmountThe total sum of money borrowed from a lender to finance a property purchase. Calculation:Purchase Price - Down Payment
Loan amount:
| $2,396,000 |
|---|---|
Loan to Value Ratio (LTV)Loan amount divided by the market value of the property. Calculation:Loan Amount / Market Value
Loan to value ratio:
| 80.0% |
Loan TypeThe type of loan (e.g., fixed, adjustable).
Loan type:
| Amortizing |
TermThe loan repayment period in years.
Term:
| 30 years |
Interest RateThe percentage a lender charges on the borrowed amount of a loan, determining the cost of borrowing money.
Interest rate:
| 6.625% |
Principal & Interest (PI)The principal is the portion of the loan payment that reduces the loan balance. The interest is the lender's charge for borrowing money. Calculation:(P * r * (1 + r) ** n) / ((1 + r) ** n - 1) Where:
P = Loan amount (principal)
Principal & interest:
| $15,342 |
Property TaxesAnnual taxes levied by local governments on real estate properties. These taxes fund public services like schools, roads, and emergency services.
Property tax:
| $101 |
InsuranceThe costs for insurance coverage to protect against financial losses due to risks like fire, natural disasters, theft, liability, or tenant-related damages. Calculation:Assumes 7% of gross rental income, unless insurance rates are specified.
Insurance:
| $630 |
Private Mortgage Insurance (PMI)A fee that borrowers pay when they take out a conventional loan with a loan-to-value (LTV) ratio above 80%.
Private mortgage insurance (PMI):
| $0 |
Monthly PaymentThe fixed amount a borrower pays each month to repay a loan. It typically includes principal and interest (P&I) and may also cover property taxes, insurance, HOA fees, and PMI if escrowed. Monthly payment:
| $16,073 |
Operating Income
| % Rent | Monthly | Yearly | |
|---|---|---|---|
Gross RentThe total rental income received from tenants before deducting any expenses. Includes base rent, late fees, pet fees, parking fees, and other recurring charges.
Gross rent:
| $9,000 | $108,000 | |
Vacancy LossExpected loss of rent due to vacancies.
Vacancy loss:
(6%)
| 6% | -$540 | -$6,480 |
Operating IncomeGross rental income minus vacancy loss. Calculation:Gross rent - Vacancy loss
Operating income:
| $8,460 | $101,520 |
Operating Expenses
| % Rent | Monthly | Yearly | |
|---|---|---|---|
Property TaxesAnnual taxes levied by local governments on real estate properties. These taxes fund public services like schools, roads, and emergency services. | 1% | -$101 | -$1,213 |
InsuranceThe costs for insurance coverage to protect against financial losses due to risks like fire, natural disasters, theft, liability, or tenant-related damages. Calculation:Assumes 7% of gross rental income, unless insurance rates are specified. | 7% | -$630 | -$7,560 |
Property ManagementThe costs associated with hiring a property manager to handle the day-to-day operations of a rental property. Includes management fees, leasing fes, eviction fees, etc. Calculation:Assumes 8% of gross rental income. | 8% | -$720 | -$8,640 |
Repairs & MaintenanceOngoing costs for routine upkeep and minor fixes needed to keep a property in good working condition. Calculation:Assumes 5% of gross rental income. Varies by property age and condition. | 5% | -$450 | -$5,400 |
Capital ExpensesLarge, infrequent costs for major improvements or replacements, like a new roof, HVAC system, or appliances. Calculation:Assumes 5% of gross rental income. Varies by property age. | 5% | -$450 | -$5,400 |
HOA FeesRegular dues paid to a Homeowners Association for community maintenance, amenities, and management. Similar fees include: Condo Association Fees, Co-op Maintenance Fees, etc. | n/a | n/a | n/a |
Operating ExpensesRecurring costs required to maintain and manage a rental property, including property taxes, insurance, maintenance, repairs, utilities (if paid by the owner), property management fees, and other day-to-day expenses. Calculation:Insurance + Property Taxes + Property Management + Repairs & Maintenance + Capital Expenditures + HOA Fees | 26% | -$2,351 | -$28,213 |
Cash Flow
| Monthly | Yearly | |
|---|---|---|
Net Operating Income (NOI)The income generated from a property after deducting all operating expenses but before deducting mortgage payments, taxes, and capital expenditures. Calculation:Gross Operating Income - Operating Expenses
Net operating income:
| $6,109 | $73,308 |
Mortgage PaymentThe fixed amount a borrower pays each month to repay a loan. It typically includes principal and interest (P&I) and may also cover property taxes, insurance, HOA fees, and PMI if escrowed. | -$15,342 | -$184,104 |
Cash FlowNet Operating Income (NOI) minus mortgage payments. Calculation:NOI - Mortgage Payments | $9,233 | $110,796 |