$325,000
Investment Summary
- Monthly Cash Flow
- -$461
- Cap Rate
- 4.6%
- Cash-on-Cash Return
- -7.4%
- Debt Coverage Ratio
- 0.73
- Internal Rate of Return (5 years)
- -3.2%
Cash Flow
Net Operating Income (NOI) minus mortgage payments.
Calculation:
NOI - Mortgage Payments
Cap Rate (Market Value)
Capitalization Rate is a rate of return that compares the yearly Net Operating Income (NOI) to the market value.
Calculation:
NOI / Market Value
Cash-on-Cash Return (CoC)
Annual Cash Flow / Cash Invested
Calculation:
Annual cash flow divided by initial cash invested.
Debt Coverage Ratio (DCR)
Net Operating Income (NOI) divided by total debt payments.
Calculation:
NOI / Total Debt Payments
Internal Rate of Return (IRR)
A metric for assessing profitability over time. IRR is the discount rate at which the net present value (NPV) of all future cash flows (positive and negative) from an investment equals zero — including both periodic cash flow (such as rent) and a projected sale at the end of the holding period. It represents the expected annualized return, accounting for income, expenses, and the recovery of capital through a future sale.
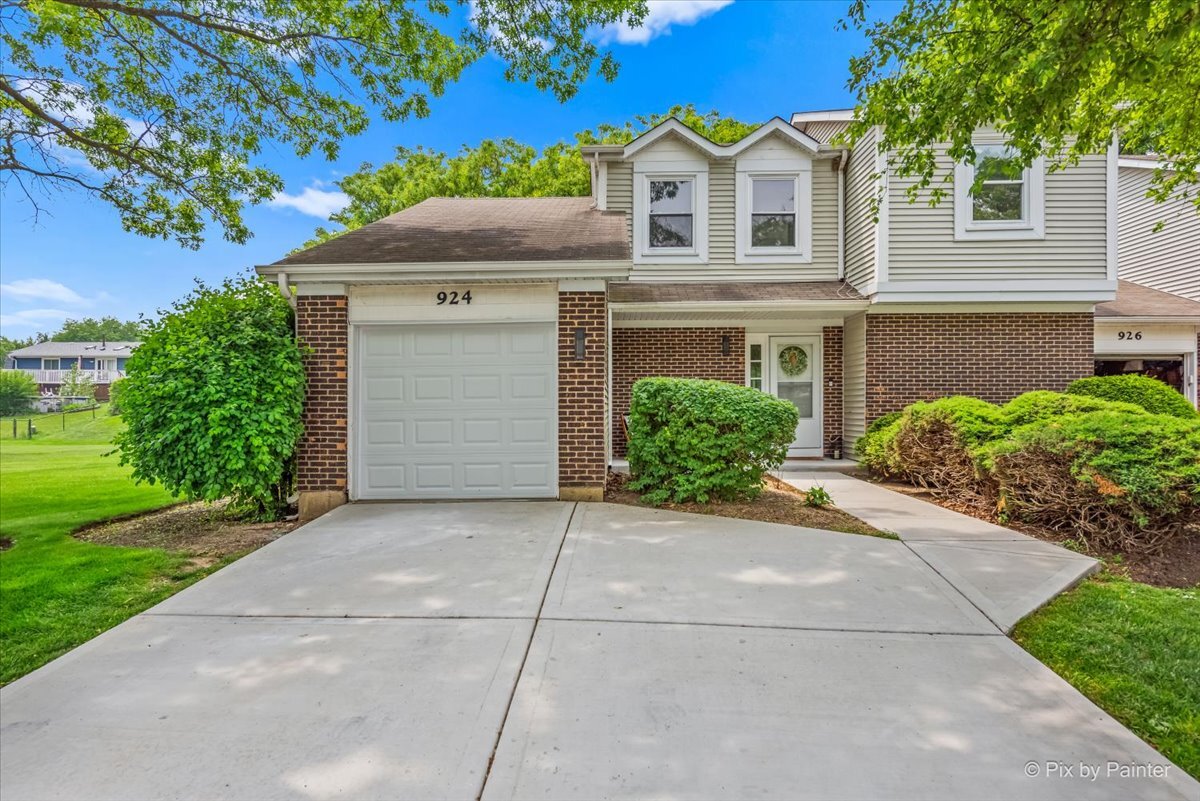
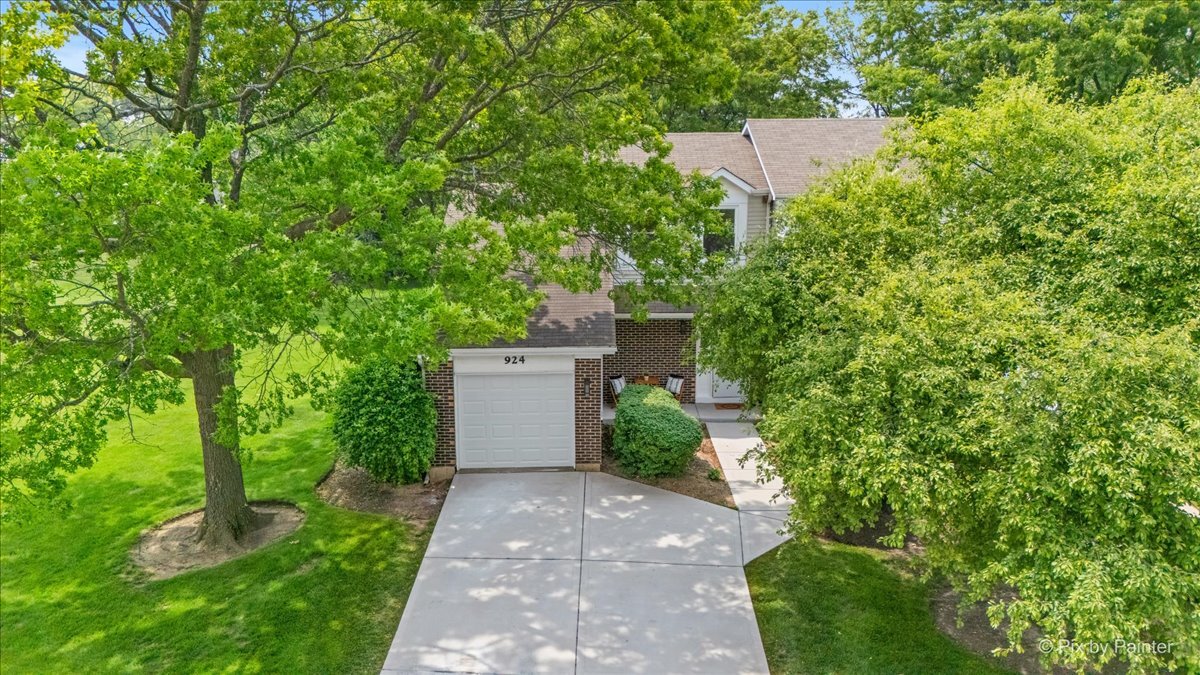
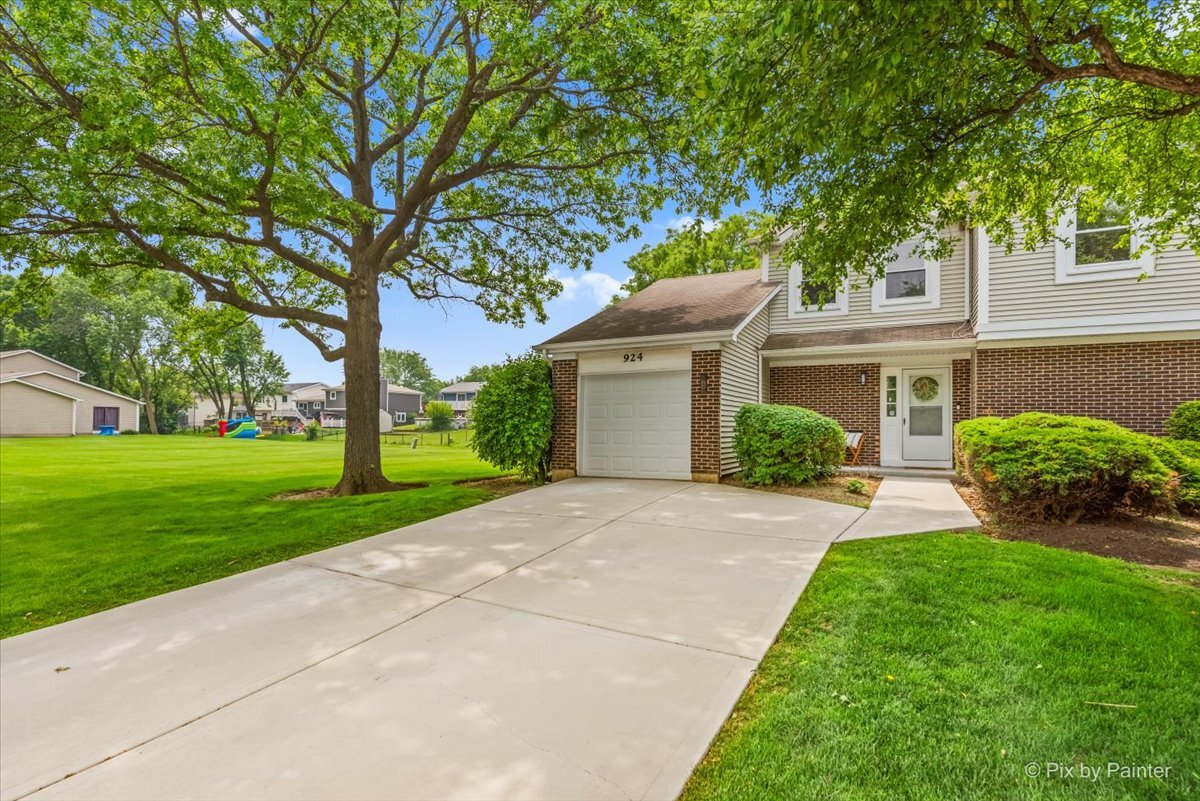
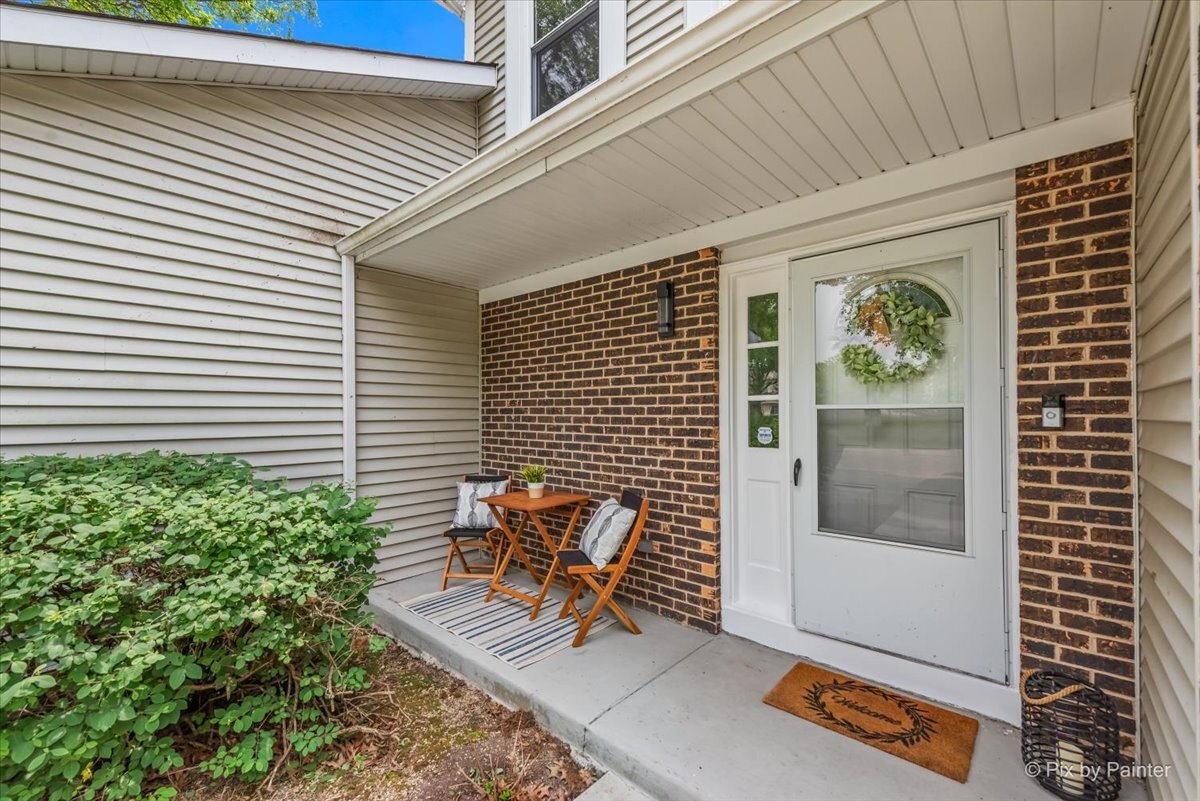
Property Description
Welcome Home! 924 Colony Lake Drive is a beautifully updated 3-bedroom, 2-full bath townhome with an attached 1 car garage perfectly situated in the desirable Colony Lakes subdivision of Schaumburg. From the moment you arrive, this exceptional unit sets itself apart with a recently poured extra-wide concrete driveway large enough for 4 cars and, being an end unit, there is a large green space which adds privacy immediately on the south side of the home that most other units simply do not enjoy, PLUS you get the added bonus of serene views overlooking one of the Colony Lakes which offers a rare sense of peace, tranquility and natural beauty. The front porch sitting area is your oasis allowing you to relax while enjoying the lake views sipping your favorite beverage and taking in the breeze. Step inside and you'll immediately feel the warmth and care that has gone into every inch of this home. Rich Brazilian Cherry Hardwood Floors have been completely refinished and add a sense of elegance and luxury that flows throughout the main level, where the thoughtful layout blends comfort and functionality. The bright, updated kitchen features stainless steel LG appliances, updated cabinetry, quartz countertops, beautifully tiled backsplashes, under cabinet lights and recessed lighting which all opens into your perfectly sized dining area - ideal for both everyday meals and special gatherings. The spacious living room, anchored by a cozy marble surround gas start, wood burning fireplace and a grand, soaring vaulted ceiling with stately wood beams add an old world charm. The 1st floor bedroom with double glass paneled entry doors along with an adjacent updated full bath provides the flexibility of an in-law arrangement, convenient guest suite or the perfect office. Glass sliding doors from both the office/bedroom and the living room lead to your private patio-perfect for grilling, entertaining, or simply enjoying a peaceful summer evening outdoors. Upstairs, two additional bedrooms and a beautifully updated full bath complete the home, with the primary suite offering a freshly painted private balcony to start or end your day with a breath of fresh air. Plenty of New Too! Freshly Painted in Many Rooms (2025), Many New Light Fixtures / Primary Bedroom Ceiling Fan (2025), Furnace (2023), A/C (2023), Refrigerator (2023), Oven (2023), Dishwasher (2023), Range Hood (2023), Quartz Counters (2023), Washer and Dryer (2018), Water Heater (2015), New Garage Door and Opener (2025). Ring Doorbell and Ecobee thermostat are also Included! All this, just moments from major highways, top-rated schools, beautiful Colony Lake Park and Zocher Park featuring Tennis Courts and Baseball Fields PLUS the nearby "Water Works" Indoor Water Park featuring slides, rapids, water playground & lap pool. A rare opportunity awaits so schedule your private tour immediately before this beauty is gone!
Build Your Team
Quickly find investor-friendly professionals who can help you succeed in real estate investing at any stage of the investing journey.


Agents
Match with investor-friendly agents who can help you find, analyze, and close your next deal


Lenders
Get the best funding…find investor-friendly lenders who specialize in your deal strategy


Property Managers
Transition to passive investing. Find a trusted property management partnership that lasts.


Tax Pros & Accountants
Taxes and financial reporting made easy—find experts to create tax savings strategies, file taxes, and more
Location
Property Details
Parking
- Description: Attached Garage
- Details: Concrete, Garage Door Opener, On Site, Attached, Driveway, Oversized, Garage
- Garage Spaces: 1
- Spaces Total: 5
Bedroom Information
- # of Bedrooms: 3
Bathroom Information
- # of Baths (Full): 2
- # of Baths (Total): 2.0
Interior Features
- # of Rooms: 6
- # of Stories: 2
- Basement: Yes
- Basement Description: Sump Pump, Crawl Space
- Fireplace: Yes
Exterior Features
- Exterior Walls Materials: Wood
- Foundation: Concrete Perimeter
- Roof Material: Asphalt
HOA
- Has HOA: Yes
- HOA Fee: $185/monthly
Land Information
- Land Use: Residential
- Land Use Subtype: Townhouse
Lot Information
- Parcel ID: 0716106074
- Lot Size: 0 sqft
Property Information
- Property Type: Townhouse
- Year Built: 1980
Tax Information
- Annual Tax: $6,073
Utilities
- Heating: Natural Gas
- Cooling: Ceiling Fan(s), Central Air
Location
- County: Cook
Listing Details
Investment Summary
- Monthly Cash Flow
- -$461
- Cap Rate
- 4.6%
- Cash-on-Cash Return
- -7.4%
- Debt Coverage Ratio
- 0.73
- Internal Rate of Return (5 years)
- -3.2%
Cash Flow
Net Operating Income (NOI) minus mortgage payments.
Calculation:
NOI - Mortgage Payments
Cap Rate (Market Value)
Capitalization Rate is a rate of return that compares the yearly Net Operating Income (NOI) to the market value.
Calculation:
NOI / Market Value
Cash-on-Cash Return (CoC)
Annual Cash Flow / Cash Invested
Calculation:
Annual cash flow divided by initial cash invested.
Debt Coverage Ratio (DCR)
Net Operating Income (NOI) divided by total debt payments.
Calculation:
NOI / Total Debt Payments
Internal Rate of Return (IRR)
A metric for assessing profitability over time. IRR is the discount rate at which the net present value (NPV) of all future cash flows (positive and negative) from an investment equals zero — including both periodic cash flow (such as rent) and a projected sale at the end of the holding period. It represents the expected annualized return, accounting for income, expenses, and the recovery of capital through a future sale.
Purchase Details
Purchase PriceThe price paid for the property. Purchase price:
| $325,000 |
|---|---|
Amount FinancedThe amount of the purchase financed through a loan. Amount financed:
| -$260,000 |
Down paymentThe initial payment made towards the purchase. Down payment:
| $65,000 |
Closing CostsFees and expenses associated with purchasing a property, typically ranging from 2% to 5% of the home’s purchase price, paid at the end of a home purchase to cover services like lending, title transfer, and taxes. Closing costs:
| $9,750 |
Rehab CostsCosts incurred to repair or improve the property, including: roof, flooring, exterior siding, kitchen, exterior paint, bathrooms, etc. Rehab costs:
| $0 |
Initial Cash InvestedThe total initial cash invested in the property. Calculation:Down payment + Buying costs + Rehab costs Initial cash invested:
| $74,750 |
Square Feet (SQFT)The total square footage of the property. Square feet:
| 1,654 |
Cost Per Square FootCost per square foot of the property. Calculation:Purchase Price / Square Feet Cost per square foot:
| $196 |
Monthly Rent Per Square FootMonthly rent divided by the number of square feet. This ratio helps investors compare rental income efficiency across properties, markets, and unit sizes Calculation:Monthly Rent / Square Feet Monthly rent per square foot:
| $1.69 |
Financing Details
Loan AmountThe total sum of money borrowed from a lender to finance a property purchase. Calculation:Purchase Price - Down Payment
Loan amount:
| $260,000 |
|---|---|
Loan to Value Ratio (LTV)Loan amount divided by the market value of the property. Calculation:Loan Amount / Market Value
Loan to value ratio:
| 80.0% |
Loan TypeThe type of loan (e.g., fixed, adjustable).
Loan type:
| Amortizing |
TermThe loan repayment period in years.
Term:
| 30 years |
Interest RateThe percentage a lender charges on the borrowed amount of a loan, determining the cost of borrowing money.
Interest rate:
| 6.840% |
Principal & Interest (PI)The principal is the portion of the loan payment that reduces the loan balance. The interest is the lender's charge for borrowing money. Calculation:(P * r * (1 + r) ** n) / ((1 + r) ** n - 1) Where:
P = Loan amount (principal)
Principal & interest:
| $1,702 |
Property TaxesAnnual taxes levied by local governments on real estate properties. These taxes fund public services like schools, roads, and emergency services.
Property tax:
| $506 |
InsuranceThe costs for insurance coverage to protect against financial losses due to risks like fire, natural disasters, theft, liability, or tenant-related damages. Calculation:Assumes 7% of gross rental income, unless insurance rates are specified.
Insurance:
| $196 |
Private Mortgage Insurance (PMI)A fee that borrowers pay when they take out a conventional loan with a loan-to-value (LTV) ratio above 80%.
Private mortgage insurance (PMI):
| $0 |
Monthly PaymentThe fixed amount a borrower pays each month to repay a loan. It typically includes principal and interest (P&I) and may also cover property taxes, insurance, HOA fees, and PMI if escrowed. Monthly payment:
| $2,404 |
Operating Income
| % Rent | Monthly | Yearly | |
|---|---|---|---|
Gross RentThe total rental income received from tenants before deducting any expenses. Includes base rent, late fees, pet fees, parking fees, and other recurring charges.
Gross rent:
| $2,800 | $33,600 | |
Vacancy LossExpected loss of rent due to vacancies.
Vacancy loss:
(6%)
| 6% | -$168 | -$2,016 |
Operating IncomeGross rental income minus vacancy loss. Calculation:Gross rent - Vacancy loss
Operating income:
| $2,632 | $31,584 |
Operating Expenses
| % Rent | Monthly | Yearly | |
|---|---|---|---|
Property TaxesAnnual taxes levied by local governments on real estate properties. These taxes fund public services like schools, roads, and emergency services. | 18% | -$506 | -$6,074 |
InsuranceThe costs for insurance coverage to protect against financial losses due to risks like fire, natural disasters, theft, liability, or tenant-related damages. Calculation:Assumes 7% of gross rental income, unless insurance rates are specified. | 7% | -$196 | -$2,352 |
Property ManagementThe costs associated with hiring a property manager to handle the day-to-day operations of a rental property. Includes management fees, leasing fes, eviction fees, etc. Calculation:Assumes 8% of gross rental income. | 8% | -$224 | -$2,688 |
Repairs & MaintenanceOngoing costs for routine upkeep and minor fixes needed to keep a property in good working condition. Calculation:Assumes 5% of gross rental income. Varies by property age and condition. | 5% | -$140 | -$1,680 |
Capital ExpensesLarge, infrequent costs for major improvements or replacements, like a new roof, HVAC system, or appliances. Calculation:Assumes 5% of gross rental income. Varies by property age. | 5% | -$140 | -$1,680 |
HOA FeesRegular dues paid to a Homeowners Association for community maintenance, amenities, and management. Similar fees include: Condo Association Fees, Co-op Maintenance Fees, etc. | 7% | -$185 | -$2,220 |
Operating ExpensesRecurring costs required to maintain and manage a rental property, including property taxes, insurance, maintenance, repairs, utilities (if paid by the owner), property management fees, and other day-to-day expenses. Calculation:Insurance + Property Taxes + Property Management + Repairs & Maintenance + Capital Expenditures + HOA Fees | 50% | -$1,391 | -$16,694 |
Cash Flow
| Monthly | Yearly | |
|---|---|---|
Net Operating Income (NOI)The income generated from a property after deducting all operating expenses but before deducting mortgage payments, taxes, and capital expenditures. Calculation:Gross Operating Income - Operating Expenses
Net operating income:
| $1,241 | $14,892 |
Mortgage PaymentThe fixed amount a borrower pays each month to repay a loan. It typically includes principal and interest (P&I) and may also cover property taxes, insurance, HOA fees, and PMI if escrowed. | -$1,702 | -$20,424 |
Cash FlowNet Operating Income (NOI) minus mortgage payments. Calculation:NOI - Mortgage Payments | $461 | $5,532 |