$1,299,999
Investment Summary
- Monthly Cash Flow
- -$5,089
- Cap Rate
- 1.6%
- Cash-on-Cash Return
- -20.4%
- Debt Coverage Ratio
- 0.25
- Internal Rate of Return (5 years)
- -15.7%
Cash Flow
Net Operating Income (NOI) minus mortgage payments.
Calculation:
NOI - Mortgage Payments
Cap Rate (Market Value)
Capitalization Rate is a rate of return that compares the yearly Net Operating Income (NOI) to the market value.
Calculation:
NOI / Market Value
Cash-on-Cash Return (CoC)
Annual Cash Flow / Cash Invested
Calculation:
Annual cash flow divided by initial cash invested.
Debt Coverage Ratio (DCR)
Net Operating Income (NOI) divided by total debt payments.
Calculation:
NOI / Total Debt Payments
Internal Rate of Return (IRR)
A metric for assessing profitability over time. IRR is the discount rate at which the net present value (NPV) of all future cash flows (positive and negative) from an investment equals zero — including both periodic cash flow (such as rent) and a projected sale at the end of the holding period. It represents the expected annualized return, accounting for income, expenses, and the recovery of capital through a future sale.
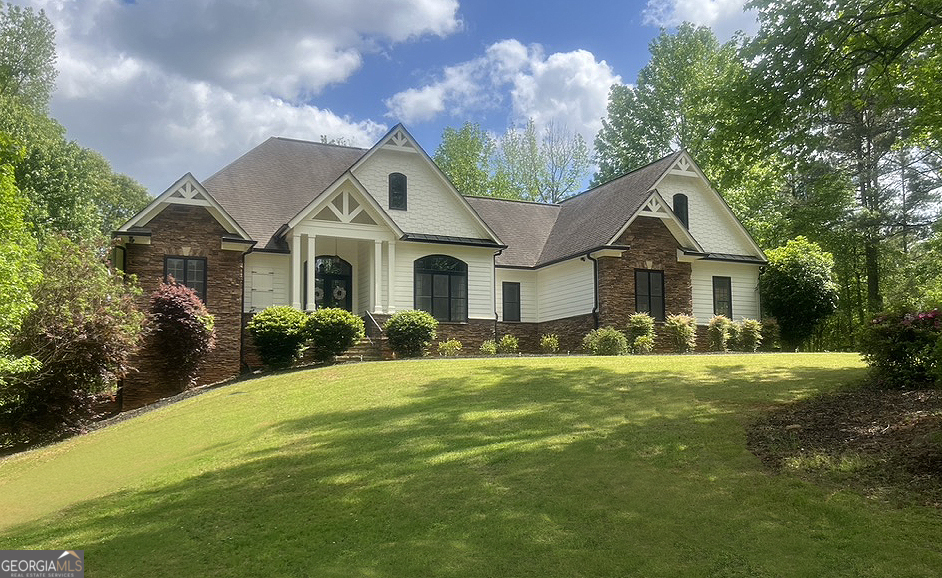
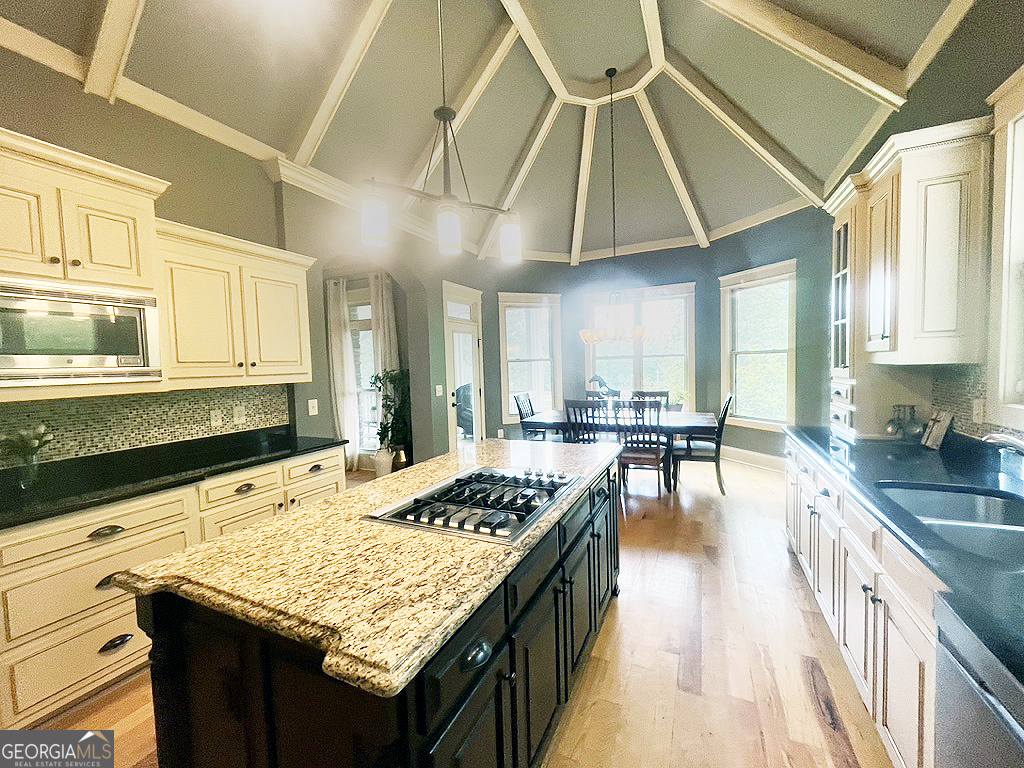
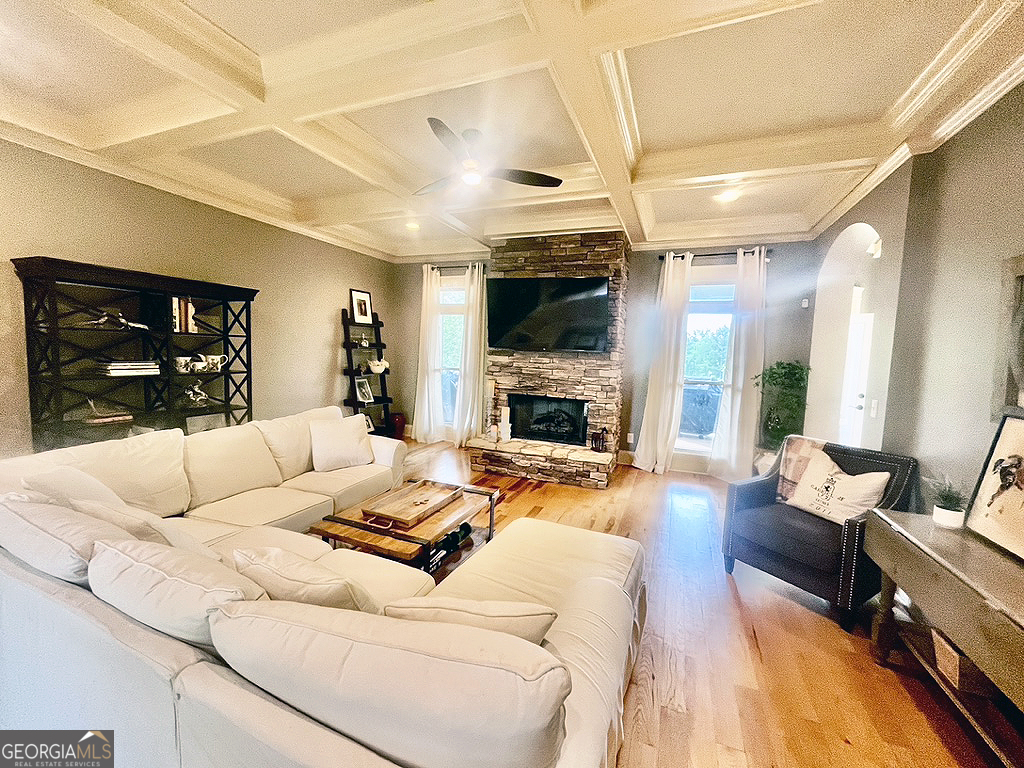
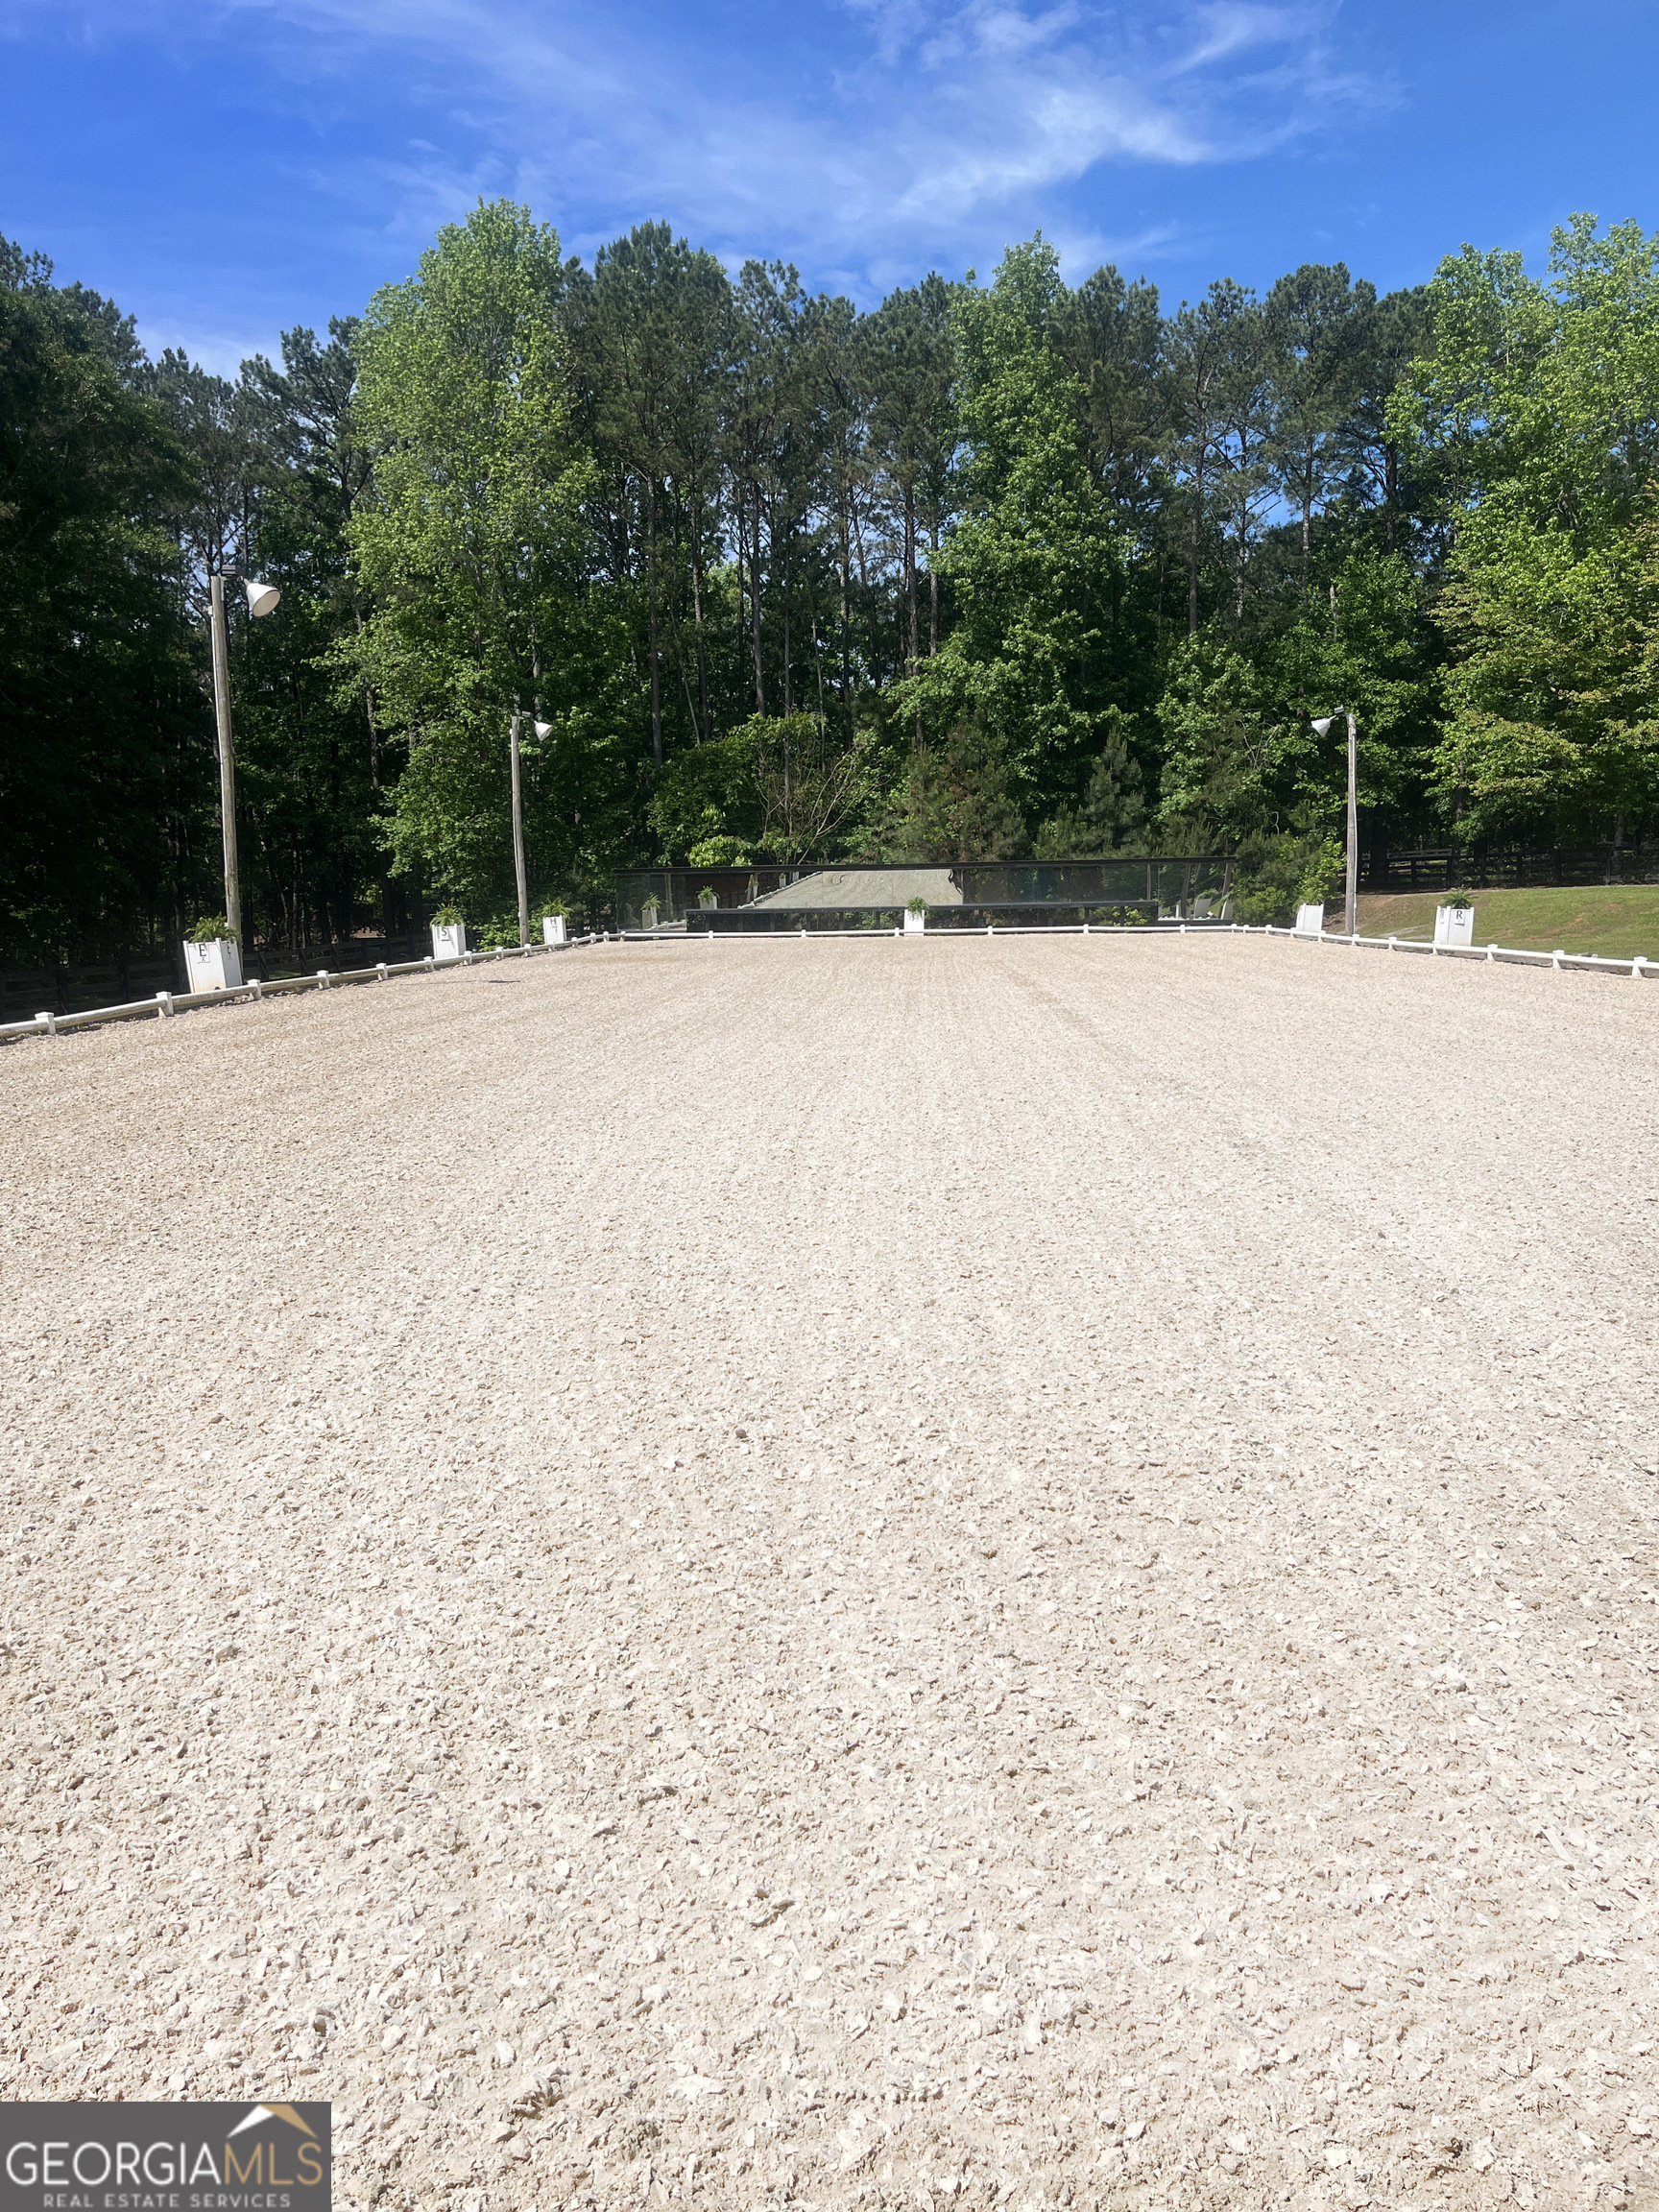
Property Description
MINUTES TO DOWNTOWN NEWNAN AND HIGHWAY I-85! Discover a RARE unparalleled luxury in this 2008 custom built equestrian estate on 14.36 acres. Pastoral views from almost every room are the highlight of this home. The floorpan is unique and is perfect for those who would like space and privacy. The master is on main floor and two oversized bedrooms are downstairs, each with a full en suite and walk in closets. A huge family room with outside covered porch access is perfect for entertaining. It encompasses 3 bedrooms, 3.5 bathrooms and an executive office with built in bookshelves. The ceilings throughout are high with unique beams and coffered details throughout the home. Striking hickory wood floors cover most of the home. The gourmet kitchen is a chef's dream, featuring ample custom cabinetry, center island with gas cooktop and double ovens. Granite countertops, stainless appliances, custom cabinetry, a walk-in food pantry, and a large bay window dining area overlooks the pastures, barn and arena. There is direct access to the screened in deck that has a wood burning and gas fireplace with stacked stone. Living spaces in this home are designed for comfort and elegance, with high ceilings everywhere and an impressive 18/19 ft vaulted and beamed ceiling in the kitchen. The master suite is a true retreat with an incredible view of your horses, featuring a double lighted trey ceiling, dual walk-in closets and direct access to the deck. Additional features of the home include a gas fireplace with a buried tank, two separate entrances/driveways (main house and barn) has a second barn that has three storage bays for your horse trailer, truck, hay, shavings or equipment. Climate control is managed by 2 AC units. Approximately 1,000 unfinished sq. ft. of the home is available to be finished if desired, bringing your square footage to nearly 4,500 sq ft. This could include a generous sized bonus room above the two car garage, along with additional unfinished sq. footage downstairs. Serious equestrians will appreciate the top-tier facilities, including a full regulation sized dressage arena professionally installed with German FS Geotex synthetic footing, full length mirrors, irrigation sprinklers and lights for night riding. The barn features 6 oversized stalls with fans, dutch doors with runouts on each, overhangs for protection, a large feed and tack room with washer, dryer and refrigerator. A half bathroom and wash stall with hot and cold water and fan. The property is fenced and cross fenced with four board fencing and electric. There are currently three separate pastures but it could be cross fenced even more. The neighborhood is very horse friendly with all estate sized properties and dirt/gravel roads providing plenty of hacking and places to explore. The convenience of this location simply cannot be beat. This equestrian estate is a must-see and is ready for you and your horses.
Build Your Team
Quickly find investor-friendly professionals who can help you succeed in real estate investing at any stage of the investing journey.


Agents
Match with investor-friendly agents who can help you find, analyze, and close your next deal


Lenders
Get the best funding…find investor-friendly lenders who specialize in your deal strategy


Property Managers
Transition to passive investing. Find a trusted property management partnership that lasts.


Tax Pros & Accountants
Taxes and financial reporting made easy—find experts to create tax savings strategies, file taxes, and more
Location
Property Details
Parking
- Description: Garage
- Details: Attached, Garage, Garage Door Opener, Storage
- Garage Spaces: 2
- Spaces Total: 2
Bedroom Information
- # of Bedrooms: 3
Bathroom Information
- # of Baths (Full): 3
- # of Baths (Partial): 1
- # of Baths (Total): 0.0
Interior Features
- # of Rooms: 7
- # of Stories: 2
- Basement: Yes
- Basement Description: Concrete, Exterior Entry, Interior Entry, Partial
- Fireplace: Yes
Exterior Features
- Exterior Walls Materials: Fiber cement siding (Hardi-board/Hardi-plank
- Foundation: Block, Slab
- Roof Type: Gable
- Roof Material: Composition
Land Information
- Land Use: Residential
- Land Use Subtype: Single Family Residential
Lot Information
- Parcel ID: 0772089007
- Lot Size: 0 sqft
Property Information
- Property Type: Single Family Residence
- Style: Craftsman
- Year Built: 2008
Tax Information
- Annual Tax: $5,871
Utilities
- Water & Sewer: Private, Well
- Heating: Electric, Zoned
- Cooling: Ceiling Fan(s), Central Air, Electric
Location
- County: Coweta
Investment Summary
- Monthly Cash Flow
- -$5,089
- Cap Rate
- 1.6%
- Cash-on-Cash Return
- -20.4%
- Debt Coverage Ratio
- 0.25
- Internal Rate of Return (5 years)
- -15.7%
Cash Flow
Net Operating Income (NOI) minus mortgage payments.
Calculation:
NOI - Mortgage Payments
Cap Rate (Market Value)
Capitalization Rate is a rate of return that compares the yearly Net Operating Income (NOI) to the market value.
Calculation:
NOI / Market Value
Cash-on-Cash Return (CoC)
Annual Cash Flow / Cash Invested
Calculation:
Annual cash flow divided by initial cash invested.
Debt Coverage Ratio (DCR)
Net Operating Income (NOI) divided by total debt payments.
Calculation:
NOI / Total Debt Payments
Internal Rate of Return (IRR)
A metric for assessing profitability over time. IRR is the discount rate at which the net present value (NPV) of all future cash flows (positive and negative) from an investment equals zero — including both periodic cash flow (such as rent) and a projected sale at the end of the holding period. It represents the expected annualized return, accounting for income, expenses, and the recovery of capital through a future sale.
Purchase Details
Purchase PriceThe price paid for the property. Purchase price:
| $1,299,999 |
|---|---|
Amount FinancedThe amount of the purchase financed through a loan. Amount financed:
| -$1,039,999 |
Down paymentThe initial payment made towards the purchase. Down payment:
| $260,000 |
Closing CostsFees and expenses associated with purchasing a property, typically ranging from 2% to 5% of the home’s purchase price, paid at the end of a home purchase to cover services like lending, title transfer, and taxes. Closing costs:
| $39,000 |
Rehab CostsCosts incurred to repair or improve the property, including: roof, flooring, exterior siding, kitchen, exterior paint, bathrooms, etc. Rehab costs:
| $0 |
Initial Cash InvestedThe total initial cash invested in the property. Calculation:Down payment + Buying costs + Rehab costs Initial cash invested:
| $299,000 |
Square Feet (SQFT)The total square footage of the property. Square feet:
| 3,213 |
Cost Per Square FootCost per square foot of the property. Calculation:Purchase Price / Square Feet Cost per square foot:
| $405 |
Monthly Rent Per Square FootMonthly rent divided by the number of square feet. This ratio helps investors compare rental income efficiency across properties, markets, and unit sizes Calculation:Monthly Rent / Square Feet Monthly rent per square foot:
| $1.00 |
Financing Details
Loan AmountThe total sum of money borrowed from a lender to finance a property purchase. Calculation:Purchase Price - Down Payment
Loan amount:
| $1,039,999 |
|---|---|
Loan to Value Ratio (LTV)Loan amount divided by the market value of the property. Calculation:Loan Amount / Market Value
Loan to value ratio:
| 80.0% |
Loan TypeThe type of loan (e.g., fixed, adjustable).
Loan type:
| Amortizing |
TermThe loan repayment period in years.
Term:
| 30 years |
Interest RateThe percentage a lender charges on the borrowed amount of a loan, determining the cost of borrowing money.
Interest rate:
| 6.840% |
Principal & Interest (PI)The principal is the portion of the loan payment that reduces the loan balance. The interest is the lender's charge for borrowing money. Calculation:(P * r * (1 + r) ** n) / ((1 + r) ** n - 1) Where:
P = Loan amount (principal)
Principal & interest:
| $6,808 |
Property TaxesAnnual taxes levied by local governments on real estate properties. These taxes fund public services like schools, roads, and emergency services.
Property tax:
| $489 |
InsuranceThe costs for insurance coverage to protect against financial losses due to risks like fire, natural disasters, theft, liability, or tenant-related damages. Calculation:Assumes 7% of gross rental income, unless insurance rates are specified.
Insurance:
| $224 |
Private Mortgage Insurance (PMI)A fee that borrowers pay when they take out a conventional loan with a loan-to-value (LTV) ratio above 80%.
Private mortgage insurance (PMI):
| $0 |
Monthly PaymentThe fixed amount a borrower pays each month to repay a loan. It typically includes principal and interest (P&I) and may also cover property taxes, insurance, HOA fees, and PMI if escrowed. Monthly payment:
| $7,521 |
Operating Income
| % Rent | Monthly | Yearly | |
|---|---|---|---|
Gross RentThe total rental income received from tenants before deducting any expenses. Includes base rent, late fees, pet fees, parking fees, and other recurring charges.
Gross rent:
| $3,200 | $38,400 | |
Vacancy LossExpected loss of rent due to vacancies.
Vacancy loss:
(6%)
| 6% | -$192 | -$2,304 |
Operating IncomeGross rental income minus vacancy loss. Calculation:Gross rent - Vacancy loss
Operating income:
| $3,008 | $36,096 |
Operating Expenses
| % Rent | Monthly | Yearly | |
|---|---|---|---|
Property TaxesAnnual taxes levied by local governments on real estate properties. These taxes fund public services like schools, roads, and emergency services. | 15% | -$489 | -$5,872 |
InsuranceThe costs for insurance coverage to protect against financial losses due to risks like fire, natural disasters, theft, liability, or tenant-related damages. Calculation:Assumes 7% of gross rental income, unless insurance rates are specified. | 7% | -$224 | -$2,688 |
Property ManagementThe costs associated with hiring a property manager to handle the day-to-day operations of a rental property. Includes management fees, leasing fes, eviction fees, etc. Calculation:Assumes 8% of gross rental income. | 8% | -$256 | -$3,072 |
Repairs & MaintenanceOngoing costs for routine upkeep and minor fixes needed to keep a property in good working condition. Calculation:Assumes 5% of gross rental income. Varies by property age and condition. | 5% | -$160 | -$1,920 |
Capital ExpensesLarge, infrequent costs for major improvements or replacements, like a new roof, HVAC system, or appliances. Calculation:Assumes 5% of gross rental income. Varies by property age. | 5% | -$160 | -$1,920 |
HOA FeesRegular dues paid to a Homeowners Association for community maintenance, amenities, and management. Similar fees include: Condo Association Fees, Co-op Maintenance Fees, etc. | n/a | n/a | n/a |
Operating ExpensesRecurring costs required to maintain and manage a rental property, including property taxes, insurance, maintenance, repairs, utilities (if paid by the owner), property management fees, and other day-to-day expenses. Calculation:Insurance + Property Taxes + Property Management + Repairs & Maintenance + Capital Expenditures + HOA Fees | 40% | -$1,289 | -$15,472 |
Cash Flow
| Monthly | Yearly | |
|---|---|---|
Net Operating Income (NOI)The income generated from a property after deducting all operating expenses but before deducting mortgage payments, taxes, and capital expenditures. Calculation:Gross Operating Income - Operating Expenses
Net operating income:
| $1,719 | $20,628 |
Mortgage PaymentThe fixed amount a borrower pays each month to repay a loan. It typically includes principal and interest (P&I) and may also cover property taxes, insurance, HOA fees, and PMI if escrowed. | -$6,808 | -$81,696 |
Cash FlowNet Operating Income (NOI) minus mortgage payments. Calculation:NOI - Mortgage Payments | $5,089 | $61,068 |