$579,500
Investment Summary
- Monthly Cash Flow
- -$330
- Cap Rate
- 5.5%
- Cash-on-Cash Return
- -3.0%
- Debt Coverage Ratio
- 0.89
- Internal Rate of Return (5 years)
- 1.1%
Cash Flow
Net Operating Income (NOI) minus mortgage payments.
Calculation:
NOI - Mortgage Payments
Cap Rate (Market Value)
Capitalization Rate is a rate of return that compares the yearly Net Operating Income (NOI) to the market value.
Calculation:
NOI / Market Value
Cash-on-Cash Return (CoC)
Annual Cash Flow / Cash Invested
Calculation:
Annual cash flow divided by initial cash invested.
Debt Coverage Ratio (DCR)
Net Operating Income (NOI) divided by total debt payments.
Calculation:
NOI / Total Debt Payments
Internal Rate of Return (IRR)
A metric for assessing profitability over time. IRR is the discount rate at which the net present value (NPV) of all future cash flows (positive and negative) from an investment equals zero — including both periodic cash flow (such as rent) and a projected sale at the end of the holding period. It represents the expected annualized return, accounting for income, expenses, and the recovery of capital through a future sale.
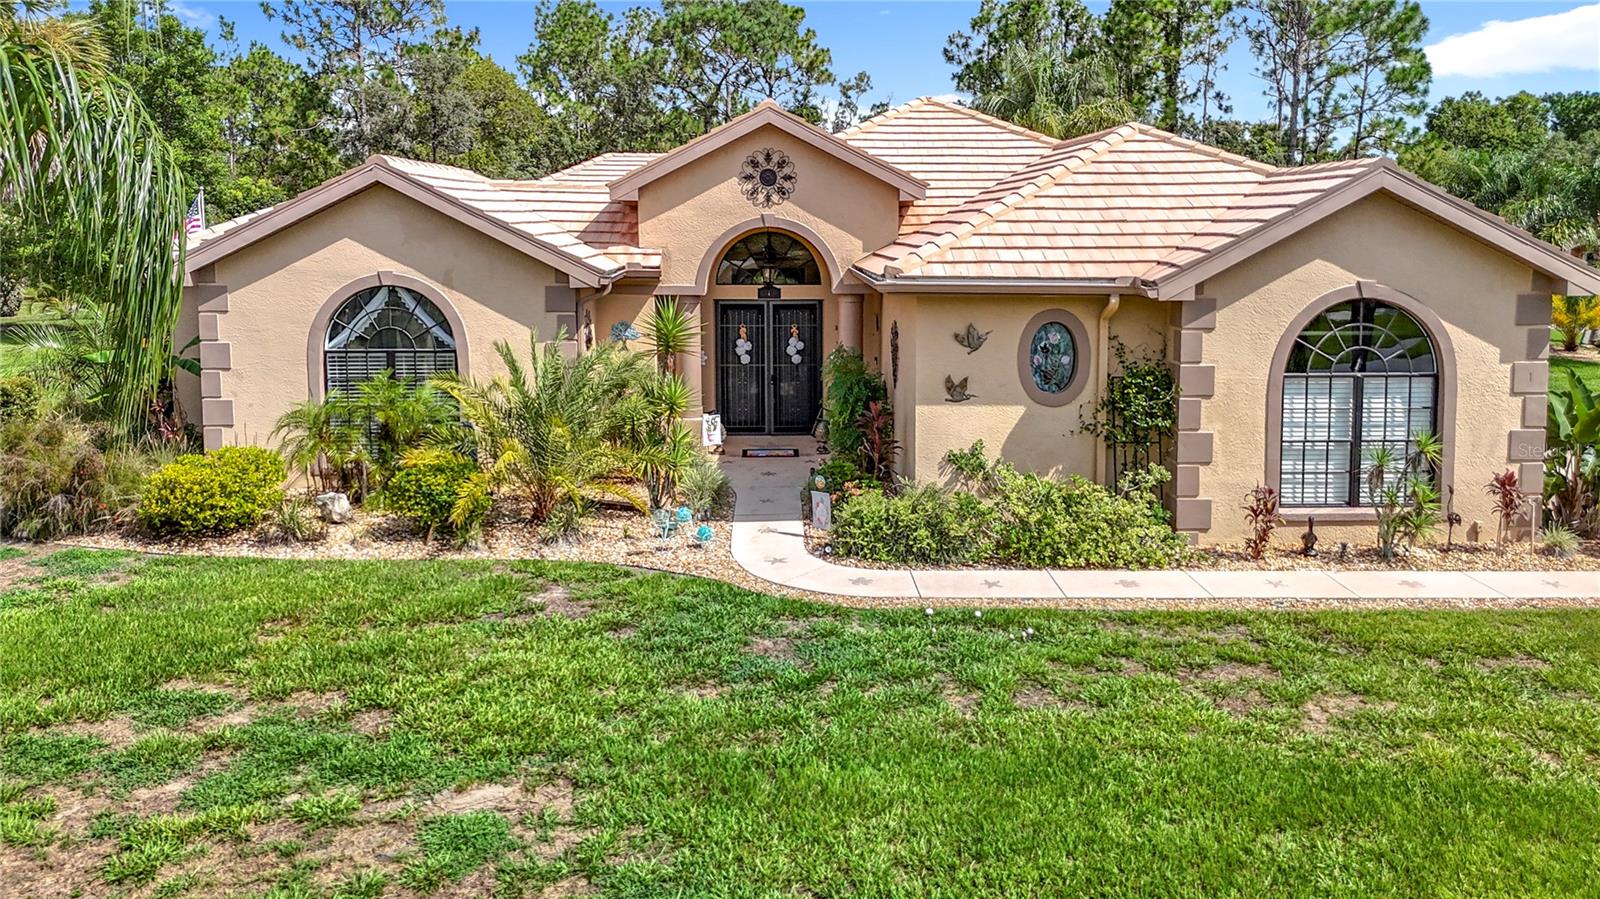
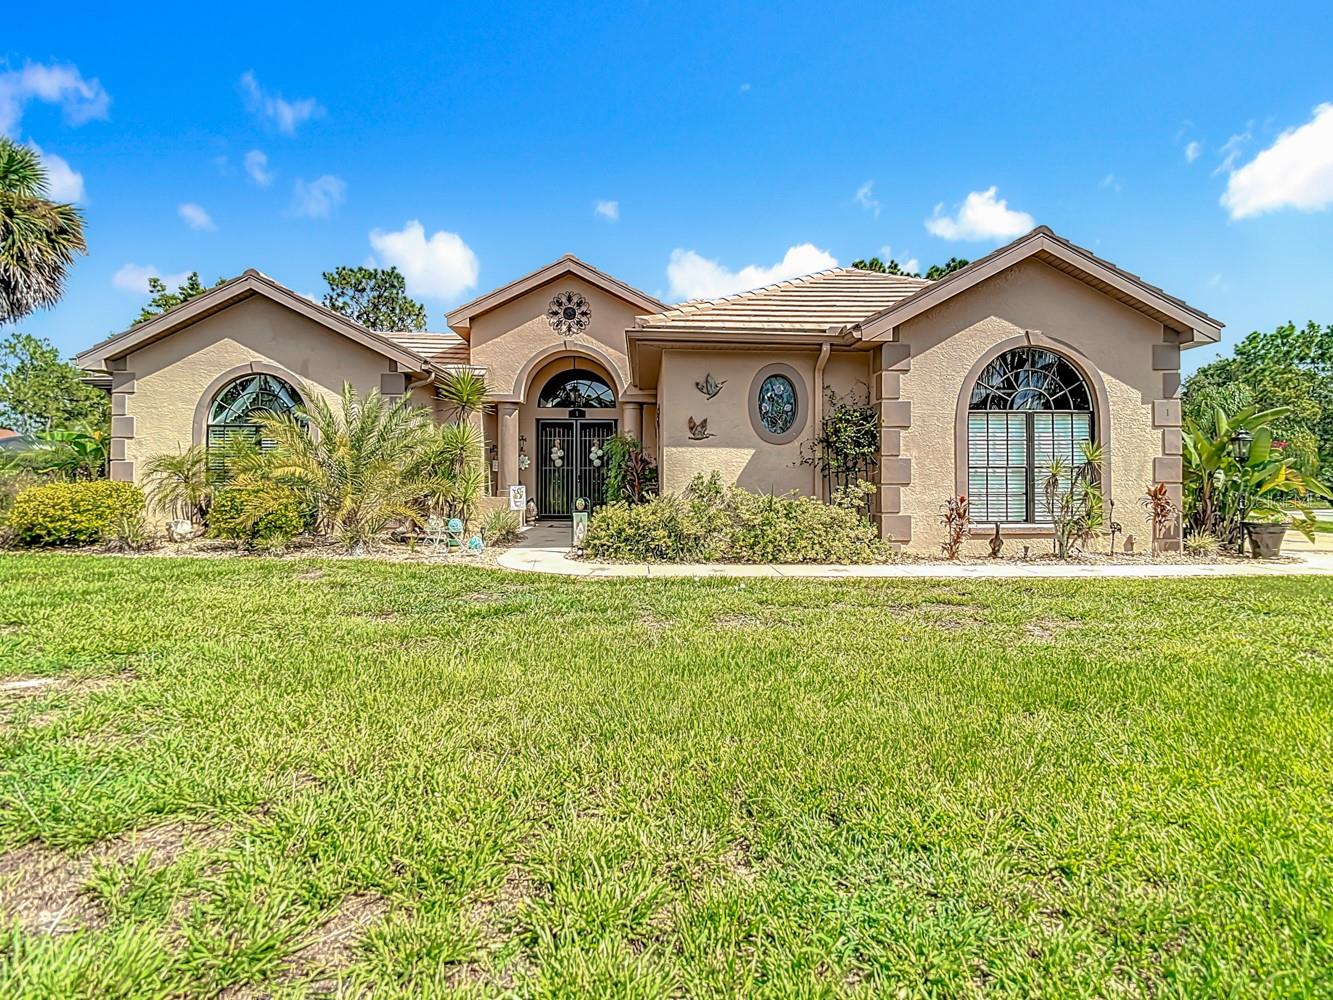
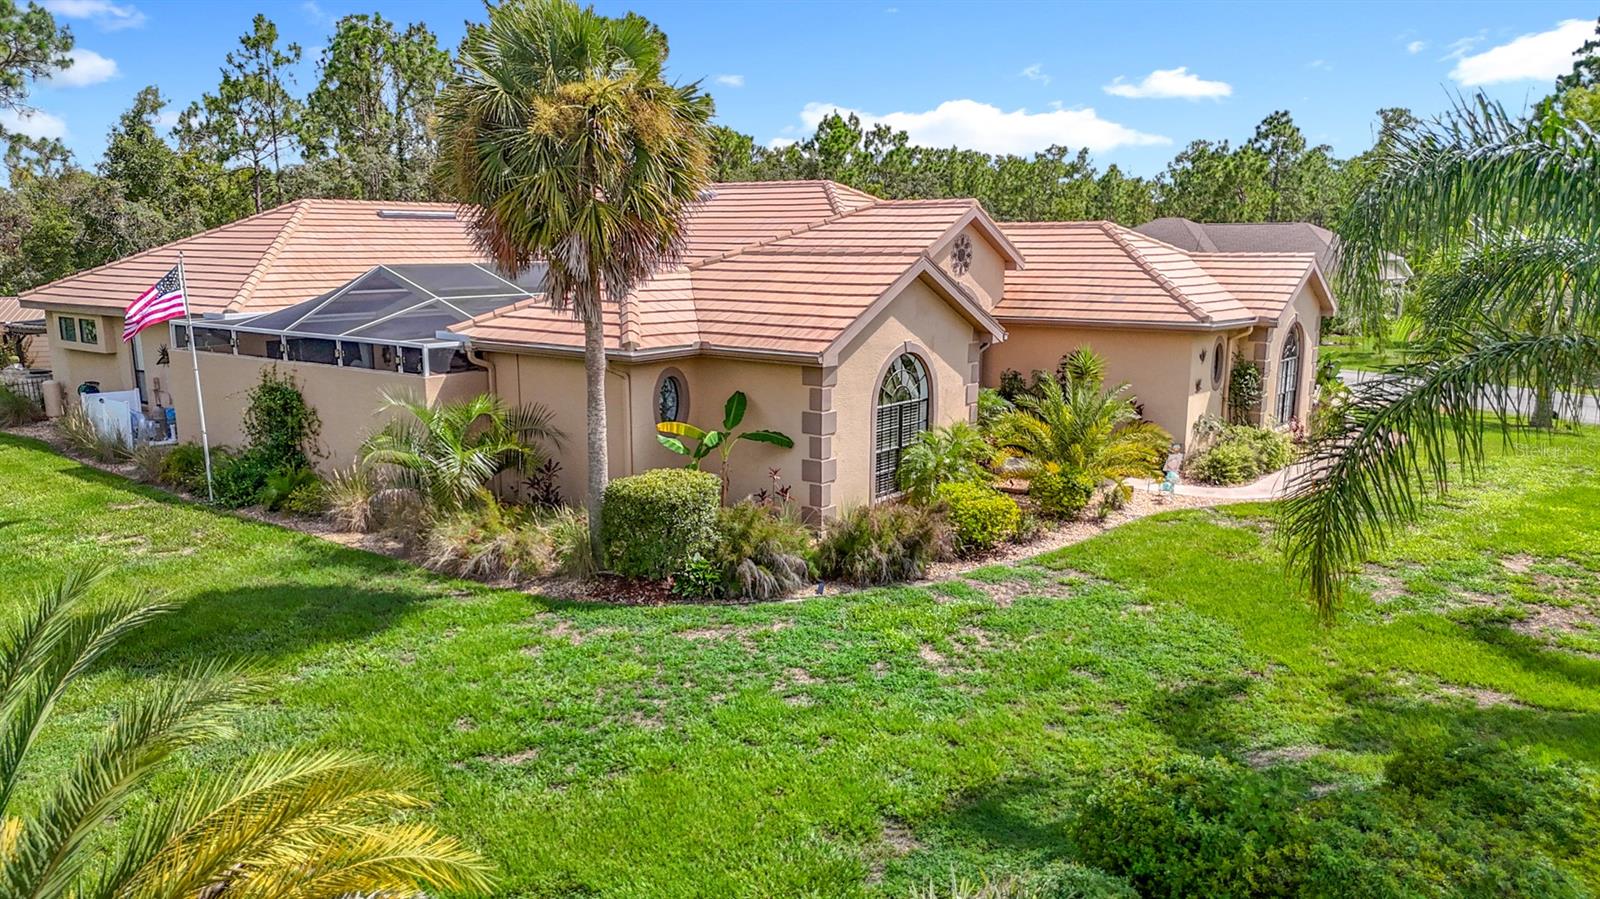
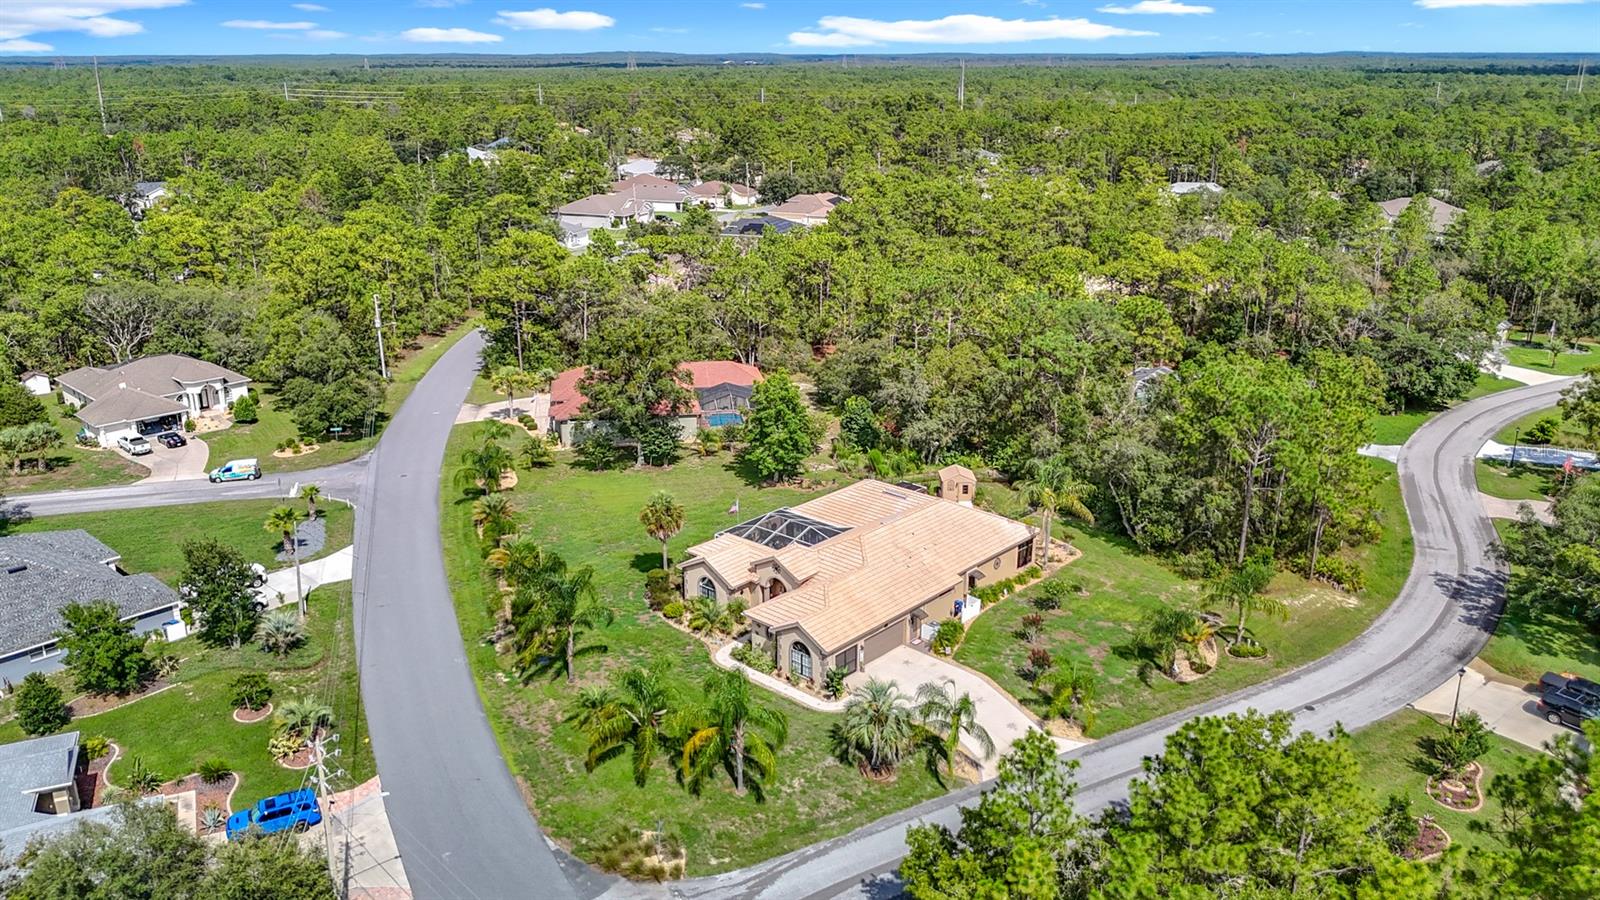
Property Description
Stunning 3 bedrooms + office, 3 bath + 3 car garage Cabana Pool Home located in the desirable Sugarmill Woods Community! The lot on Linder is included in the sale for a total of .71 acres!! For added privacy, one of the bedrooms is a separate en-suite and resides in a separate Casita across the courtyard, great for guests or as an IN-LAW suite. The elegance of this home begins the moment you arrive. The double door entry sets the tone for its grandeur, offering a warm and inviting welcome while hinting at the beautiful space within. Imagine stepping into a home that feels like a retreat—a sanctuary where every detail has been designed to provide an unparalleled sense of comfort and style. This stunning cabana pool home is a masterpiece of modern living, offering a host of luxurious features that perfectly blend practicality with aesthetic appeal. The heart of this home is undoubtedly the expansive kitchen, designed with Corian counters and equipped with modern stainless-steel appliances. This space combines elegance with practicality, offering ample counter space for meal preparation and casual gatherings. Step inside the spacious living room, where the trey ceiling and custom built-in shelving immediately captures your attention. Expansive glass- enclosed Florida offers panoramic views of the beautifully manicured yard, with a paver patio, a pergola with fire pit, built-in stone grilling station with a Blackstone grill, and a fenced yard. No cabana pool home would be complete without a summer kitchen, and this home delivers in style. Equipped with a wet bar, this outdoor culinary space is ideal for hosting barbecues, pool parties, or intimate alfresco dinners. The summer kitchen seamlessly blends functionality and luxury, making it a space where cooking and entertaining become a pleasure rather than a chore. This home offers an array of additional features to include 50-year tile roof, AC 2017, solar heated pool, 4-person hot tub, pavers lanai and pool deck, newer 220 breaker, each bedroom with pool access, well for sprinklers, central vac, and a 10X10 shed equipped with electric. Lots of shopping and favorite local dining options nearby. Transferable home warranty in place until 8/29/2029. It is conveniently located near Homosassa Springs, Citrus County’s Nature Coast and close to the Gulf to enjoy fishing, boating, Kayaking and so much more. Sugarmill Woods Country Club offers a variety of amenities, including two golf courses, tennis courts, pickleball courts, a gym, a Jr Olympic-sized swimming pool, a tiki bar, and a restaurant. Easy access to the Suncoast parkway for quick access to the airport, Tampa, Clearwater and St. Pete Beaches (Ranked in the top 5 Beaches in the US), also close to the famous Tarpon Springs Sponge Docks. Enjoy everything Tampa Bay has to offer from the new Downtown Riverwalk, TOP US BEACHES, boating, fishing, golfing, cultural entertainment, and museums...and of course beautiful year-round weather! ASK YOUR AGENT FOR THE DETAILED FEATURE LIST ATTACHED.
Build Your Team
Quickly find investor-friendly professionals who can help you succeed in real estate investing at any stage of the investing journey.


Agents
Match with investor-friendly agents who can help you find, analyze, and close your next deal


Lenders
Get the best funding…find investor-friendly lenders who specialize in your deal strategy


Property Managers
Transition to passive investing. Find a trusted property management partnership that lasts.


Tax Pros & Accountants
Taxes and financial reporting made easy—find experts to create tax savings strategies, file taxes, and more
Location
Property Details
Parking
- Description: Attached, Concrete, Driveway, Garage, Private, GarageDoorOpener
- Details: Attached
- Garage Spaces: 3
- Spaces Total: 0
Bedroom Information
- # of Bedrooms: 3
Bathroom Information
- # of Baths (Full): 3
- # of Baths (Total): 3.0
Interior Features
- # of Rooms: 3
- # of Stories: 1
- Fireplace: Yes
Exterior Features
- Exterior Walls Materials: Stucco
- Foundation: Slab
- Roof Type: Hip
- Roof Material: Tile
- Pool: Yes
HOA
- Has HOA: Yes
- Association: CYPRESS VILLAGE PROPERTY MANAGEMENT
- HOA Fee: $264/annually
Land Information
- Land Use: Residential
- Land Use Subtype: Single Family Residential
Lot Information
- Parcel ID: 18E20S13001000280001.0
- Lot Size: 30927 sqft
Property Information
- Property Type: Single Family Residence
- Style: Courtyard
- Year Built: 1999
Tax Information
- Annual Tax: $375
Utilities
- Water & Sewer: Public
- Heating: Central
- Cooling: Central Air
Location
- County: Citrus
Listing Details
Investment Summary
- Monthly Cash Flow
- -$330
- Cap Rate
- 5.5%
- Cash-on-Cash Return
- -3.0%
- Debt Coverage Ratio
- 0.89
- Internal Rate of Return (5 years)
- 1.1%
Cash Flow
Net Operating Income (NOI) minus mortgage payments.
Calculation:
NOI - Mortgage Payments
Cap Rate (Market Value)
Capitalization Rate is a rate of return that compares the yearly Net Operating Income (NOI) to the market value.
Calculation:
NOI / Market Value
Cash-on-Cash Return (CoC)
Annual Cash Flow / Cash Invested
Calculation:
Annual cash flow divided by initial cash invested.
Debt Coverage Ratio (DCR)
Net Operating Income (NOI) divided by total debt payments.
Calculation:
NOI / Total Debt Payments
Internal Rate of Return (IRR)
A metric for assessing profitability over time. IRR is the discount rate at which the net present value (NPV) of all future cash flows (positive and negative) from an investment equals zero — including both periodic cash flow (such as rent) and a projected sale at the end of the holding period. It represents the expected annualized return, accounting for income, expenses, and the recovery of capital through a future sale.
Purchase Details
Purchase PriceThe price paid for the property. Purchase price:
| $579,500 |
|---|---|
Amount FinancedThe amount of the purchase financed through a loan. Amount financed:
| -$463,600 |
Down paymentThe initial payment made towards the purchase. Down payment:
| $115,900 |
Closing CostsFees and expenses associated with purchasing a property, typically ranging from 2% to 5% of the home’s purchase price, paid at the end of a home purchase to cover services like lending, title transfer, and taxes. Closing costs:
| $17,385 |
Rehab CostsCosts incurred to repair or improve the property, including: roof, flooring, exterior siding, kitchen, exterior paint, bathrooms, etc. Rehab costs:
| $0 |
Initial Cash InvestedThe total initial cash invested in the property. Calculation:Down payment + Buying costs + Rehab costs Initial cash invested:
| $133,285 |
Square Feet (SQFT)The total square footage of the property. Square feet:
| 2,437 |
Cost Per Square FootCost per square foot of the property. Calculation:Purchase Price / Square Feet Cost per square foot:
| $238 |
Monthly Rent Per Square FootMonthly rent divided by the number of square feet. This ratio helps investors compare rental income efficiency across properties, markets, and unit sizes Calculation:Monthly Rent / Square Feet Monthly rent per square foot:
| $1.60 |
Financing Details
Loan AmountThe total sum of money borrowed from a lender to finance a property purchase. Calculation:Purchase Price - Down Payment
Loan amount:
| $463,600 |
|---|---|
Loan to Value Ratio (LTV)Loan amount divided by the market value of the property. Calculation:Loan Amount / Market Value
Loan to value ratio:
| 80.0% |
Loan TypeThe type of loan (e.g., fixed, adjustable).
Loan type:
| Amortizing |
TermThe loan repayment period in years.
Term:
| 30 years |
Interest RateThe percentage a lender charges on the borrowed amount of a loan, determining the cost of borrowing money.
Interest rate:
| 6.625% |
Principal & Interest (PI)The principal is the portion of the loan payment that reduces the loan balance. The interest is the lender's charge for borrowing money. Calculation:(P * r * (1 + r) ** n) / ((1 + r) ** n - 1) Where:
P = Loan amount (principal)
Principal & interest:
| $2,968 |
Property TaxesAnnual taxes levied by local governments on real estate properties. These taxes fund public services like schools, roads, and emergency services.
Property tax:
| $31 |
InsuranceThe costs for insurance coverage to protect against financial losses due to risks like fire, natural disasters, theft, liability, or tenant-related damages. Calculation:Assumes 7% of gross rental income, unless insurance rates are specified.
Insurance:
| $273 |
Private Mortgage Insurance (PMI)A fee that borrowers pay when they take out a conventional loan with a loan-to-value (LTV) ratio above 80%.
Private mortgage insurance (PMI):
| $0 |
Monthly PaymentThe fixed amount a borrower pays each month to repay a loan. It typically includes principal and interest (P&I) and may also cover property taxes, insurance, HOA fees, and PMI if escrowed. Monthly payment:
| $3,272 |
Operating Income
| % Rent | Monthly | Yearly | |
|---|---|---|---|
Gross RentThe total rental income received from tenants before deducting any expenses. Includes base rent, late fees, pet fees, parking fees, and other recurring charges.
Gross rent:
| $3,900 | $46,800 | |
Vacancy LossExpected loss of rent due to vacancies.
Vacancy loss:
(6%)
| 6% | -$234 | -$2,808 |
Operating IncomeGross rental income minus vacancy loss. Calculation:Gross rent - Vacancy loss
Operating income:
| $3,666 | $43,992 |
Operating Expenses
| % Rent | Monthly | Yearly | |
|---|---|---|---|
Property TaxesAnnual taxes levied by local governments on real estate properties. These taxes fund public services like schools, roads, and emergency services. | 1% | -$31 | -$375 |
InsuranceThe costs for insurance coverage to protect against financial losses due to risks like fire, natural disasters, theft, liability, or tenant-related damages. Calculation:Assumes 7% of gross rental income, unless insurance rates are specified. | 7% | -$273 | -$3,276 |
Property ManagementThe costs associated with hiring a property manager to handle the day-to-day operations of a rental property. Includes management fees, leasing fes, eviction fees, etc. Calculation:Assumes 8% of gross rental income. | 8% | -$312 | -$3,744 |
Repairs & MaintenanceOngoing costs for routine upkeep and minor fixes needed to keep a property in good working condition. Calculation:Assumes 5% of gross rental income. Varies by property age and condition. | 5% | -$195 | -$2,340 |
Capital ExpensesLarge, infrequent costs for major improvements or replacements, like a new roof, HVAC system, or appliances. Calculation:Assumes 5% of gross rental income. Varies by property age. | 5% | -$195 | -$2,340 |
HOA FeesRegular dues paid to a Homeowners Association for community maintenance, amenities, and management. Similar fees include: Condo Association Fees, Co-op Maintenance Fees, etc. | 1% | -$22 | -$264 |
Operating ExpensesRecurring costs required to maintain and manage a rental property, including property taxes, insurance, maintenance, repairs, utilities (if paid by the owner), property management fees, and other day-to-day expenses. Calculation:Insurance + Property Taxes + Property Management + Repairs & Maintenance + Capital Expenditures + HOA Fees | 26% | -$1,028 | -$12,339 |
Cash Flow
| Monthly | Yearly | |
|---|---|---|
Net Operating Income (NOI)The income generated from a property after deducting all operating expenses but before deducting mortgage payments, taxes, and capital expenditures. Calculation:Gross Operating Income - Operating Expenses
Net operating income:
| $2,638 | $31,656 |
Mortgage PaymentThe fixed amount a borrower pays each month to repay a loan. It typically includes principal and interest (P&I) and may also cover property taxes, insurance, HOA fees, and PMI if escrowed. | -$2,968 | -$35,616 |
Cash FlowNet Operating Income (NOI) minus mortgage payments. Calculation:NOI - Mortgage Payments | $330 | $3,960 |