Florida Investment Properties for Sale
Browse homes for sale and investment properties in Florida. Refine your search by price, property type, or more.
Best cash flowing properties in Florida

Active
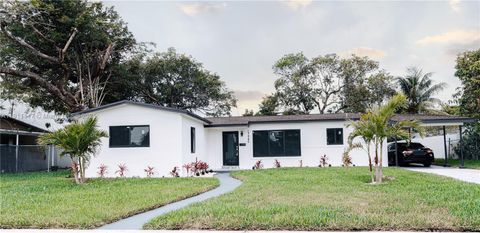
$160,000
2
bds
|
2
ba
|
1,161
sqft
|
built
1979
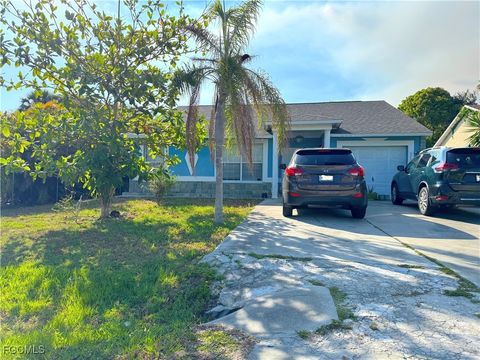
4722 SE 1st Pl, Cape Coral, FL 33904
$411
Cash flow
13.4%
Cash-on-Cash Return
9.2%
Cap rate
1.3%
Rent to Value Ratio

Active
$138,500
2
bds
|
3
ba
|
1,120
sqft
|
built
1982
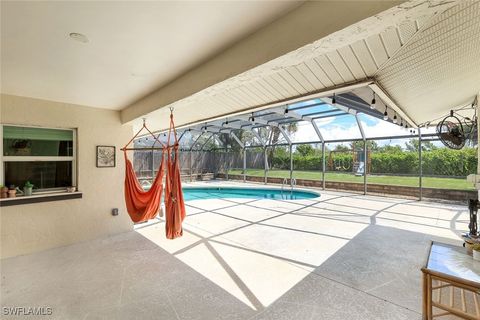
2018 S 10th St, Fort Pierce, FL 34950
$-124
Cash flow
-4.7%
Cash-on-Cash Return
5.1%
Cap rate
1.3%
Rent to Value Ratio
10,000 out of 64,548 properties for sale in Florida
Limited Results Shown
Create a free account, or log in to reveal all property listings and enjoy the complete experience.

Active
$295,000
3
bds
|
2
ba
|
1,272
sqft
|
built
2004
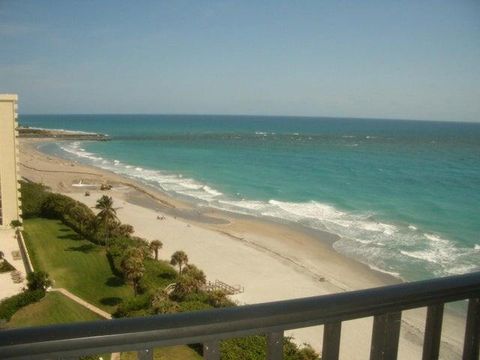
3303 32nd St SW, Lehigh Acres, FL 33976
$-295
Cash flow
-5.2%
Cash-on-Cash Return
4.9%
Cap rate
0.7%
Rent to Value Ratio

Active
$2,395,000
3
bds
|
4
ba
|
2,018
sqft
|
built
2018
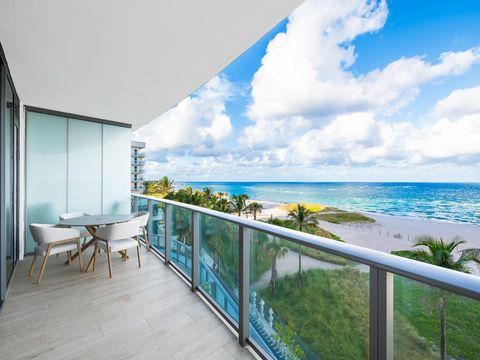
488 NE 18th St, Miami, FL 33132
$-9,699
Cash flow
-21.1%
Cash-on-Cash Return
1.3%
Cap rate
0.4%
Rent to Value Ratio

Active
$439,999
2
bds
|
2
ba
|
1,103
sqft
|
built
1959
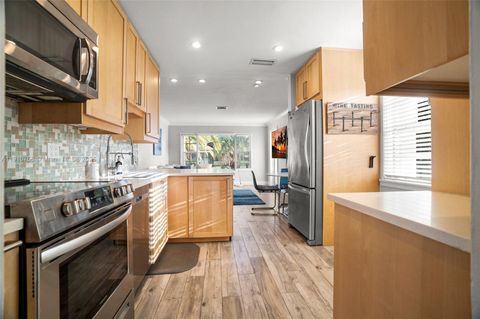
131 NE 55th St, Oakland Park, FL 33334
$-249
Cash flow
-3.0%
Cash-on-Cash Return
5.5%
Cap rate
0.7%
Rent to Value Ratio
Active
$610,000
4
bds
|
3
ba
|
1,379
sqft
|
built
1957
17940 NW 13th Ct, Miami Gardens, FL 33169
$-1,421
Cash flow
-12.2%
Cash-on-Cash Return
3.4%
Cap rate
0.5%
Rent to Value Ratio
Active
$529,999
4
bds
|
4
ba
|
1,710
sqft
|
built
2014
17473 SW 153rd Path, Miami, FL 33187
$-1,285
Cash flow
-12.6%
Cash-on-Cash Return
3.2%
Cap rate
0.6%
Rent to Value Ratio

Active
$364,999
3
bds
|
2
ba
|
1,688
sqft
|
built
2022
1012 NW 35th Pl, Cape Coral, FL 33993
$-510
Cash flow
-7.3%
Cash-on-Cash Return
4.5%
Cap rate
0.7%
Rent to Value Ratio
Active
$789,000
3
bds
|
3
ba
|
2,106
sqft
|
built
1994
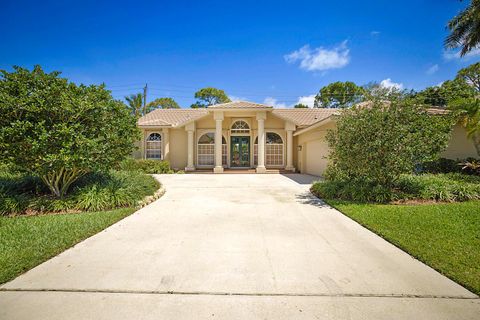
227 Shorewood Way, Jupiter, FL 33458
$-1,645
Cash flow
-10.9%
Cash-on-Cash Return
3.6%
Cap rate
0.6%
Rent to Value Ratio

Active
$1,925,000
5
bds
|
4
ba
|
2,858
sqft
|
built
2007
909 Mango Isle, Fort Lauderdale, FL 33315
$-3,534
Cash flow
-9.6%
Cash-on-Cash Return
3.9%
Cap rate
0.6%
Rent to Value Ratio

Active
$265,000
2
bds
|
2
ba
|
1,123
sqft
|
built
1988
8660 SW 212th St, Cutler Bay, FL 33189
$-402
Cash flow
-7.9%
Cash-on-Cash Return
4.3%
Cap rate
0.9%
Rent to Value Ratio

Active
$1,850,000
5
bds
|
5
ba
|
3,642
sqft
|
built
2007
136 Via Catalunha, Jupiter, FL 33458
$-4,296
Cash flow
-12.1%
Cash-on-Cash Return
3.4%
Cap rate
0.5%
Rent to Value Ratio
Active
$669,000
3
bds
|
2
ba
|
1,238
sqft
|
built
1949
1611 Mayo St, Hollywood, FL 33020
$-1,207
Cash flow
-9.4%
Cash-on-Cash Return
4.0%
Cap rate
0.7%
Rent to Value Ratio
Active
$665,000
2
bds
|
2
ba
|
1,125
sqft
|
built
1988
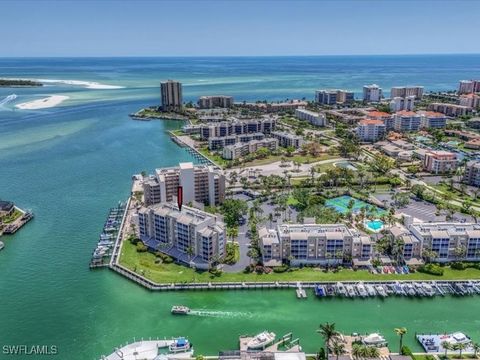
897 Collier Ct, Marco Island, FL 34145
$-1,613
Cash flow
-12.7%
Cash-on-Cash Return
3.2%
Cap rate
0.5%
Rent to Value Ratio
Active
$460,000
4
bds
|
3
ba
|
1,416
sqft
|
built
1995
5353 Martin St, Naples, FL 34113
$-585
Cash flow
-6.6%
Cash-on-Cash Return
4.6%
Cap rate
0.6%
Rent to Value Ratio

Active
$1,195,000
5
bds
|
4
ba
|
3,339
sqft
|
built
2001
863 Vanda Ter, Weston, FL 33327
$-3,248
Cash flow
-14.2%
Cash-on-Cash Return
2.9%
Cap rate
0.5%
Rent to Value Ratio
Active
$549,900
3
bds
|
2
ba
|
1,748
sqft
|
built
1973
79 Constitution Dr, Naples, FL 34112
$-432
Cash flow
-4.1%
Cash-on-Cash Return
5.2%
Cap rate
0.7%
Rent to Value Ratio
Active
$699,900
2
bds
|
2
ba
|
1,170
sqft
|
built
1983
300 Ocean Trail Way, Jupiter, FL 33477
$-3,568
Cash flow
-26.6%
Cash-on-Cash Return
0.0%
Cap rate
0.6%
Rent to Value Ratio

Active
$2,295,000
4
bds
|
4
ba
|
2,198
sqft
|
built
1959
3025 Center Ave, Fort Lauderdale, FL 33308
$-8,809
Cash flow
-20.0%
Cash-on-Cash Return
1.5%
Cap rate
0.3%
Rent to Value Ratio
Active
$2,750,000
3
bds
|
4
ba
|
2,593
sqft
|
built
2023
1116 N Ocean Blvd, Pompano Beach, FL 33062
$-13,857
Cash flow
-26.3%
Cash-on-Cash Return
0.1%
Cap rate
0.4%
Rent to Value Ratio
Active
$4,599,000
6
bds
|
7
ba
|
4,827
sqft
|
built
2006
712 NE 71st St, Boca Raton, FL 33487
$-19,949
Cash flow
-22.6%
Cash-on-Cash Return
0.9%
Cap rate
0.2%
Rent to Value Ratio

Active
$3,265,000
5
bds
|
6
ba
|
4,182
sqft
|
built
1951
2409 NE 12th St, Fort Lauderdale, FL 33304
$-12,792
Cash flow
-20.4%
Cash-on-Cash Return
1.4%
Cap rate
0.3%
Rent to Value Ratio
Active
$950,000
4
bds
|
3
ba
|
2,440
sqft
|
built
2003
132 Via Castilla, Jupiter, FL 33458
$-1,792
Cash flow
-9.8%
Cash-on-Cash Return
3.9%
Cap rate
0.6%
Rent to Value Ratio
Active
$334,900
2
bds
|
2
ba
|
978
sqft
|
built
1985
8609 Boca Glades Blvd W, Boca Raton, FL 33434
$-951
Cash flow
-14.8%
Cash-on-Cash Return
2.7%
Cap rate
0.7%
Rent to Value Ratio

Active
$519,000
3
bds
|
2
ba
|
1,706
sqft
|
built
2012
261 NE 41st St, Oakland Park, FL 33334
$-717
Cash flow
-7.2%
Cash-on-Cash Return
4.5%
Cap rate
0.7%
Rent to Value Ratio
Active
$367,000
2
bds
|
3
ba
|
1,732
sqft
|
built
1987
5250 Little Green Ln, Dade City, FL 33523
$-374
Cash flow
-5.3%
Cash-on-Cash Return
4.9%
Cap rate
0.6%
Rent to Value Ratio
Active
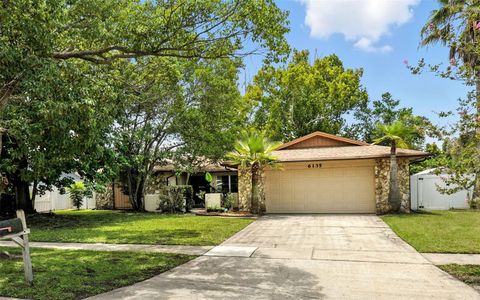
$499,900
4
bds
|
2
ba
|
1,849
sqft
|
built
1981
6135 Hardrock Cir, Orlando, FL 32819
$-624
Cash flow
-6.5%
Cash-on-Cash Return
4.6%
Cap rate
0.6%
Rent to Value Ratio

Active
$249,999
2
bds
|
2
ba
|
936
sqft
|
built
1981
10825 SW 112th Ave, Miami, FL 33176
$-673
Cash flow
-14.0%
Cash-on-Cash Return
2.9%
Cap rate
0.8%
Rent to Value Ratio
Active
$225,000
2
bds
|
2
ba
|
1,260
sqft
|
built
1981
3520 Oaks Way, Pompano Beach, FL 33069
$-420
Cash flow
-9.7%
Cash-on-Cash Return
3.9%
Cap rate
1.1%
Rent to Value Ratio

Active
$649,000
4
bds
|
0
ba
|
1,241
sqft
|
built
1954
1201 N 16th Ave, Hollywood, FL 33020
$-823
Cash flow
-6.6%
Cash-on-Cash Return
4.6%
Cap rate
0.7%
Rent to Value Ratio

Active
$499,000
3
bds
|
2
ba
|
1,080
sqft
|
built
1959
6440 SW 20th St, Miramar, FL 33023
$-866
Cash flow
-9.1%
Cash-on-Cash Return
4.1%
Cap rate
0.5%
Rent to Value Ratio

Active
$530,000
4
bds
|
2
ba
|
2,369
sqft
|
built
2002
5199 NW Rugby Dr, Port Saint Lucie, FL 34983
$-1,015
Cash flow
-10.0%
Cash-on-Cash Return
3.8%
Cap rate
0.7%
Rent to Value Ratio
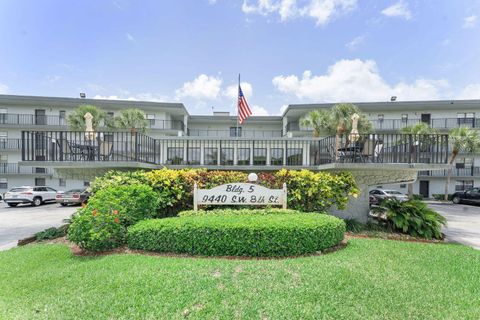
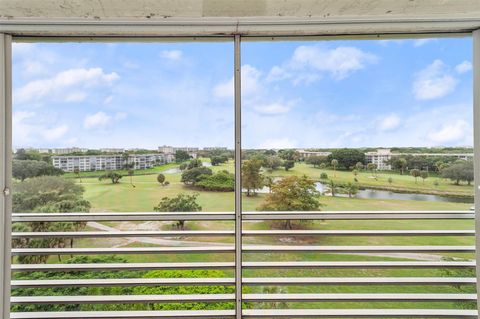
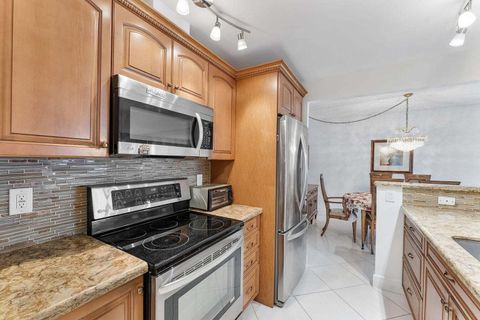
Active
$160,000
1
bds
|
2
ba
|
741
sqft
|
built
1980
9440 SW 8th St, Boca Raton, FL 33428
$-205
Cash flow
-6.7%
Cash-on-Cash Return
4.6%
Cap rate
1.1%
Rent to Value Ratio
Active
$314,500
2
bds
|
2
ba
|
947
sqft
|
built
1974
1009 N Ocean Blvd, Pompano Beach, FL 33062
$-791
Cash flow
-13.1%
Cash-on-Cash Return
3.1%
Cap rate
0.8%
Rent to Value Ratio
Active
$397,500
3
bds
|
2
ba
|
1,786
sqft
|
built
2003
1520 Lucky Pennie Way, Apopka, FL 32712
$-674
Cash flow
-8.8%
Cash-on-Cash Return
4.1%
Cap rate
0.6%
Rent to Value Ratio
Active
$275,000
3
bds
|
2
ba
|
1,543
sqft
|
built
2021
3418 SW 155th Pl, Ocala, FL 34473
$-483
Cash flow
-9.2%
Cash-on-Cash Return
4.0%
Cap rate
0.7%
Rent to Value Ratio
Active
$485,000
3
bds
|
2
ba
|
1,740
sqft
|
built
1978
11351 NW 37th St, Coral Springs, FL 33065
$-503
Cash flow
-5.4%
Cash-on-Cash Return
4.9%
Cap rate
0.7%
Rent to Value Ratio

Active
$214,999
1
bds
|
2
ba
|
855
sqft
|
built
1972
2150 Sans Souci Blvd, North Miami, FL 33181
$-580
Cash flow
-14.1%
Cash-on-Cash Return
2.9%
Cap rate
0.9%
Rent to Value Ratio
Active
$859,900
3
bds
|
2
ba
|
2,068
sqft
|
built
1986
2255 Imperial Golf Course Blvd, Naples, FL 34110
$-671
Cash flow
-4.1%
Cash-on-Cash Return
5.2%
Cap rate
0.8%
Rent to Value Ratio
Active
$545,000
2
bds
|
2
ba
|
1,385
sqft
|
built
1985
601 Seafarer Cir, Jupiter, FL 33477
$-1,821
Cash flow
-17.4%
Cash-on-Cash Return
2.1%
Cap rate
0.6%
Rent to Value Ratio