Texas Investment Properties for Sale
Browse homes for sale and investment properties in Texas. Refine your search by price, property type, or more.
Best cash flowing properties in Texas
Active
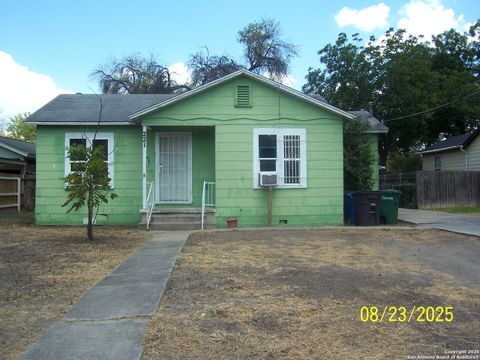
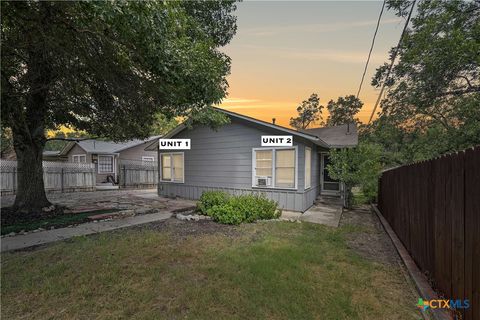
$110,000
2
bds
|
1
ba
|
820
sqft
|
built
1938
221 Rayburn Dr, San Antonio, TX 78221
$101
Cash flow
4.8%
Cash-on-Cash Return
6.8%
Cap rate
1.2%
Rent to Value Ratio
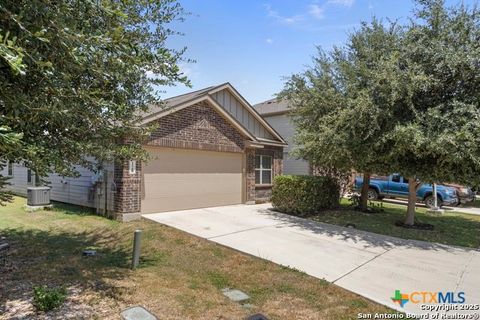
Active
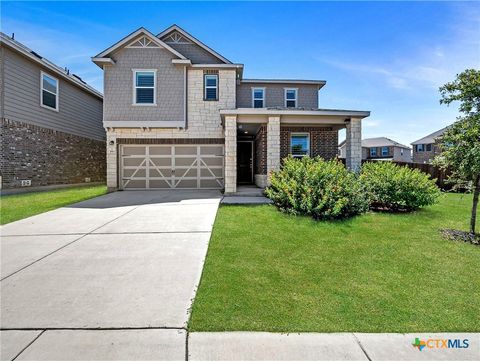
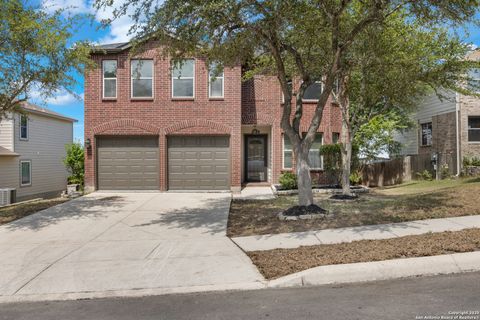
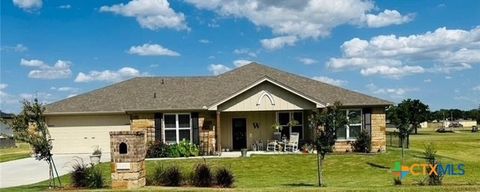
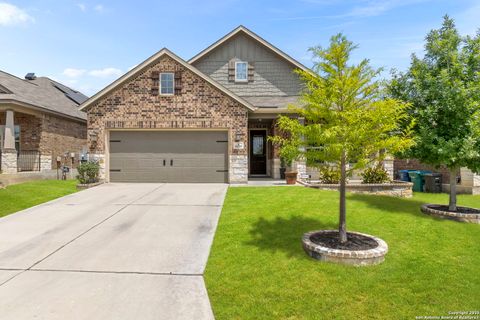
$294,990
4
bds
|
2
ba
|
1,695
sqft
|
built
2017
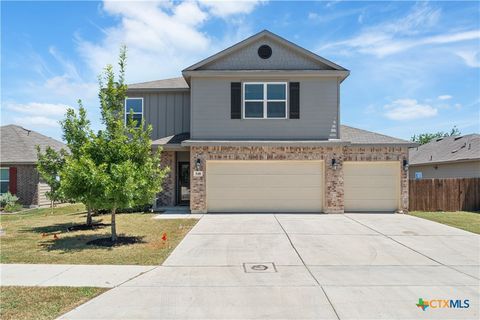
128 Field Rdg, New Braunfels, TX 78130
$-154
Cash flow
-2.7%
Cash-on-Cash Return
5.1%
Cap rate
0.6%
Rent to Value Ratio
10,000 out of 89,303 properties for sale in Texas
Limited Results Shown
Create a free account, or log in to reveal all property listings and enjoy the complete experience.
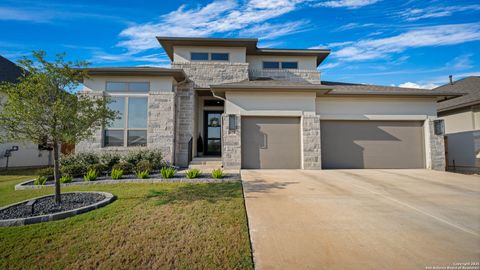
Active
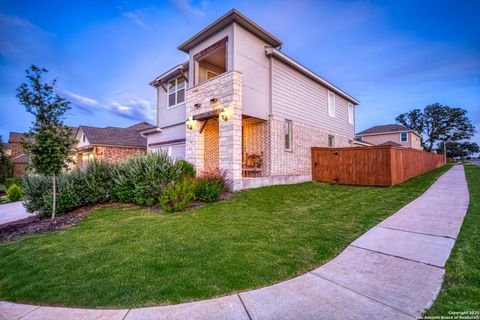
$692,000
4
bds
|
4
ba
|
2,894
sqft
|
built
2023
1925 Luna St, New Braunfels, TX 78132
$-1,966
Cash flow
-14.8%
Cash-on-Cash Return
2.3%
Cap rate
0.5%
Rent to Value Ratio
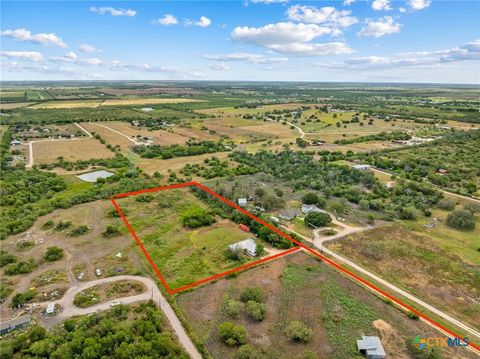
Active
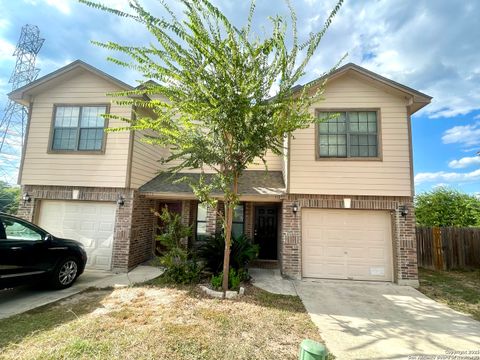
$410,000
4
bds
|
2
ba
|
1,896
sqft
|
built
1997
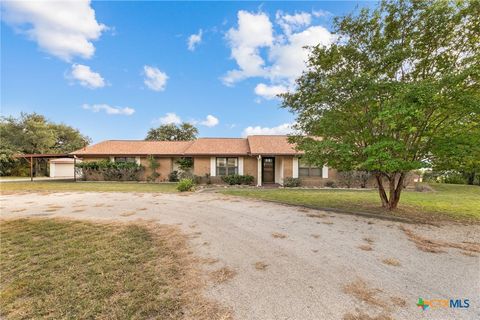
2862 Wetz Rd, Marion, TX 78124
$-631
Cash flow
-8.0%
Cash-on-Cash Return
3.8%
Cap rate
0.6%
Rent to Value Ratio
Active
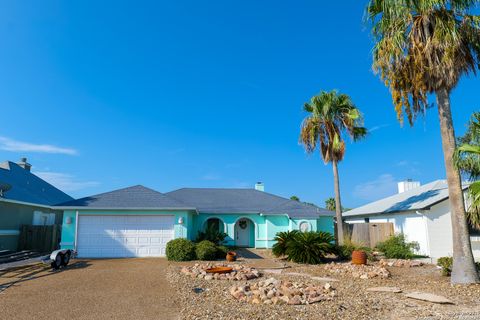
$520,000
3
bds
|
3
ba
|
1,953
sqft
|
built
1983
1156 Crossbow Dr, Canyon Lake, TX 78133
$-1,162
Cash flow
-11.7%
Cash-on-Cash Return
3.0%
Cap rate
0.5%
Rent to Value Ratio
Active
$357,000
3
bds
|
2
ba
|
1,550
sqft
|
built
1994
1812 Park Pl, New Braunfels, TX 78130
$-936
Cash flow
-13.7%
Cash-on-Cash Return
2.5%
Cap rate
0.5%
Rent to Value Ratio
Active
$375,000
4
bds
|
3
ba
|
2,482
sqft
|
built
2019
548 Long Leaf Dr, New Braunfels, TX 78130
$-257
Cash flow
-3.6%
Cash-on-Cash Return
4.9%
Cap rate
0.6%
Rent to Value Ratio
Active
$1,790,000
7
bds
|
8
ba
|
4,905
sqft
|
built
1996
1210 Whispering Woods Trl, New Braunfels, TX 78132
$-6,895
Cash flow
-20.1%
Cash-on-Cash Return
1.1%
Cap rate
0.2%
Rent to Value Ratio
Active
$1,275,000
4
bds
|
6
ba
|
3,932
sqft
|
built
2022
541 Cantera Rdg, New Braunfels, TX 78132
$-1,716
Cash flow
-7.0%
Cash-on-Cash Return
4.1%
Cap rate
0.5%
Rent to Value Ratio
Active
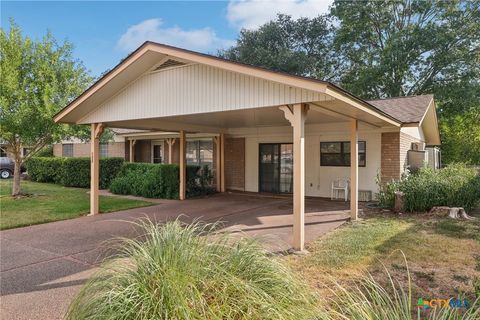
$310,000
2
bds
|
2
ba
|
1,191
sqft
|
built
1948
640 Lee St, New Braunfels, TX 78130
$-750
Cash flow
-12.6%
Cash-on-Cash Return
2.8%
Cap rate
0.5%
Rent to Value Ratio
Active
$262,000
3
bds
|
3
ba
|
2,152
sqft
|
built
2003
34 Beacon Bay, San Antonio, TX 78239
$-466
Cash flow
-9.3%
Cash-on-Cash Return
3.5%
Cap rate
0.7%
Rent to Value Ratio
Active
$345,000
3
bds
|
3
ba
|
2,892
sqft
|
built
2021
3865 Bentwood Way, New Braunfels, TX 78130
$-681
Cash flow
-10.3%
Cash-on-Cash Return
3.3%
Cap rate
0.6%
Rent to Value Ratio
Active
$365,000
4
bds
|
2
ba
|
1,842
sqft
|
built
1994
14867 Cart Rd, Temple, TX 76502
$-834
Cash flow
-11.9%
Cash-on-Cash Return
2.9%
Cap rate
0.5%
Rent to Value Ratio
Active
$220,000
3
bds
|
3
ba
|
1,456
sqft
|
built
2007
11531 Creek Eagle, San Antonio, TX 78245
$-229
Cash flow
-5.4%
Cash-on-Cash Return
4.4%
Cap rate
0.7%
Rent to Value Ratio
Active
$235,000
3
bds
|
2
ba
|
1,666
sqft
|
built
2014
6504 Mustang Creek Rd, Killeen, TX 76549
$-258
Cash flow
-5.7%
Cash-on-Cash Return
4.4%
Cap rate
0.8%
Rent to Value Ratio
Active
$385,000
3
bds
|
2
ba
|
1,966
sqft
|
built
2015
8714 White Crown, San Antonio, TX 78254
$-951
Cash flow
-12.9%
Cash-on-Cash Return
2.7%
Cap rate
0.6%
Rent to Value Ratio
Active
$340,000
4
bds
|
2
ba
|
2,169
sqft
|
built
1983
6026 Watertown, San Antonio, TX 78249
$-852
Cash flow
-13.1%
Cash-on-Cash Return
2.7%
Cap rate
0.6%
Rent to Value Ratio
Active
$233,333
2
bds
|
2
ba
|
1,005
sqft
|
built
1997
434 Watts Ln, Canyon Lake, TX 78133
$-294
Cash flow
-6.6%
Cash-on-Cash Return
4.2%
Cap rate
0.7%
Rent to Value Ratio
Active
$869,000
4
bds
|
4
ba
|
3,765
sqft
|
built
2008
22426 Viajes, San Antonio, TX 78261
$-2,799
Cash flow
-16.8%
Cash-on-Cash Return
1.8%
Cap rate
0.6%
Rent to Value Ratio

Active
$225,000
3
bds
|
2
ba
|
1,378
sqft
|
built
1977
8611 Tanbark Dr, San Antonio, TX 78240
$-368
Cash flow
-8.5%
Cash-on-Cash Return
3.7%
Cap rate
0.7%
Rent to Value Ratio
Active
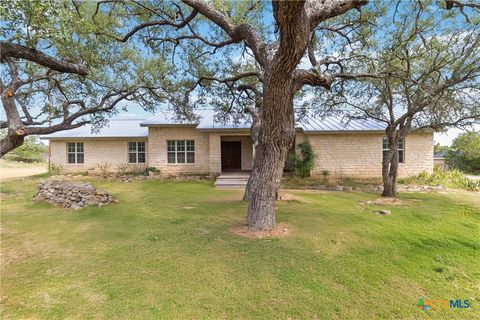
$450,000
3
bds
|
2
ba
|
1,680
sqft
|
built
1977
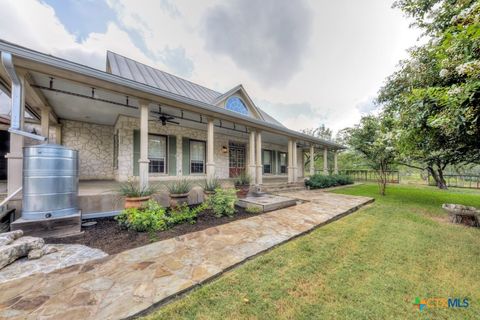
17 Roadrunner Dr, Fredericksburg, TX 78624
$-369
Cash flow
-4.3%
Cash-on-Cash Return
4.7%
Cap rate
0.7%
Rent to Value Ratio
Active
$589,000
3
bds
|
2
ba
|
1,829
sqft
|
built
1996
124 Turkey Trail Dr, San Marcos, TX 78666
$-1,414
Cash flow
-12.5%
Cash-on-Cash Return
2.8%
Cap rate
0.5%
Rent to Value Ratio
Active
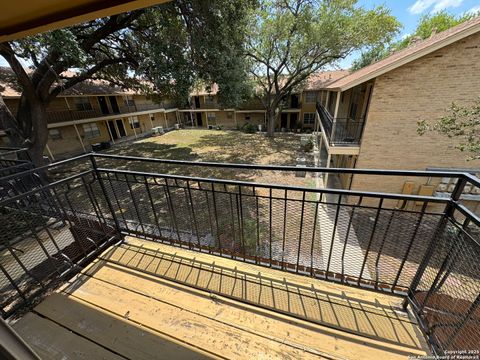
$94,900
1
bds
|
1
ba
|
736
sqft
|
built
1974
923 Vance Jackson Rd, San Antonio, TX 78201
$-351
Cash flow
-19.3%
Cash-on-Cash Return
1.2%
Cap rate
0.9%
Rent to Value Ratio
Active
$255,000
3
bds
|
2
ba
|
1,897
sqft
|
built
1968
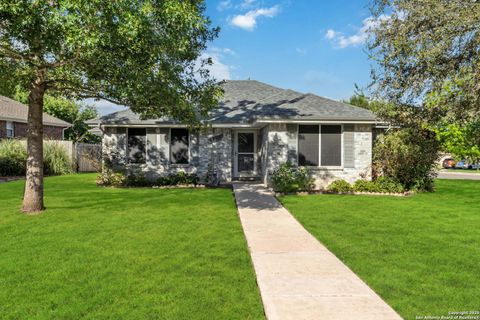
132 Cloverleaf Dr, Schertz, TX 78154
$-409
Cash flow
-8.4%
Cash-on-Cash Return
3.8%
Cap rate
0.6%
Rent to Value Ratio
Active
$317,500
4
bds
|
2
ba
|
2,354
sqft
|
built
2005
15714 Hastings Park, Selma, TX 78154
$-603
Cash flow
-9.9%
Cash-on-Cash Return
3.4%
Cap rate
0.6%
Rent to Value Ratio
Active
$315,000
3
bds
|
3
ba
|
2,086
sqft
|
built
2001
9019 Quaker Rdg, Selma, TX 78154
$-603
Cash flow
-10.0%
Cash-on-Cash Return
3.4%
Cap rate
0.6%
Rent to Value Ratio
Active
$230,000
3
bds
|
2
ba
|
1,469
sqft
|
built
1996
1518 Zinfandel Dr, Harker Heights, TX 76548
$-346
Cash flow
-7.8%
Cash-on-Cash Return
3.9%
Cap rate
0.7%
Rent to Value Ratio
Active
$320,000
4
bds
|
2
ba
|
1,684
sqft
|
built
2020
8323 Dovers Den, San Antonio, TX 78253
$-623
Cash flow
-10.2%
Cash-on-Cash Return
3.3%
Cap rate
0.6%
Rent to Value Ratio
Active
$360,000
4
bds
|
3
ba
|
2,438
sqft
|
built
1966
3506 Buffalo Trl, Temple, TX 76504
$-715
Cash flow
-10.4%
Cash-on-Cash Return
3.3%
Cap rate
0.6%
Rent to Value Ratio
Active
$315,000
3
bds
|
2
ba
|
1,620
sqft
|
built
2020
115 Surrey Ln, Gatesville, TX 76528
$-577
Cash flow
-9.6%
Cash-on-Cash Return
3.5%
Cap rate
0.6%
Rent to Value Ratio
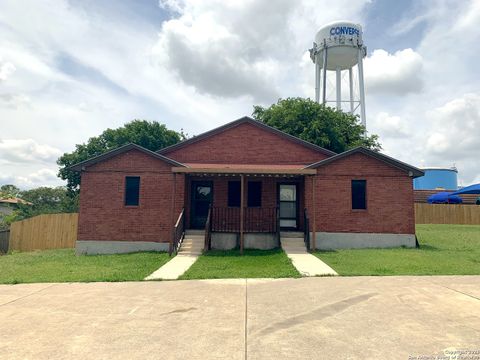
Active
$235,000
6
bds
|
0
ba
|
1,842
sqft
|
built
2000
509 Meadow Frg, Converse, TX 78109
$-786
Cash flow
-17.5%
Cash-on-Cash Return
1.7%
Cap rate
0.5%
Rent to Value Ratio
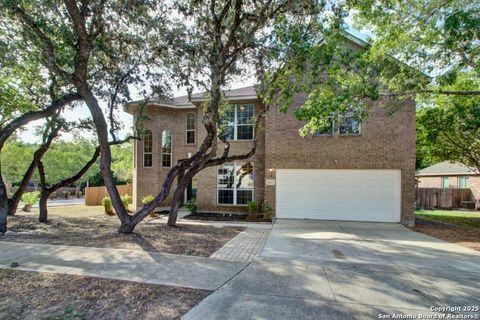
Active
$375,000
3
bds
|
3
ba
|
2,560
sqft
|
built
1999
8203 Brightstone, San Antonio, TX 78250
$-945
Cash flow
-13.1%
Cash-on-Cash Return
2.7%
Cap rate
0.6%
Rent to Value Ratio
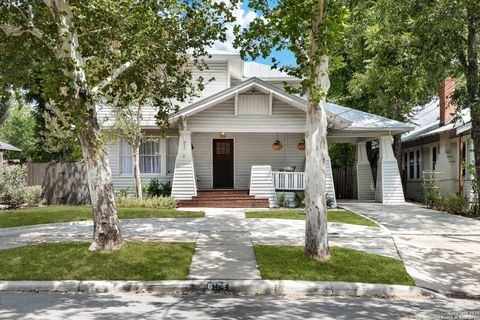
Active
$645,000
4
bds
|
3
ba
|
2,506
sqft
|
built
1922
617 E Park Ave, San Antonio, TX 78212
$-1,991
Cash flow
-16.1%
Cash-on-Cash Return
2.0%
Cap rate
0.5%
Rent to Value Ratio
Active
$374,900
3
bds
|
3
ba
|
2,143
sqft
|
built
2018
16315 Amistad Pass, San Antonio, TX 78247
$-975
Cash flow
-13.6%
Cash-on-Cash Return
2.6%
Cap rate
0.6%
Rent to Value Ratio
Active
$515,000
3
bds
|
3
ba
|
1,847
sqft
|
built
2022
2069 Flametree Ave, New Braunfels, TX 78132
$-1,380
Cash flow
-14.0%
Cash-on-Cash Return
2.5%
Cap rate
0.5%
Rent to Value Ratio
Active
$675,000
3
bds
|
2
ba
|
1,598
sqft
|
built
1989
13849 Doubloon St, Corpus Christi, TX 78418
$-2,111
Cash flow
-16.3%
Cash-on-Cash Return
1.9%
Cap rate
0.5%
Rent to Value Ratio
Active
$215,000
3
bds
|
3
ba
|
1,456
sqft
|
built
2007
11527 Creek Eagle, San Antonio, TX 78245
$-320
Cash flow
-7.8%
Cash-on-Cash Return
3.9%
Cap rate
0.7%
Rent to Value Ratio
Active
$435,000
4
bds
|
4
ba
|
2,888
sqft
|
built
2018
8919 Monument Parke, San Antonio, TX 78254
$-1,020
Cash flow
-12.2%
Cash-on-Cash Return
2.9%
Cap rate
0.6%
Rent to Value Ratio
Active
$1,295,000
4
bds
|
3
ba
|
3,170
sqft
|
built
2014
502 Cindy Dr, Canyon Lake, TX 78133
$-4,228
Cash flow
-17.0%
Cash-on-Cash Return
1.8%
Cap rate
0.3%
Rent to Value Ratio
Active
$715,000
5
bds
|
3
ba
|
3,366
sqft
|
built
1976
31946 Jay Bird Ln, Bulverde, TX 78163
$-1,946
Cash flow
-14.2%
Cash-on-Cash Return
2.4%
Cap rate
0.4%
Rent to Value Ratio