Missouri Investment Properties for Sale
Browse homes for sale and investment properties in Missouri. Refine your search by price, property type, or more.
Best cash flowing properties in Missouri
Active
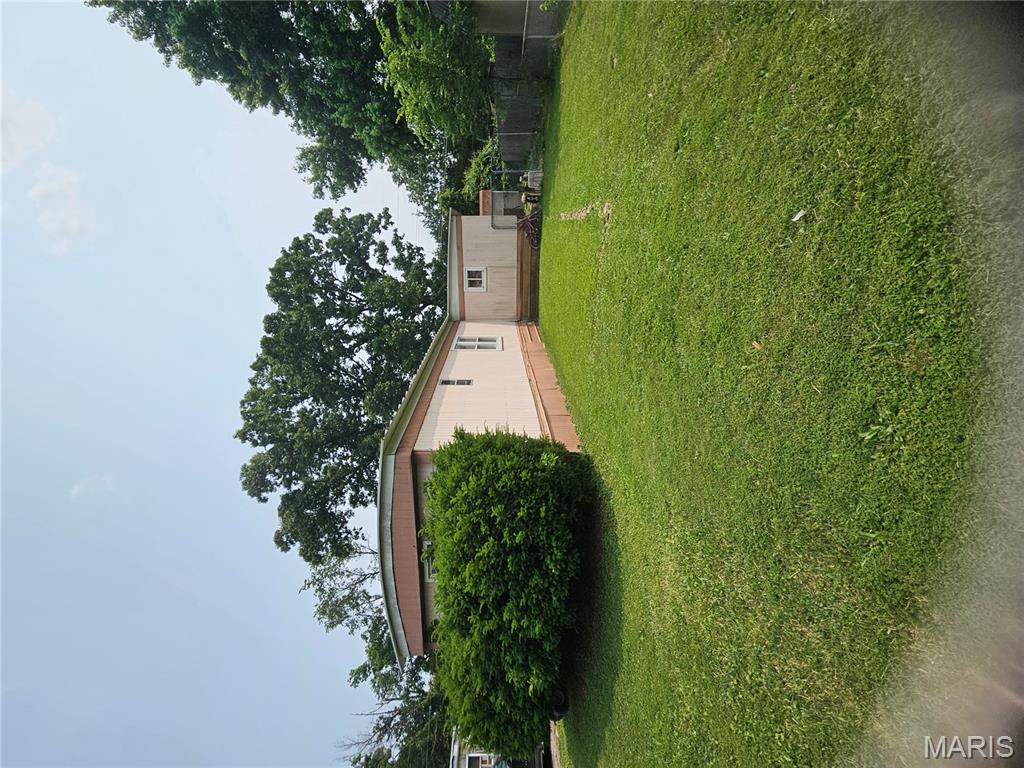
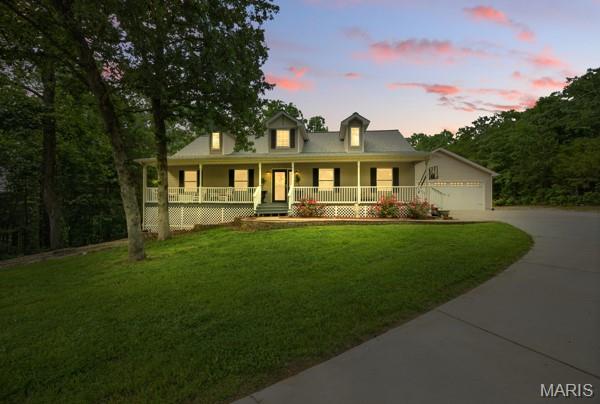
$30,500
3
bds
|
2
ba
|
1,262
sqft
|
built
2017
6647 Jenny Ct, Cedar Hill, MO 63016
$736
Cash flow
28.1%
Cash-on-Cash Return
29.0%
Cap rate
3.6%
Rent to Value Ratio
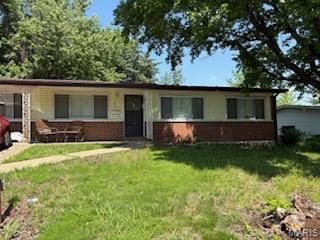
Active
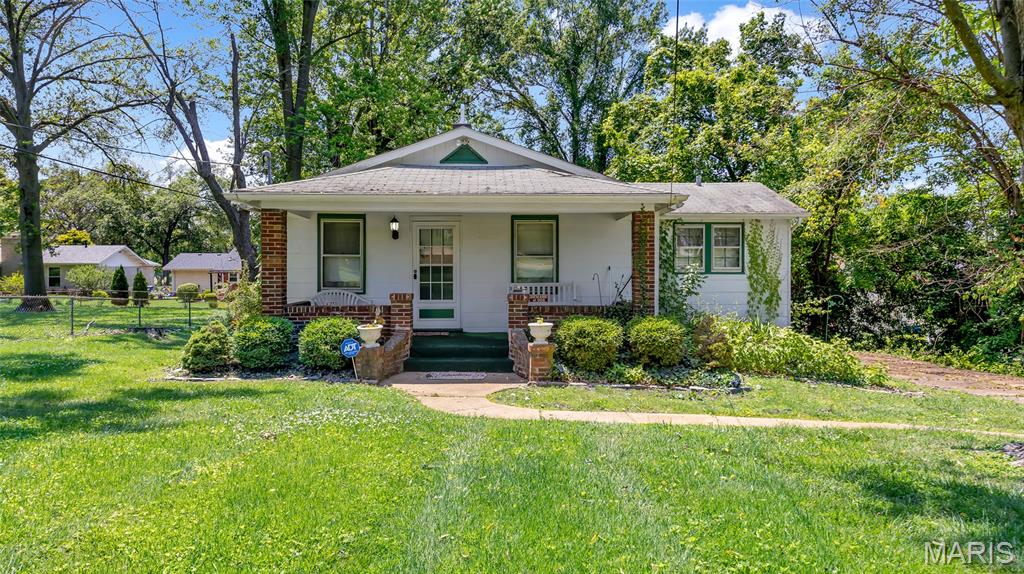
$102,500
3
bds
|
1
ba
|
944
sqft
|
built
1938
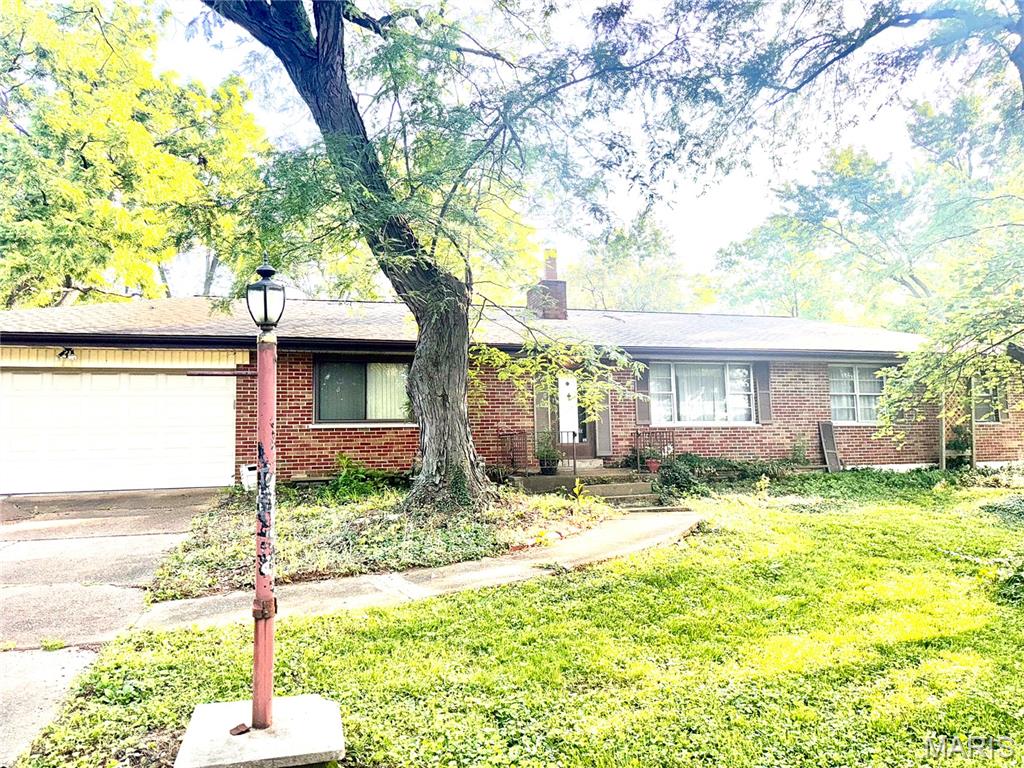
13495 Old Halls Ferry Rd, Black Jack, MO 63033
$472
Cash flow
24.0%
Cash-on-Cash Return
11.2%
Cap rate
1.6%
Rent to Value Ratio
168 out of 5,282 properties for sale in Missouri
Limited Results Shown
Create a free account, or log in to reveal all property listings and enjoy the complete experience.
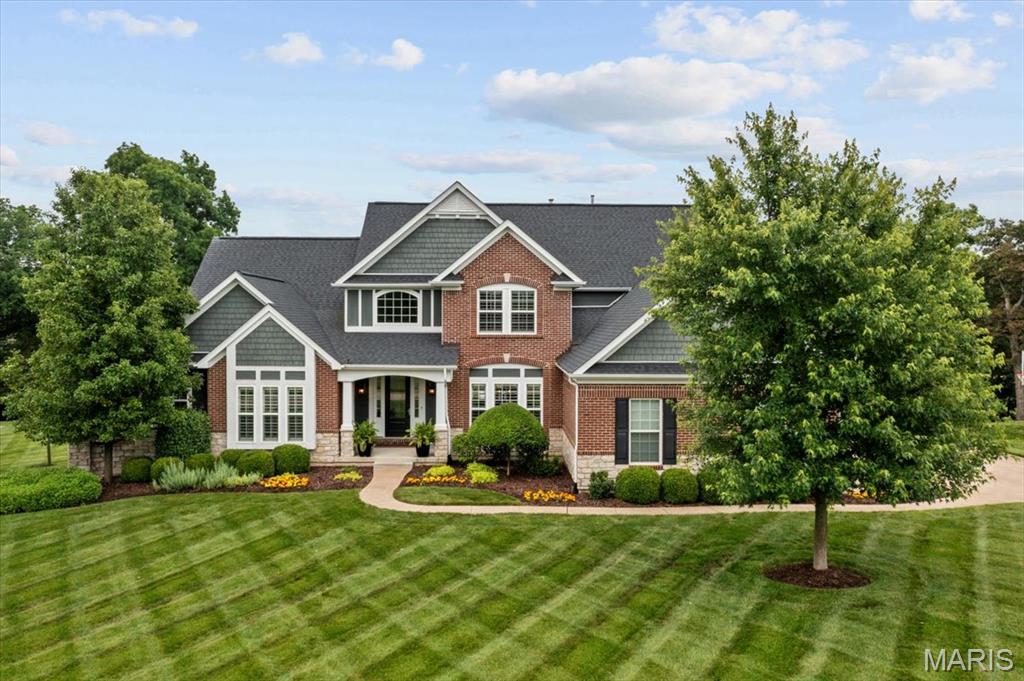
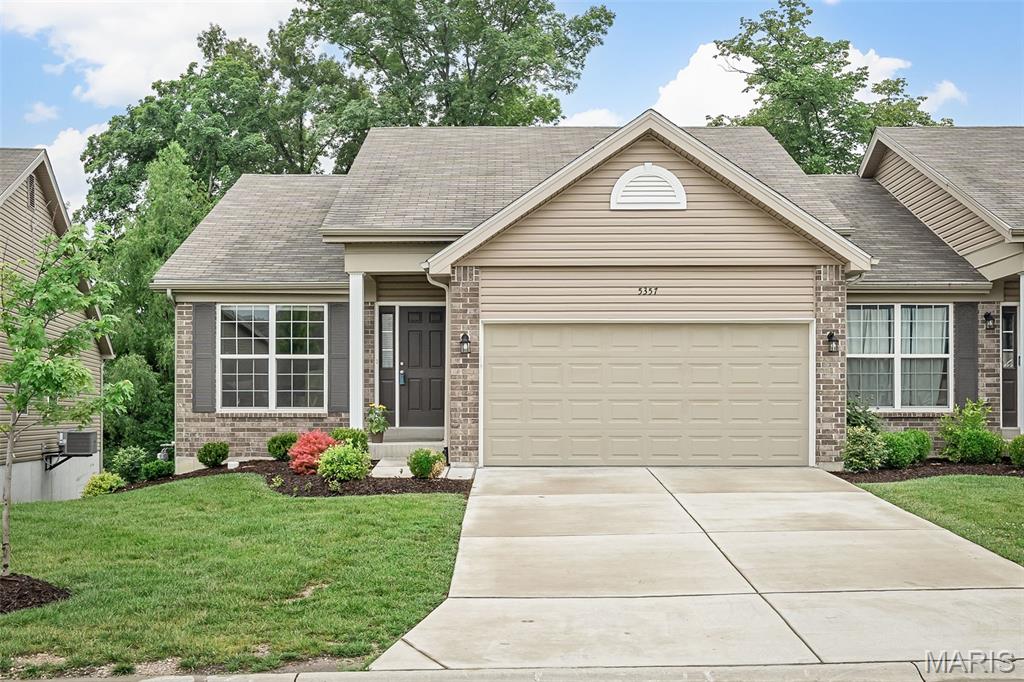
Active
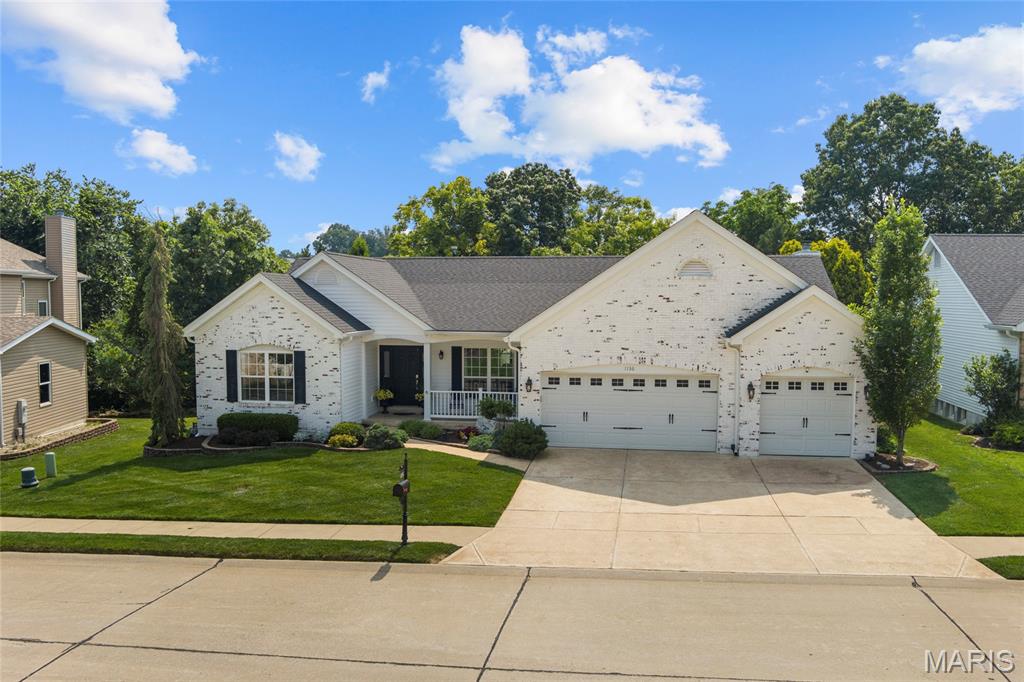
$599,000
4
bds
|
3
ba
|
2,498
sqft
|
built
1997
1136 New Ballwin Oaks Dr, Ballwin, MO 63021
$-1,155
Cash flow
-10.1%
Cash-on-Cash Return
3.4%
Cap rate
0.5%
Rent to Value Ratio
Active under contract
$285,000
4
bds
|
3
ba
|
1,320
sqft
|
built
2011
21 Ramblewood Ct, Wentzville, MO 63385
$-200
Cash flow
-3.7%
Cash-on-Cash Return
4.8%
Cap rate
0.7%
Rent to Value Ratio
Active
$550,000
5
bds
|
4
ba
|
4,076
sqft
|
built
1998
752 Grand View Ridge Ct, Eureka, MO 63025
$-813
Cash flow
-7.7%
Cash-on-Cash Return
3.9%
Cap rate
0.6%
Rent to Value Ratio
Active
$445,000
5
bds
|
3
ba
|
2,674
sqft
|
built
2000
9 Sun Rise Trl, Hillsboro, MO 63050
$-995
Cash flow
-11.7%
Cash-on-Cash Return
3.0%
Cap rate
0.4%
Rent to Value Ratio
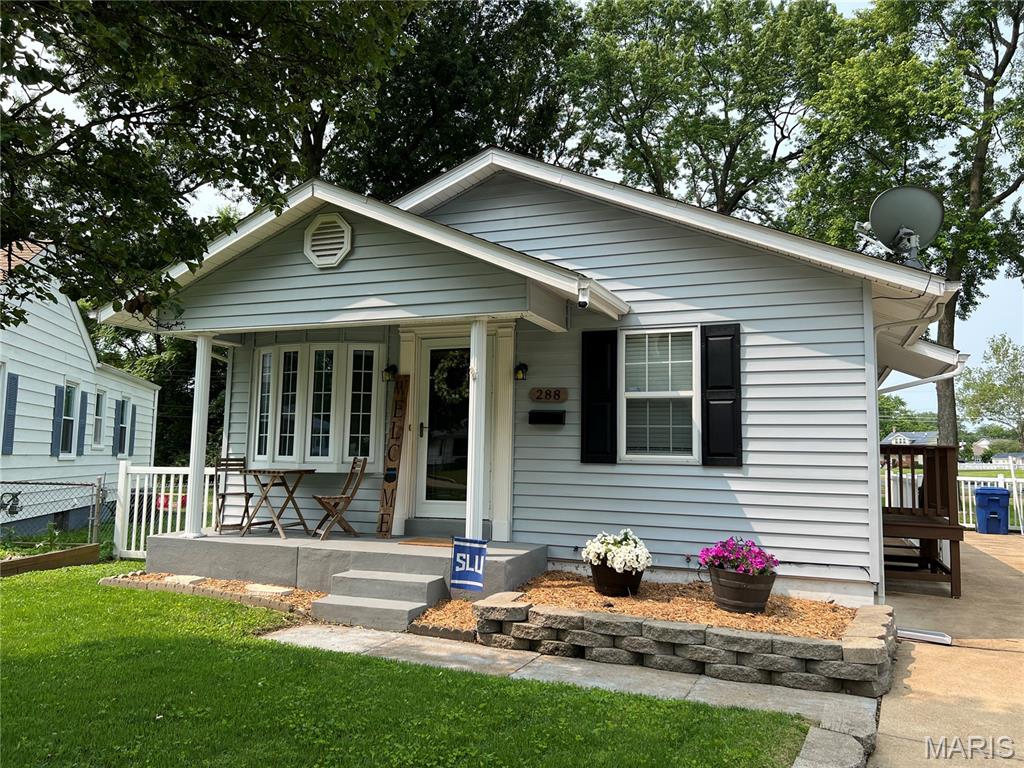
Active
$169,900
2
bds
|
2
ba
|
864
sqft
|
built
1953
288 Elmdale Ct, Florissant, MO 63031
$66
Cash flow
2.0%
Cash-on-Cash Return
6.1%
Cap rate
0.9%
Rent to Value Ratio
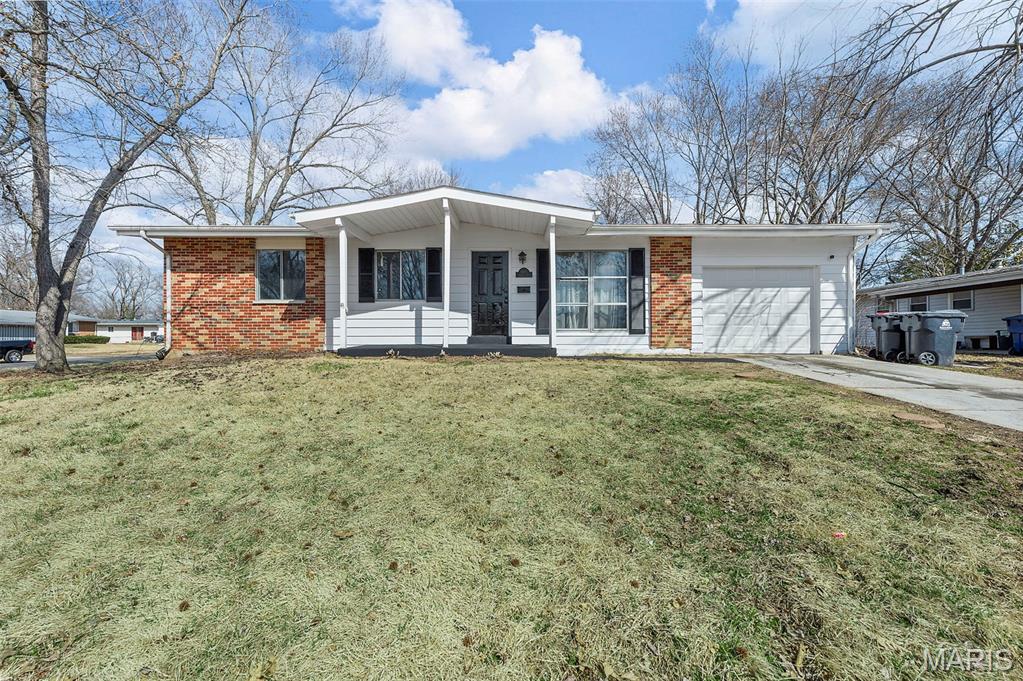
Active
$199,000
3
bds
|
2
ba
|
1,235
sqft
|
built
1961
965 Cheyenne Dr, Florissant, MO 63033
$-17
Cash flow
-0.4%
Cash-on-Cash Return
5.6%
Cap rate
0.8%
Rent to Value Ratio
Active
$280,000
3
bds
|
3
ba
|
1,909
sqft
|
built
1985
9945 Frazier Dr, Hillsboro, MO 63050
$-370
Cash flow
-6.9%
Cash-on-Cash Return
4.1%
Cap rate
0.6%
Rent to Value Ratio
Active
$249,900
4
bds
|
2
ba
|
1,800
sqft
|
built
1960
7339 Lakeshore Dr, Cedar Hill, MO 63016
$11
Cash flow
0.2%
Cash-on-Cash Return
5.7%
Cap rate
0.8%
Rent to Value Ratio
Active
$480,000
3
bds
|
3
ba
|
2,306
sqft
|
built
2022
207 Savannah Ridge Ct, Fenton, MO 63026
$-948
Cash flow
-10.3%
Cash-on-Cash Return
3.3%
Cap rate
0.6%
Rent to Value Ratio
Active
$240,000
3
bds
|
2
ba
|
1,400
sqft
|
built
1992
2285 Reising Rd, De Soto, MO 63020
$140
Cash flow
3.0%
Cash-on-Cash Return
6.4%
Cap rate
0.8%
Rent to Value Ratio
Active
$219,900
3
bds
|
2
ba
|
2,140
sqft
|
built
1860
503 E State St, Union, MO 63084
$182
Cash flow
4.3%
Cash-on-Cash Return
6.7%
Cap rate
0.9%
Rent to Value Ratio
Active
$350,000
4
bds
|
3
ba
|
2,731
sqft
|
built
1967
314 Wildbrier Dr, Ballwin, MO 63011
$-306
Cash flow
-4.6%
Cash-on-Cash Return
4.6%
Cap rate
0.7%
Rent to Value Ratio
Active
$225,000
2
bds
|
2
ba
|
1,040
sqft
|
built
1976
1242 Larkin Williams Rd, Fenton, MO 63026
$74
Cash flow
1.7%
Cash-on-Cash Return
6.1%
Cap rate
0.9%
Rent to Value Ratio
Active
$249,900
3
bds
|
2
ba
|
1,393
sqft
|
built
1963
2202 Valley Park Rd, Fenton, MO 63026
$-296
Cash flow
-6.2%
Cash-on-Cash Return
4.3%
Cap rate
0.6%
Rent to Value Ratio

Active
$375,000
3
bds
|
2
ba
|
1,532
sqft
|
built
2022
2904 Sierra View Ct, Imperial, MO 63052
$-510
Cash flow
-7.1%
Cash-on-Cash Return
4.0%
Cap rate
0.6%
Rent to Value Ratio
Active
$1,250,000
4
bds
|
4
ba
|
4,447
sqft
|
built
2015
405 Stonewall Dr, Eureka, MO 63025
$-4,137
Cash flow
-17.3%
Cash-on-Cash Return
1.7%
Cap rate
0.3%
Rent to Value Ratio
Active
$275,000
3
bds
|
2
ba
|
1,192
sqft
|
built
2020
219 Cuivre Valley Ct, Troy, MO 63379
$-369
Cash flow
-7.0%
Cash-on-Cash Return
4.1%
Cap rate
0.6%
Rent to Value Ratio
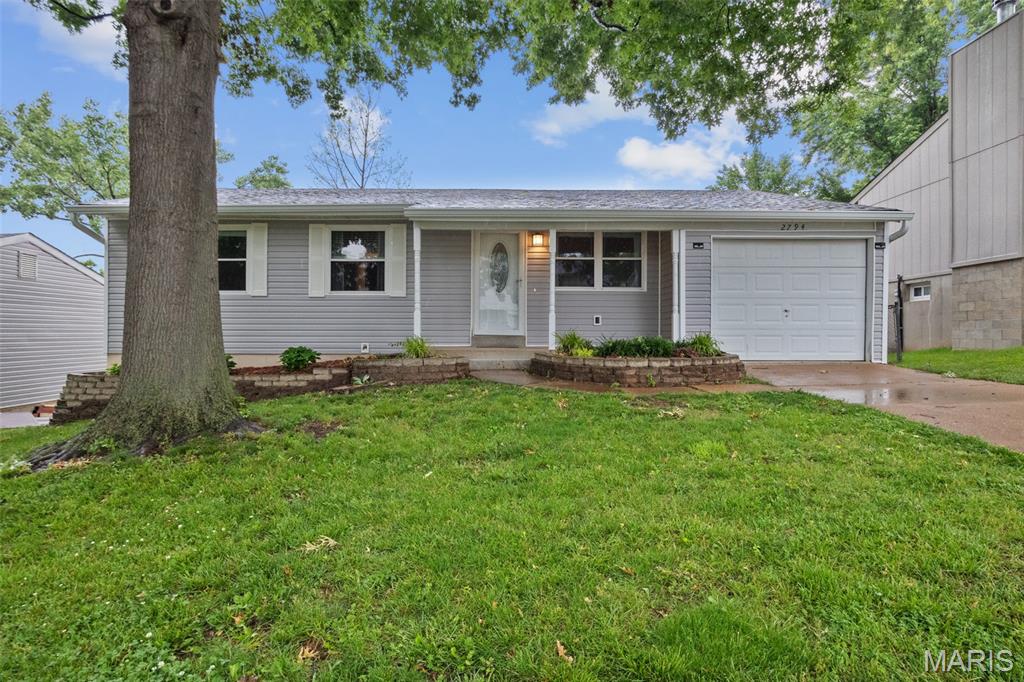
Active
$250,000
3
bds
|
2
ba
|
936
sqft
|
built
1979
2794 Pinebrook Dr, Arnold, MO 63010
$-36
Cash flow
-0.8%
Cash-on-Cash Return
5.5%
Cap rate
0.7%
Rent to Value Ratio
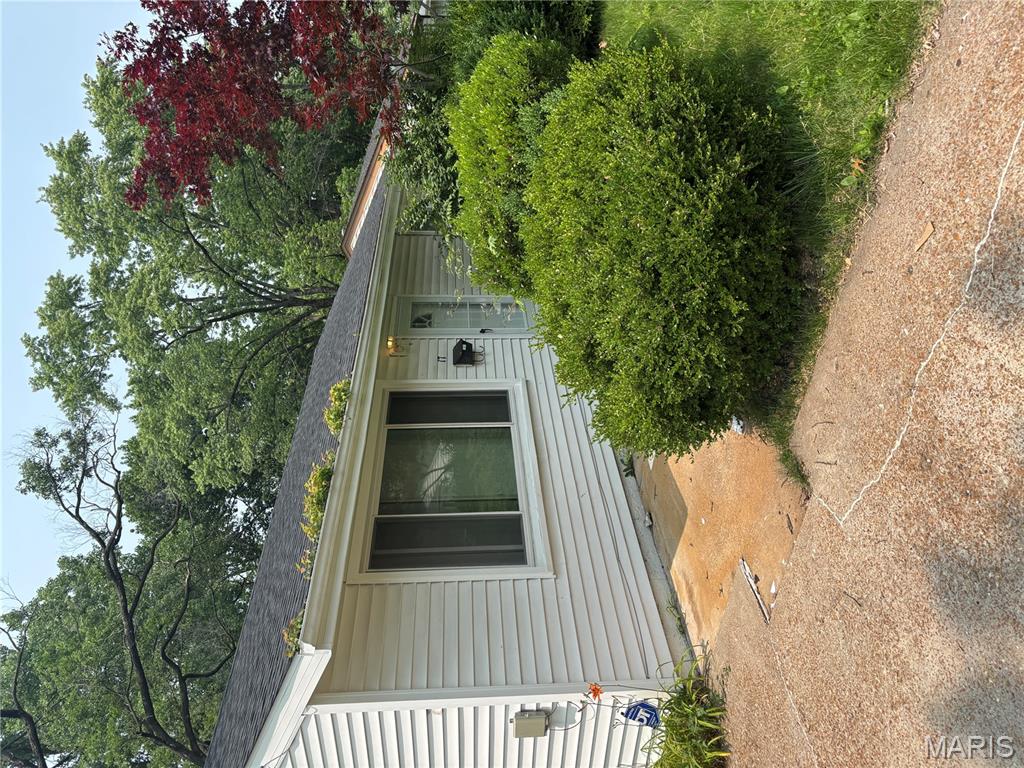
Active
$109,000
2
bds
|
1
ba
|
792
sqft
|
built
1955
17 Mary Ann Ct, Florissant, MO 63031
$106
Cash flow
5.1%
Cash-on-Cash Return
6.8%
Cap rate
1.0%
Rent to Value Ratio
Active
$278,000
3
bds
|
2
ba
|
1,420
sqft
|
built
2017
362 Augusta Pl, Union, MO 63084
$-229
Cash flow
-4.3%
Cash-on-Cash Return
4.7%
Cap rate
0.6%
Rent to Value Ratio
Pending
$200,000
3
bds
|
1
ba
|
1,170
sqft
|
built
1958
4945 N Highway 67, Florissant, MO 63034
$49
Cash flow
1.3%
Cash-on-Cash Return
6.0%
Cap rate
0.9%
Rent to Value Ratio
Active
$319,900
3
bds
|
2
ba
|
1,646
sqft
|
built
1964
2021 Gladiator Dr, Fenton, MO 63026
$-241
Cash flow
-3.9%
Cash-on-Cash Return
4.8%
Cap rate
0.7%
Rent to Value Ratio
Active
$799,000
3
bds
|
2
ba
|
1,862
sqft
|
built
1978
18668 Olive Street Rd, Chesterfield, MO 63005
$-1,777
Cash flow
-11.6%
Cash-on-Cash Return
3.0%
Cap rate
0.4%
Rent to Value Ratio
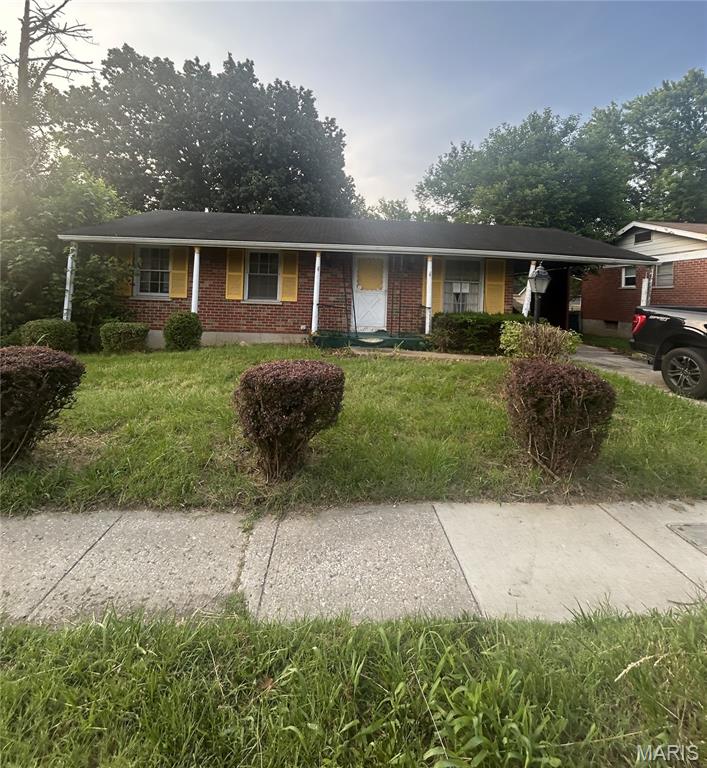
Active
$102,500
3
bds
|
1
ba
|
944
sqft
|
built
1938
13495 Old Halls Ferry Rd, Black Jack, MO 63033
$472
Cash flow
24.0%
Cash-on-Cash Return
11.2%
Cap rate
1.6%
Rent to Value Ratio
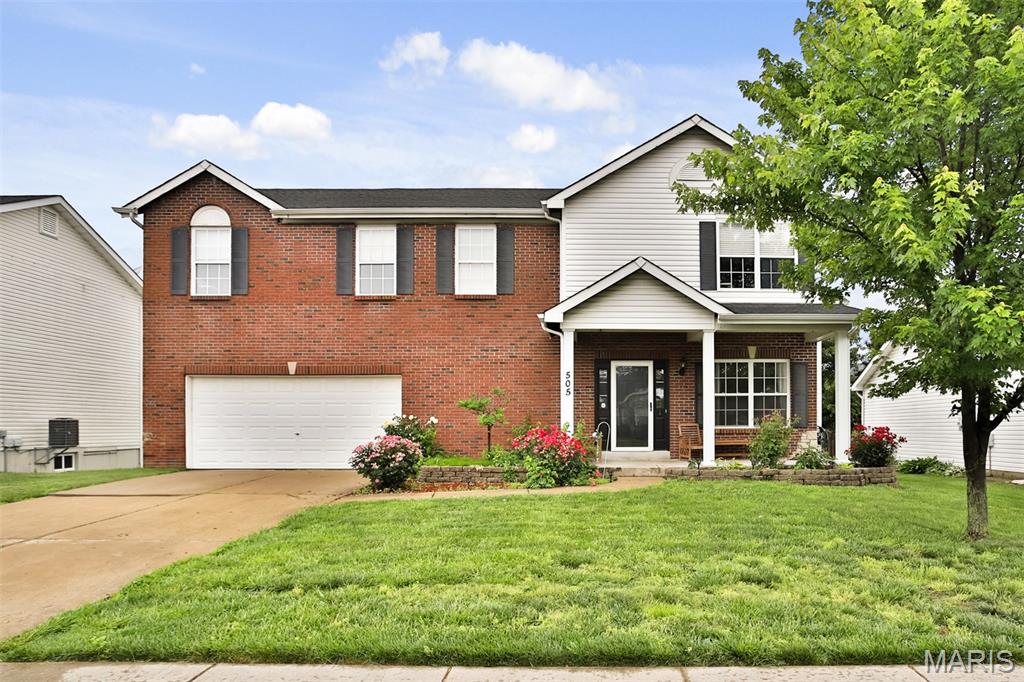
Active
$369,900
4
bds
|
5
ba
|
2,676
sqft
|
built
2004
505 Lias Way, Wentzville, MO 63385
$-560
Cash flow
-7.9%
Cash-on-Cash Return
3.9%
Cap rate
0.6%
Rent to Value Ratio
Active
$525,000
4
bds
|
3
ba
|
3,802
sqft
|
built
2014
408 Cottage Grove Dr, Wentzville, MO 63385
$-1,081
Cash flow
-10.7%
Cash-on-Cash Return
3.2%
Cap rate
0.5%
Rent to Value Ratio

Active
$190,000
4
bds
|
2
ba
|
2,128
sqft
|
built
2002
181 Madison Rene Ave, Moscow Mills, MO 63362
$83
Cash flow
2.3%
Cash-on-Cash Return
6.2%
Cap rate
0.8%
Rent to Value Ratio
Active
$475,000
4
bds
|
4
ba
|
2,459
sqft
|
built
1997
1214 Westrun Dr, Ballwin, MO 63021
$-729
Cash flow
-8.0%
Cash-on-Cash Return
3.8%
Cap rate
0.6%
Rent to Value Ratio
Active
$129,900
3
bds
|
1
ba
|
950
sqft
|
built
1952
7250 Howdershell Rd, Hazelwood, MO 63042
$329
Cash flow
13.2%
Cash-on-Cash Return
8.7%
Cap rate
1.2%
Rent to Value Ratio
Active
$130,000
3
bds
|
2
ba
|
1,980
sqft
|
built
1955
8361 Latty Ave, Hazelwood, MO 63042
$444
Cash flow
17.8%
Cash-on-Cash Return
9.8%
Cap rate
1.4%
Rent to Value Ratio
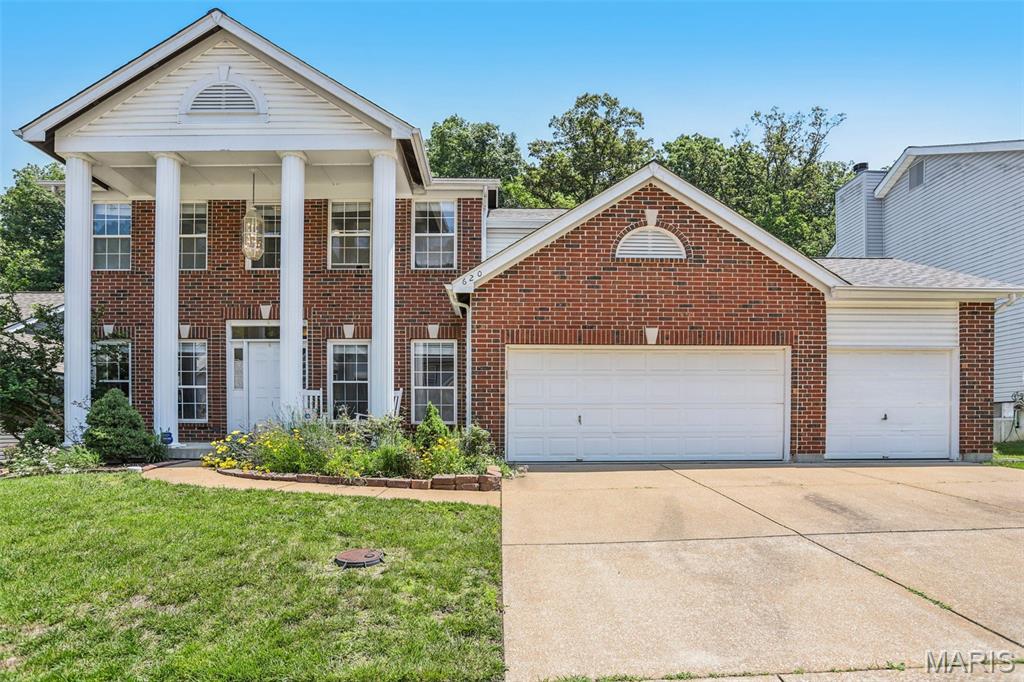
Active
$455,000
4
bds
|
3
ba
|
2,660
sqft
|
built
1997
620 Legends View Dr, Eureka, MO 63025
$-794
Cash flow
-9.1%
Cash-on-Cash Return
3.6%
Cap rate
0.6%
Rent to Value Ratio
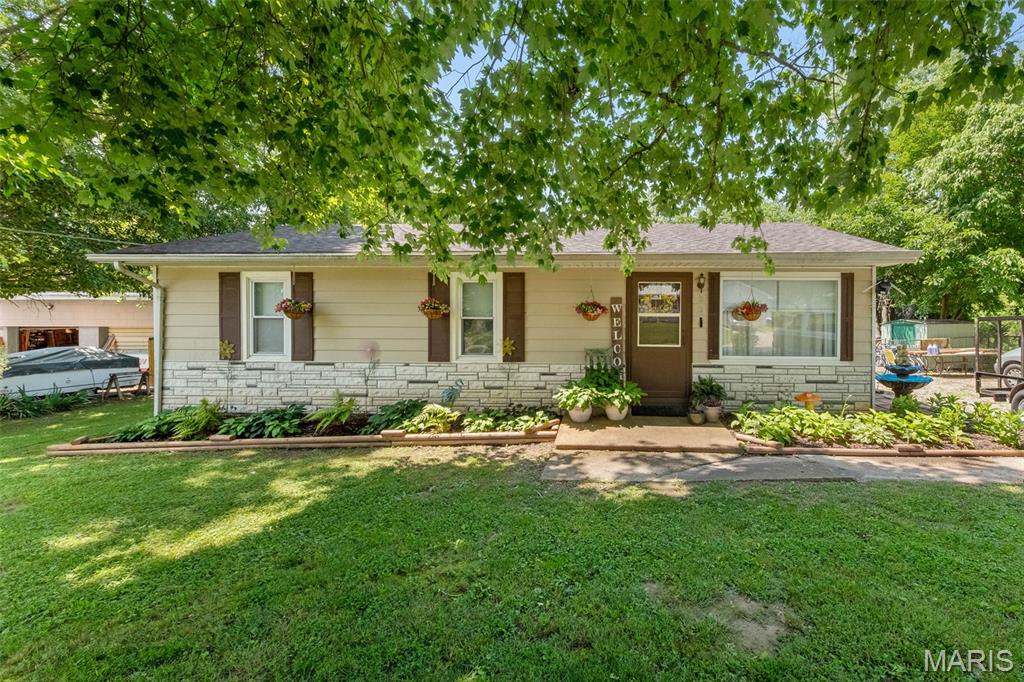
Active
$160,000
3
bds
|
1
ba
|
960
sqft
|
built
1961
22 Donna Dr, Hillsboro, MO 63050
$148
Cash flow
4.8%
Cash-on-Cash Return
6.8%
Cap rate
0.9%
Rent to Value Ratio
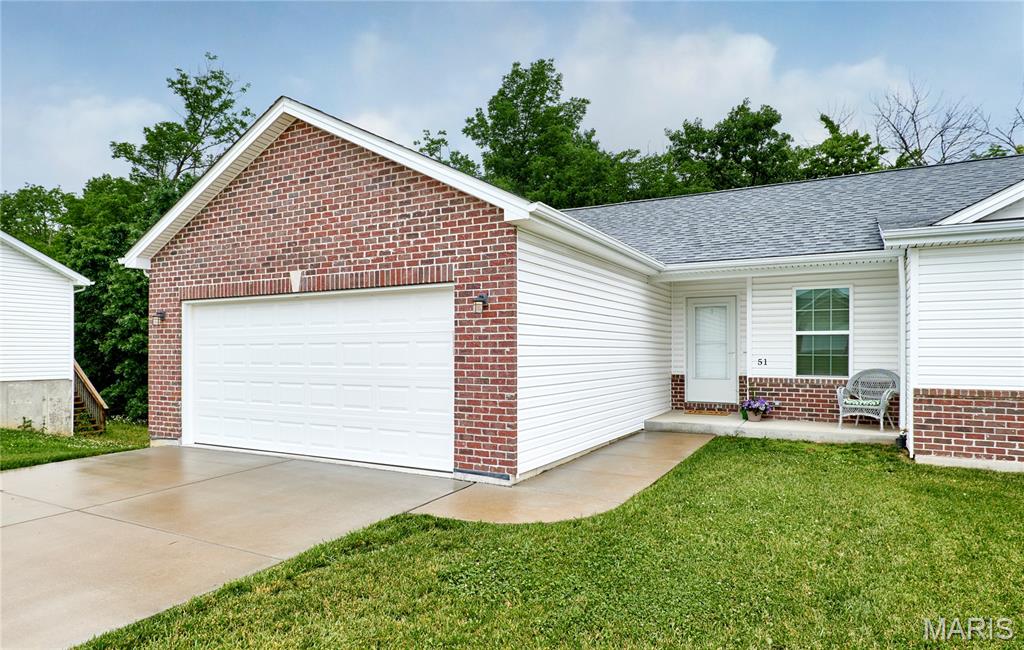
Active
$259,900
2
bds
|
2
ba
|
1,125
sqft
|
built
2022
51 Schulze Dr, Troy, MO 63379
$-286
Cash flow
-5.7%
Cash-on-Cash Return
4.4%
Cap rate
0.6%
Rent to Value Ratio
Active
$175,000
4
bds
|
0
ba
|
1,875
sqft
|
built
1956
945 Paddock Dr, Florissant, MO 63033
$76
Cash flow
2.3%
Cash-on-Cash Return
6.2%
Cap rate
0.9%
Rent to Value Ratio
Active
$122,400
bds
|
0
ba
|
764
sqft
|
built
1914
614 W Saint Louis St, De Soto, MO 63020
$179
Cash flow
7.6%
Cash-on-Cash Return
7.4%
Cap rate
1.0%
Rent to Value Ratio
Active
$30,500
3
bds
|
2
ba
|
1,262
sqft
|
built
2017
6647 Jenny Ct, Cedar Hill, MO 63016
$736
Cash flow
28.1%
Cash-on-Cash Return
29.0%
Cap rate
3.6%
Rent to Value Ratio
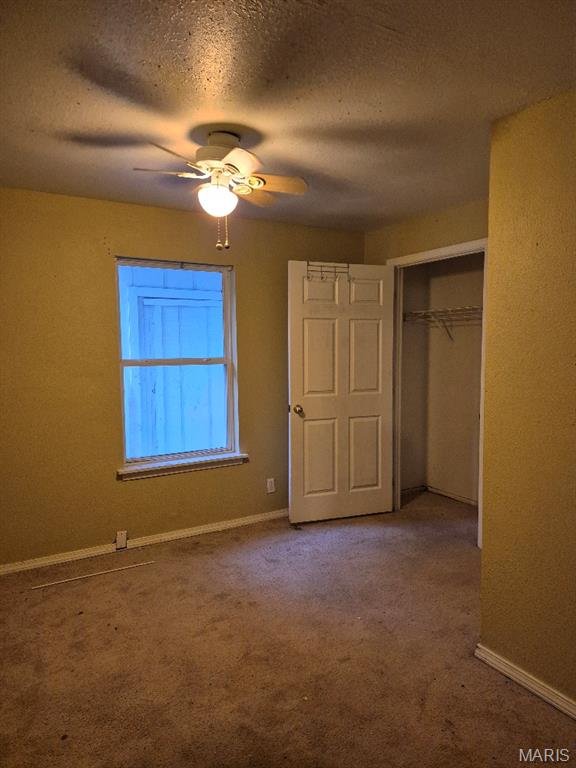
Active
$275,000
2
bds
|
2
ba
|
1,100
sqft
|
built
2022
5357 Lakepath Way, Eureka, MO 63025
$-573
Cash flow
-10.9%
Cash-on-Cash Return
3.2%
Cap rate
0.7%
Rent to Value Ratio
Active
$639,900
5
bds
|
4
ba
|
3,671
sqft
|
built
1988
615 Shadowridge Dr, Wildwood, MO 63011
$-1,146
Cash flow
-9.3%
Cash-on-Cash Return
3.5%
Cap rate
0.5%
Rent to Value Ratio
Active
$223,000
2
bds
|
3
ba
|
2,634
sqft
|
built
1989
1359 Eagles Way Ct, Hazelwood, MO 63042
$-91
Cash flow
-2.1%
Cash-on-Cash Return
5.2%
Cap rate
0.8%
Rent to Value Ratio
Active
$270,000
2
bds
|
2
ba
|
1,310
sqft
|
built
1978
922 Chestnut Ln, Union, MO 63084
$-321
Cash flow
-6.2%
Cash-on-Cash Return
4.3%
Cap rate
0.5%
Rent to Value Ratio