Mississippi Investment Properties for Sale
Browse homes for sale and investment properties in Mississippi. Refine your search by price, property type, or more.
Best cash flowing properties in Mississippi
Active
$125,000
3
bds
|
2
ba
|
0
sqft
|
built
1964
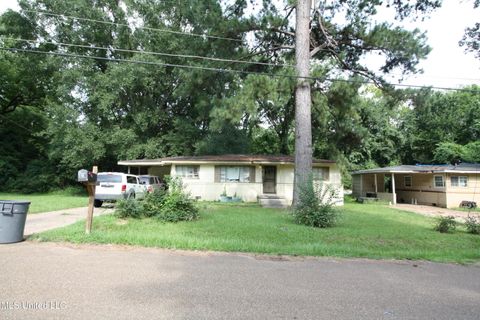
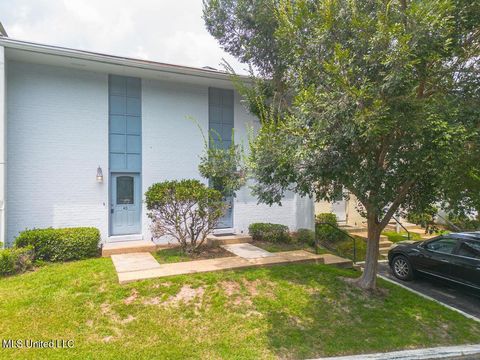
1173 Northwest Ave, Durant, MS 39063
$618
Cash flow
25.8%
Cash-on-Cash Return
11.6%
Cap rate
1.4%
Rent to Value Ratio
Active
$29,500
3
bds
|
1
ba
|
0
sqft
|
built
1954
2632 Shannon St, Jackson, MS 39212
$617
Cash flow
24.4%
Cash-on-Cash Return
25.1%
Cap rate
3.4%
Rent to Value Ratio
2,589 out of 3,687 properties for sale in Mississippi
Limited Results Shown
Create a free account, or log in to reveal all property listings and enjoy the complete experience.

Active
$304,999
3
bds
|
2
ba
|
0
sqft
|
built
2003
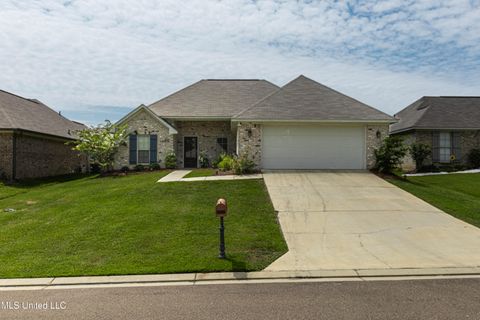
2595 Hunters Pointe Dr, Southaven, MS 38672
$6
Cash flow
0.1%
Cash-on-Cash Return
5.7%
Cap rate
0.8%
Rent to Value Ratio
Active
$519,900
5
bds
|
3
ba
|
0
sqft
|
built
2010
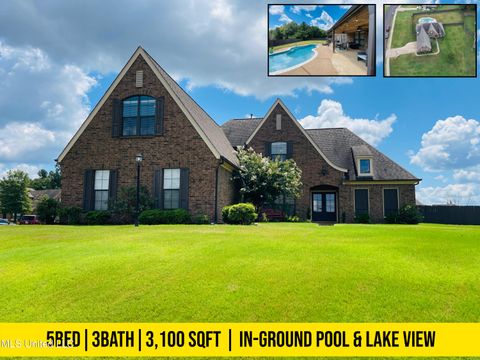
14291 Buttercup Dr, Olive Branch, MS 38654
$-577
Cash flow
-5.8%
Cash-on-Cash Return
4.3%
Cap rate
0.6%
Rent to Value Ratio
Active
$249,900
3
bds
|
2
ba
|
0
sqft
|
built
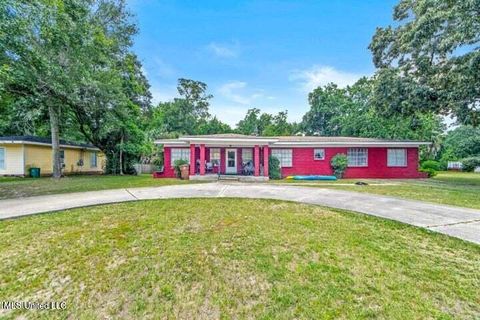
1965
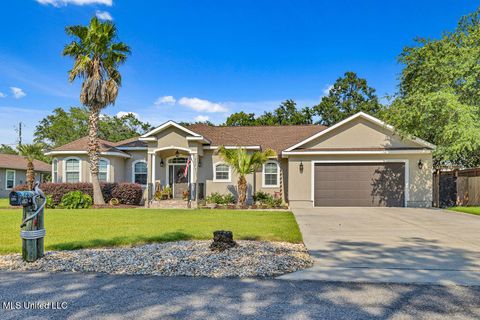
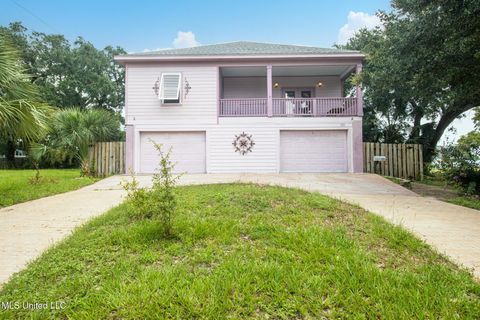
112 Olson Ave, Long Beach, MS 39560
$100
Cash flow
2.1%
Cash-on-Cash Return
6.2%
Cap rate
0.8%
Rent to Value Ratio
Active
$669,000
3
bds
|
3
ba
|
0
sqft
|
built
2017
205 S Lang Ave, Long Beach, MS 39560
$-1,275
Cash flow
-9.9%
Cash-on-Cash Return
3.4%
Cap rate
0.5%
Rent to Value Ratio
Active
$350,000
3
bds
|
2
ba
|
0
sqft
|
built
2013
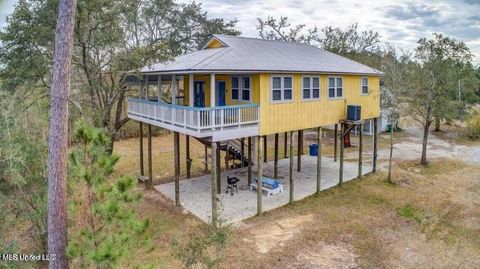
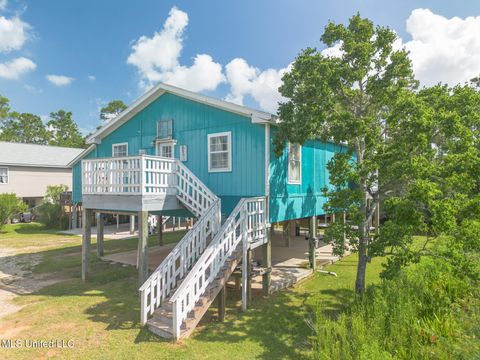
10450 Highway 603, Bay Saint Louis, MS 39520
$-566
Cash flow
-8.4%
Cash-on-Cash Return
3.7%
Cap rate
0.6%
Rent to Value Ratio
Active
$199,000
3
bds
|
2
ba
|
0
sqft
|
built
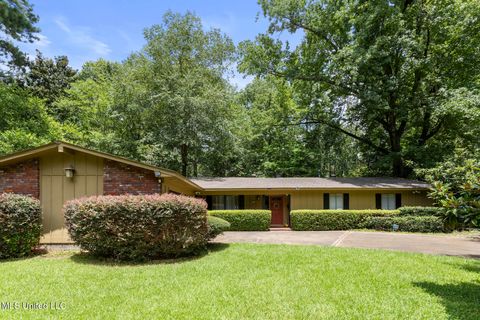
1967
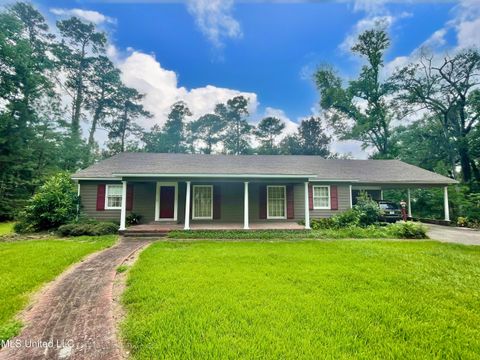
5120 Reddoch Dr, Jackson, MS 39211
$65
Cash flow
1.7%
Cash-on-Cash Return
6.1%
Cap rate
0.9%
Rent to Value Ratio
Active
$399,900
5
bds
|
3
ba
|
0
sqft
|
built
2025
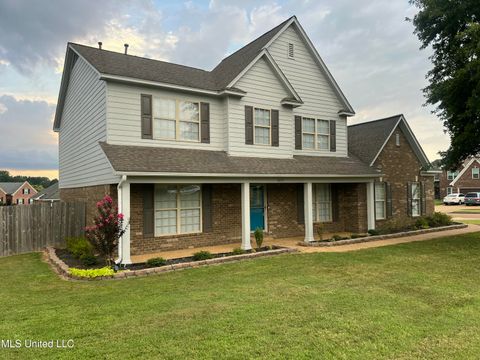
4213 Sidlehill Dr, Olive Branch, MS 38654
$-201
Cash flow
-2.6%
Cash-on-Cash Return
5.1%
Cap rate
0.7%
Rent to Value Ratio
Active
$250,000
2
bds
|
2
ba
|
0
sqft
|
built
2011
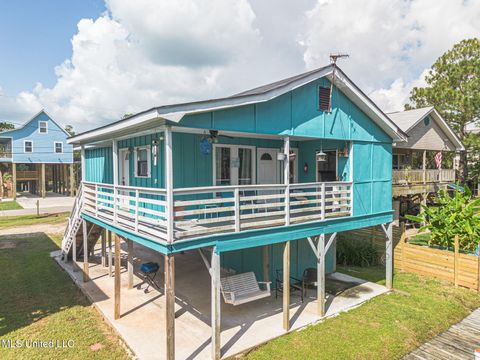
4250 1st Ave, Bay Saint Louis, MS 39520
$-17
Cash flow
-0.4%
Cash-on-Cash Return
5.6%
Cap rate
0.8%
Rent to Value Ratio
Active
$286,900
4
bds
|
3
ba
|
0
sqft
|
built
1980
1509 Oak Leaf Cir, Gautier, MS 39553
$-116
Cash flow
-2.1%
Cash-on-Cash Return
5.2%
Cap rate
0.7%
Rent to Value Ratio
Active
$155,000
3
bds
|
2
ba
|
0
sqft
|
built
1972
3432 Dundee Ln, Jackson, MS 39212
$405
Cash flow
13.6%
Cash-on-Cash Return
8.8%
Cap rate
1.1%
Rent to Value Ratio
Active
$220,000
2
bds
|
2
ba
|
0
sqft
|
built
1990
4254 1st Ave, Bay Saint Louis, MS 39520
$-29
Cash flow
-0.7%
Cash-on-Cash Return
5.5%
Cap rate
0.7%
Rent to Value Ratio
Active
$134,900
1
bds
|
2
ba
|
0
sqft
|
built
1972
3230 Cumberland Rd, Ocean Springs, MS 39564
$-126
Cash flow
-4.9%
Cash-on-Cash Return
4.6%
Cap rate
1.2%
Rent to Value Ratio
Active
$310,000
3
bds
|
2
ba
|
0
sqft
|
built
2006
7621 Falcon Cir, Ocean Springs, MS 39564
$-217
Cash flow
-3.7%
Cash-on-Cash Return
4.8%
Cap rate
0.6%
Rent to Value Ratio
Active
$269,900
3
bds
|
2
ba
|
0
sqft
|
built
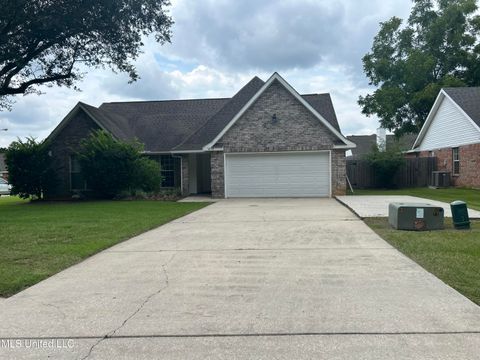
2021
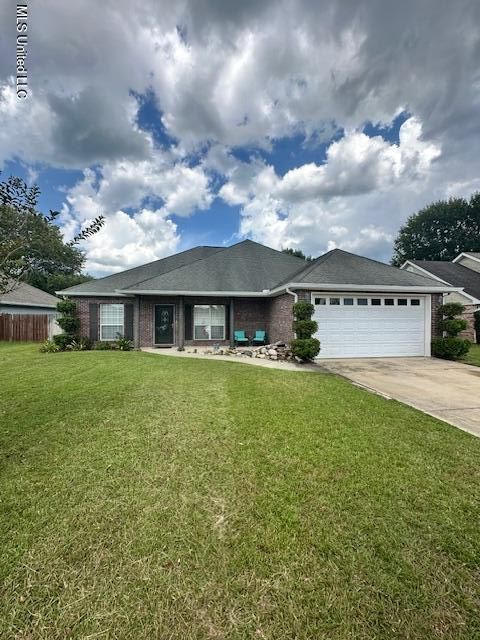
938 Filmore Dr, Brandon, MS 39042
$241
Cash flow
4.7%
Cash-on-Cash Return
6.7%
Cap rate
0.8%
Rent to Value Ratio
Active
$145,000
3
bds
|
2
ba
|
0
sqft
|
built
1950
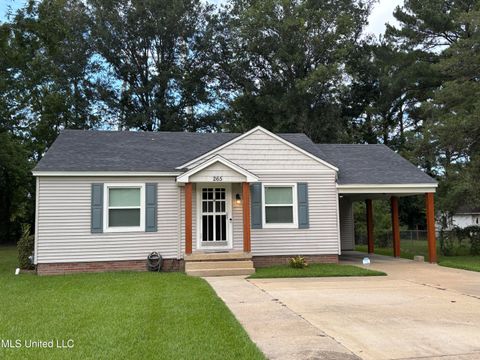
265 Lamar St, Durant, MS 39063
$47
Cash flow
1.7%
Cash-on-Cash Return
6.1%
Cap rate
0.8%
Rent to Value Ratio
Active
$268,000
4
bds
|
2
ba
|
0
sqft
|
built
1942
4304 Council Cir, Jackson, MS 39206
$76
Cash flow
1.5%
Cash-on-Cash Return
6.0%
Cap rate
0.8%
Rent to Value Ratio
Active
$315,000
3
bds
|
3
ba
|
0
sqft
|
built
2013
4680 W Petite Loop, Olive Branch, MS 38654
$-137
Cash flow
-2.3%
Cash-on-Cash Return
5.2%
Cap rate
0.7%
Rent to Value Ratio
Active
$195,500
3
bds
|
2
ba
|
0
sqft
|
built
1964
204 Chatham Dr, Holly Springs, MS 38635
$5
Cash flow
0.1%
Cash-on-Cash Return
5.7%
Cap rate
0.8%
Rent to Value Ratio
Active
$205,000
3
bds
|
2
ba
|
0
sqft
|
built
1984
6505 Riverdale Rd, Horn Lake, MS 38637
$74
Cash flow
1.9%
Cash-on-Cash Return
6.1%
Cap rate
0.8%
Rent to Value Ratio
Active
$179,500
2
bds
|
2
ba
|
0
sqft
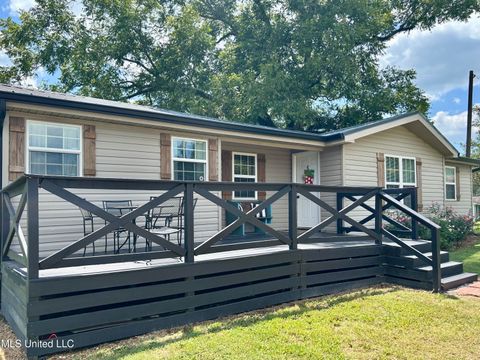
|
built
1957
114 Dogwood Dr, Hazlehurst, MS 39083
$372
Cash flow
10.8%
Cash-on-Cash Return
8.2%
Cap rate
1.0%
Rent to Value Ratio
Active
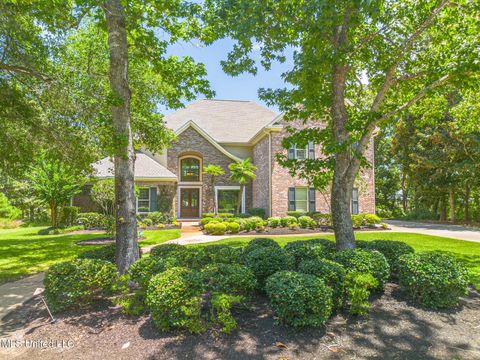
$480,000
4
bds
|
3
ba
|
0
sqft
|
built
2022
1415 Alphabet Rd, Gulfport, MS 39503
$-732
Cash flow
-8.0%
Cash-on-Cash Return
3.9%
Cap rate
0.6%
Rent to Value Ratio
Active
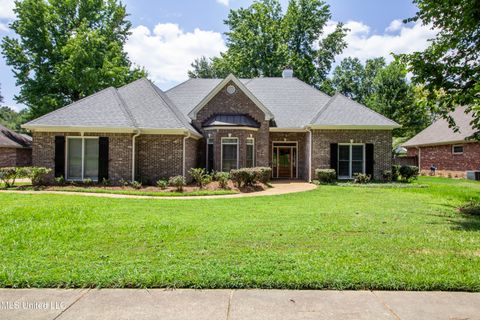
$349,900
4
bds
|
3
ba
|
0
sqft
|
built
1999
636 Berridge Dr, Ridgeland, MS 39157
$-90
Cash flow
-1.3%
Cash-on-Cash Return
5.4%
Cap rate
0.7%
Rent to Value Ratio
Active
$1,725,000
5
bds
|
7
ba
|
0
sqft
|
built
2005
18 Sauvolle Ct, Ocean Springs, MS 39564
$-5,848
Cash flow
-17.7%
Cash-on-Cash Return
1.6%
Cap rate
0.3%
Rent to Value Ratio
Active
$425,000
3
bds
|
2
ba
|
0
sqft
|
built
2007
126 Miramar Ave, Biloxi, MS 39530
$-557
Cash flow
-6.8%
Cash-on-Cash Return
4.1%
Cap rate
0.5%
Rent to Value Ratio
Active
$725,000
4
bds
|
3
ba
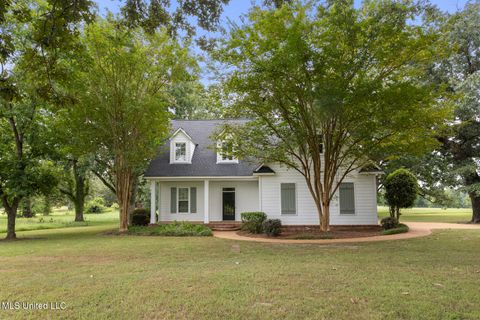
|
0
sqft
|
built
2000
875 Robinson Rd, Canton, MS 39046
$-1,162
Cash flow
-8.4%
Cash-on-Cash Return
3.8%
Cap rate
0.5%
Rent to Value Ratio
Active
$235,000
4
bds
|
2
ba
|
0
sqft
|
built
2007
14130 Mays Rd, Gulfport, MS 39503
$218
Cash flow
4.8%
Cash-on-Cash Return
6.8%
Cap rate
0.9%
Rent to Value Ratio
Active
$158,000
3
bds
|
2
ba
|
0
sqft
|
built
1972
3048 Georgetown St, Hazlehurst, MS 39083
$18
Cash flow
0.6%
Cash-on-Cash Return
5.8%
Cap rate
0.8%
Rent to Value Ratio
Active
$1,750,000
6
bds
|
7
ba
|
0
sqft
|
built
1984
3007 Beach Blvd, Pascagoula, MS 39567
$-7,651
Cash flow
-22.8%
Cash-on-Cash Return
0.4%
Cap rate
0.2%
Rent to Value Ratio
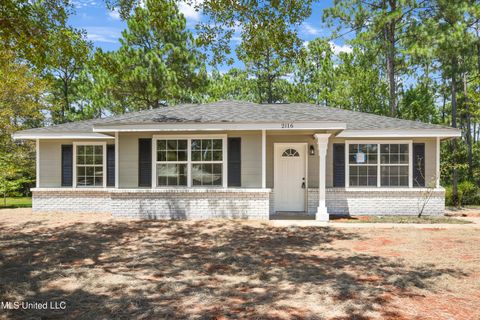
Active
$169,900
3
bds
|
1
ba
|
0
sqft
|
built
1997
2116 Prince George Dr, Gautier, MS 39553
$85
Cash flow
2.6%
Cash-on-Cash Return
6.3%
Cap rate
0.8%
Rent to Value Ratio
Active
$79,999
2
bds
|
1
ba
|
0
sqft
|
built
1950
410 Alta Woods Blvd, Jackson, MS 39204
$534
Cash flow
34.8%
Cash-on-Cash Return
13.7%
Cap rate
1.8%
Rent to Value Ratio
Active
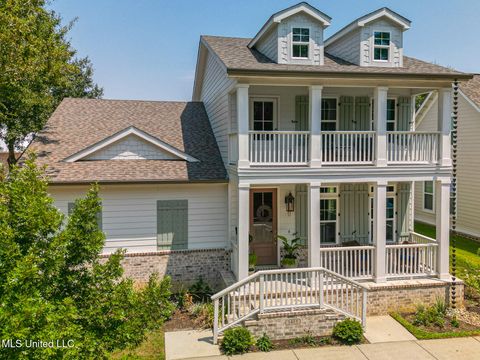
$445,000
4
bds
|
3
ba
|
0
sqft
|
built
2004
2303 Rue Maison, Biloxi, MS 39532
$-399
Cash flow
-4.7%
Cash-on-Cash Return
4.6%
Cap rate
0.6%
Rent to Value Ratio
Active
$195,000
3
bds
|
2
ba
|
0
sqft
|
built
1997
78 Walsh Cv, Jackson, MS 39272
$275
Cash flow
7.4%
Cash-on-Cash Return
7.4%
Cap rate
1.0%
Rent to Value Ratio
Active
$375,000
4
bds
|
4
ba
|
0
sqft
|
built
2008
111 Bellemeade Trce, Clinton, MS 39056
$-283
Cash flow
-3.9%
Cash-on-Cash Return
4.8%
Cap rate
0.7%
Rent to Value Ratio
Active
$322,000
3
bds
|
2
ba
|
0
sqft
|
built
2001
2252 Beach Dr, Gulfport, MS 39507
$-875
Cash flow
-14.2%
Cash-on-Cash Return
2.4%
Cap rate
0.8%
Rent to Value Ratio
Active
$425,000
4
bds
|
3
ba
|
0
sqft
|
built
2021
508 Wales Way, Flowood, MS 39232
$-43
Cash flow
-0.5%
Cash-on-Cash Return
5.6%
Cap rate
0.8%
Rent to Value Ratio
Active
$295,500
3
bds
|
2
ba
|
0
sqft
|
built
1996
17994 Lake Breeze Dr, Saucier, MS 39574
$239
Cash flow
4.2%
Cash-on-Cash Return
6.6%
Cap rate
0.8%
Rent to Value Ratio
Active
$378,500
3
bds
|
2
ba
|
0
sqft
|
built
1950
1056 Avondale St, Jackson, MS 39216
$154
Cash flow
2.1%
Cash-on-Cash Return
6.2%
Cap rate
0.8%
Rent to Value Ratio

Active
$483,000
4
bds
|
4
ba
|
0
sqft
|
built
1974
687 Oahu St, Diamondhead, MS 39525
$-506
Cash flow
-5.5%
Cash-on-Cash Return
4.4%
Cap rate
0.6%
Rent to Value Ratio