Utah Investment Properties for Sale
Browse homes for sale and investment properties in Utah. Refine your search by price, property type, or more.
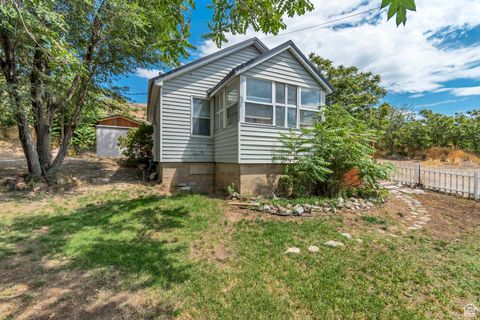
Best cash flowing properties in Utah
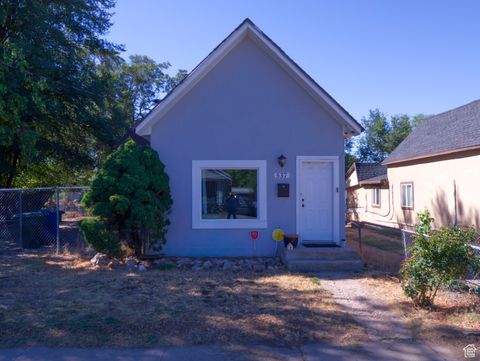
Active
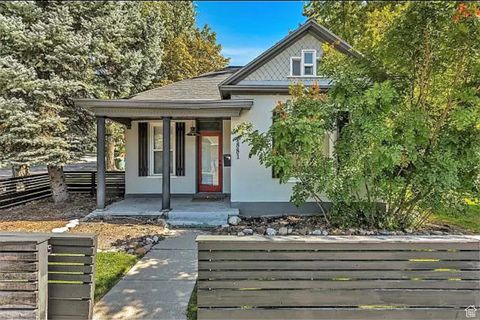
$334,900
3
bds
|
1
ba
|
1,360
sqft
|
built
1926
537 Cook St, Ogden, UT 84404
$-516
Cash flow
-8.0%
Cash-on-Cash Return
3.8%
Cap rate
0.5%
Rent to Value Ratio
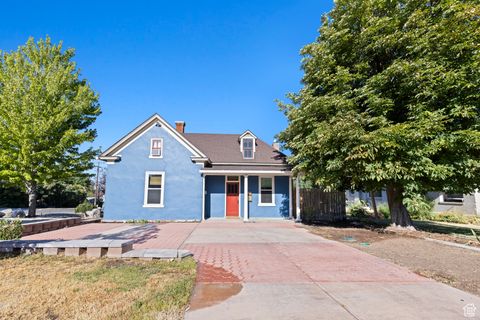
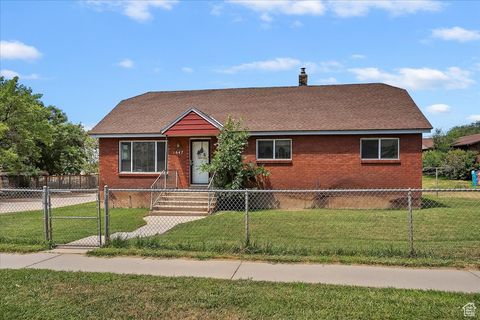
Active
$369,900
4
bds
|
2
ba
|
1,436
sqft
|
built
1925
105 N 300 W, Brigham City, UT 84302
$-556
Cash flow
-7.8%
Cash-on-Cash Return
3.9%
Cap rate
0.5%
Rent to Value Ratio
3,130 out of 5,011 properties for sale in Utah
Limited Results Shown
Create a free account, or log in to reveal all property listings and enjoy the complete experience.
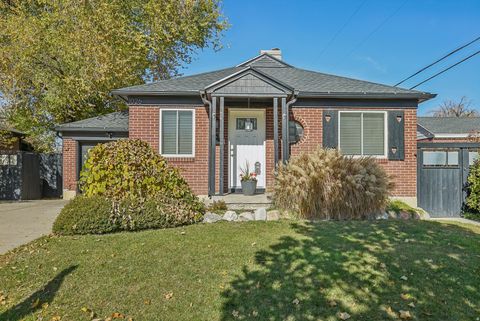
Active
$494,900
4
bds
|
1
ba
|
1,564
sqft
|
built
1950
1026 W 800 N, Salt Lake City, UT 84116
$-1,405
Cash flow
-14.8%
Cash-on-Cash Return
2.3%
Cap rate
0.3%
Rent to Value Ratio
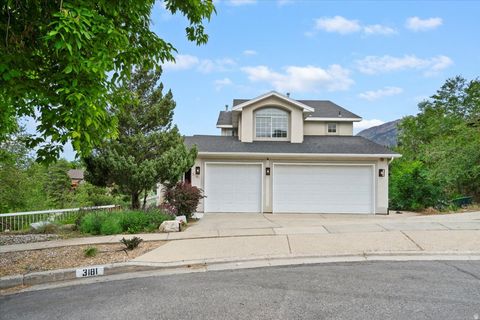
Active
$949,000
5
bds
|
4
ba
|
3,818
sqft
|
built
1992
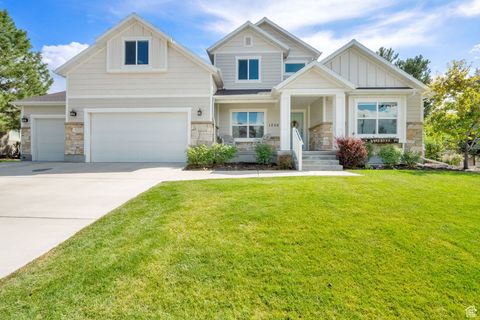
3181 E Deer Creek Cir, Cottonwood Heights, UT 84121
$-2,682
Cash flow
-14.7%
Cash-on-Cash Return
2.3%
Cap rate
0.3%
Rent to Value Ratio

Active
$510,000
4
bds
|
3
ba
|
2,467
sqft
|
built
2011
642 W Mulberry St, Stansbury Park, UT 84074
$-969
Cash flow
-9.9%
Cash-on-Cash Return
3.4%
Cap rate
0.5%
Rent to Value Ratio
Active
$529,900
3
bds
|
3
ba
|
2,830
sqft
|
built
2017
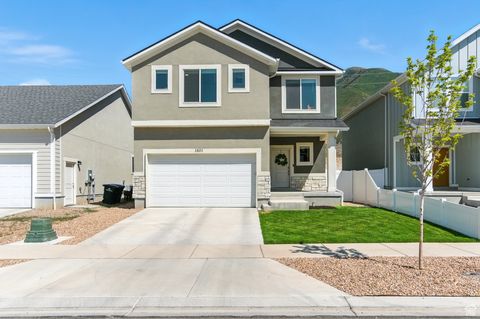
1371 W Stewart Falls Dr, Riverton, UT 84065
$-1,365
Cash flow
-13.4%
Cash-on-Cash Return
2.6%
Cap rate
0.4%
Rent to Value Ratio
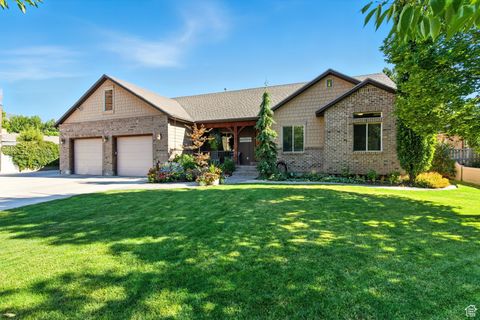
Active
$500,000
5
bds
|
3
ba
|
2,207
sqft
|
built
2003
3649 W 800 S, Syracuse, UT 84075
$-837
Cash flow
-8.7%
Cash-on-Cash Return
3.7%
Cap rate
0.5%
Rent to Value Ratio
Active
$750,000
4
bds
|
2
ba
|
7,768
sqft
|
built
1884
389 W 500 S, Provo, UT 84601
$-1,616
Cash flow
-11.2%
Cash-on-Cash Return
3.1%
Cap rate
0.5%
Rent to Value Ratio
Active
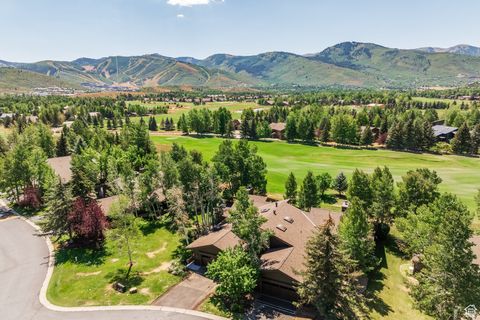
$2,675,000
4
bds
|
4
ba
|
4,108
sqft
|
built
2024
1385 Lasso Trl, Hideout, UT 84036
$-8,015
Cash flow
-15.6%
Cash-on-Cash Return
2.1%
Cap rate
0.3%
Rent to Value Ratio
Active
$939,000
7
bds
|
4
ba
|
4,650
sqft
|
built
2016
1206 E 1150 S, Springville, UT 84663
$-2,701
Cash flow
-15.0%
Cash-on-Cash Return
2.2%
Cap rate
0.3%
Rent to Value Ratio
Active
$350,000
3
bds
|
2
ba
|
1,512
sqft
|
built
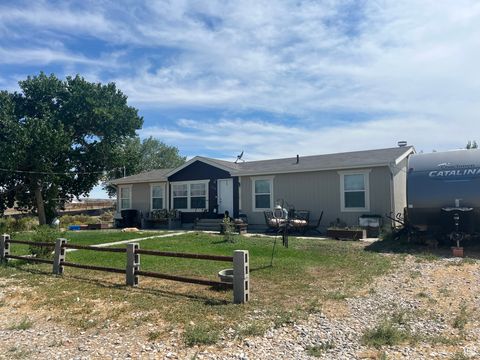
2010
7130 E 2100 S, Price, UT 84501
$-651
Cash flow
-9.7%
Cash-on-Cash Return
3.4%
Cap rate
0.5%
Rent to Value Ratio

Active
$549,900
3
bds
|
2
ba
|
2,312
sqft
|
built
1949
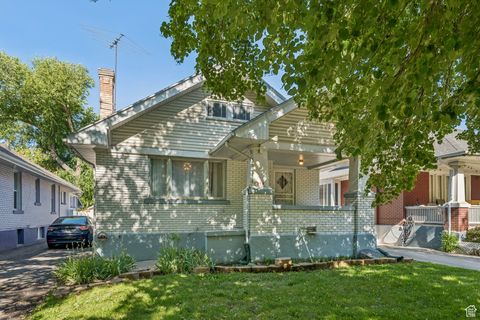
197 W 2nd St, Ogden, UT 84404
$-1,309
Cash flow
-12.4%
Cash-on-Cash Return
2.8%
Cap rate
0.4%
Rent to Value Ratio
Active
$1,350,000
4
bds
|
3
ba
|
4,248
sqft
|
built
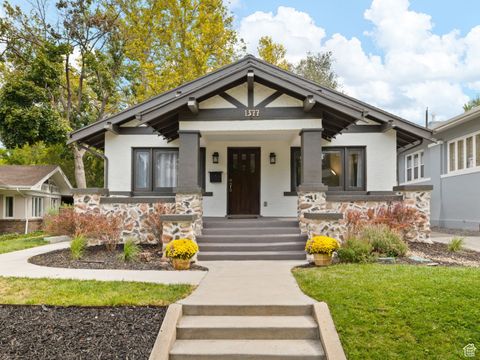
1916
1377 E Butler Ave, Salt Lake City, UT 84102
$-2,972
Cash flow
-11.5%
Cash-on-Cash Return
3.0%
Cap rate
0.4%
Rent to Value Ratio
Active
$475,000
1
bds
|
1
ba
|
634
sqft
|
built
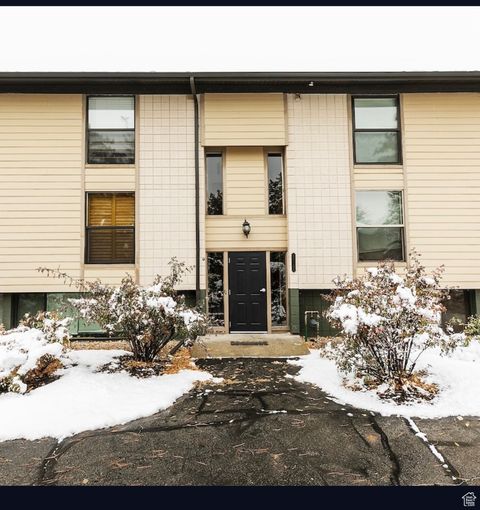
1976
1150 Deer Valley Dr, Park City, UT 84060
$-903
Cash flow
-9.9%
Cash-on-Cash Return
3.4%
Cap rate
0.5%
Rent to Value Ratio
Active
$459,990
6
bds
|
2
ba
|
2,384
sqft
|
built
1954
678 S 300 E, Springville, UT 84663
$-644
Cash flow
-7.3%
Cash-on-Cash Return
4.0%
Cap rate
0.5%
Rent to Value Ratio
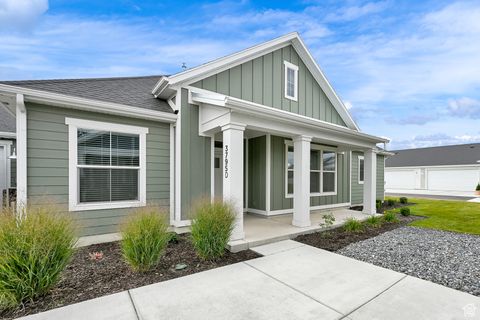
Active
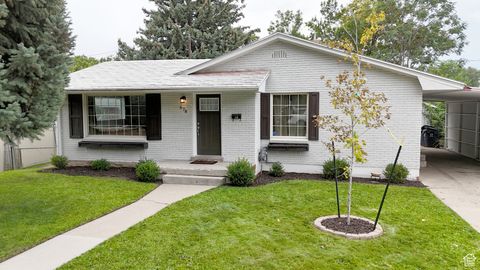
$494,990
3
bds
|
3
ba
|
2,362
sqft
|
built
2023
3923 S White Ash Dr, Mapleton, UT 84664
$-1,184
Cash flow
-12.5%
Cash-on-Cash Return
2.8%
Cap rate
0.4%
Rent to Value Ratio
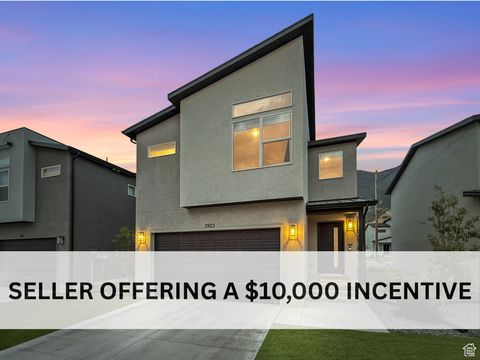
Active
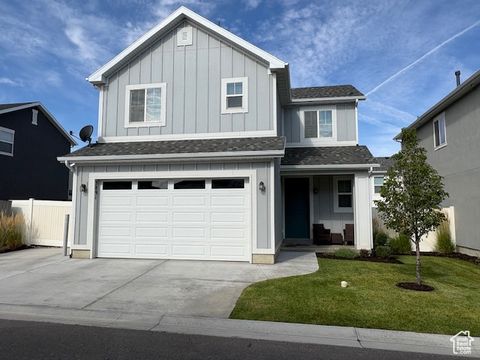
$539,000
3
bds
|
3
ba
|
2,354
sqft
|
built
2021
715 S Miller Ave, North Salt Lake, UT 84054
$-1,359
Cash flow
-13.2%
Cash-on-Cash Return
2.7%
Cap rate
0.4%
Rent to Value Ratio
Active
$1,200,000
3
bds
|
3
ba
|
2,127
sqft
|
built
2013
285 W Burnts Field Rd, Midway, UT 84049
$-3,548
Cash flow
-15.4%
Cash-on-Cash Return
2.1%
Cap rate
0.3%
Rent to Value Ratio
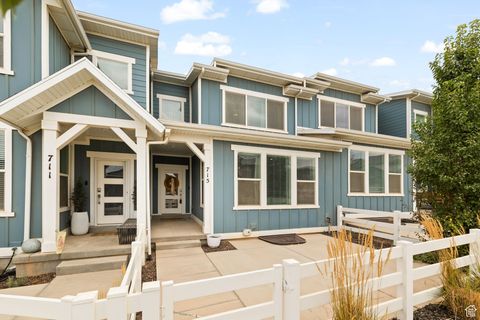
Active
$534,990
3
bds
|
3
ba
|
3,229
sqft
|
built
2023
1501 S 3750 E, Spanish Fork, UT 84660
$-1,195
Cash flow
-11.7%
Cash-on-Cash Return
3.0%
Cap rate
0.4%
Rent to Value Ratio
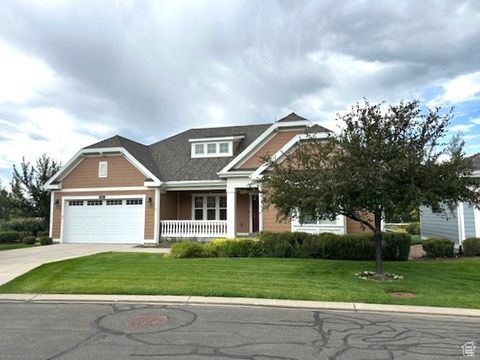
Active
$454,900
3
bds
|
3
ba
|
1,460
sqft
|
built
2020
3891 S 2940 W, West Haven, UT 84401
$-1,022
Cash flow
-11.7%
Cash-on-Cash Return
3.0%
Cap rate
0.4%
Rent to Value Ratio
Active
$589,900
2
bds
|
1
ba
|
792
sqft
|
built
1920
1220 N Hillside Dr, Genola, UT 84655
$-2,077
Cash flow
-18.4%
Cash-on-Cash Return
1.5%
Cap rate
0.2%
Rent to Value Ratio
Active
$430,000
3
bds
|
1
ba
|
1,392
sqft
|
built
1945
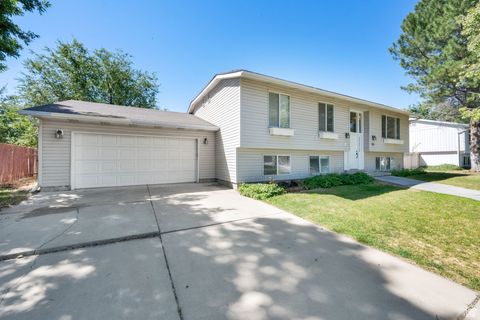
1647 N Washington Blvd, Ogden, UT 84404
$-986
Cash flow
-12.0%
Cash-on-Cash Return
2.9%
Cap rate
0.4%
Rent to Value Ratio
Active
$3,325,000
4
bds
|
4
ba
|
3,452
sqft
|
built
1980
2903 Sunny Slopes Ct, Park City, UT 84060
$-12,449
Cash flow
-19.5%
Cash-on-Cash Return
1.2%
Cap rate
0.2%
Rent to Value Ratio
Active
$650,000
4
bds
|
4
ba
|
1,551
sqft
|
built
1902
1881 S 1100 E, Salt Lake City, UT 84105
$-1,797
Cash flow
-14.4%
Cash-on-Cash Return
2.4%
Cap rate
0.3%
Rent to Value Ratio
Active
$875,000
7
bds
|
4
ba
|
4,182
sqft
|
built
2006
1062 E 350 S, Springville, UT 84663
$-2,857
Cash flow
-17.0%
Cash-on-Cash Return
1.8%
Cap rate
0.3%
Rent to Value Ratio
Active
$519,000
3
bds
|
2
ba
|
1,818
sqft
|
built
2023
3795 S 4250 W, West Haven, UT 84401
$-1,595
Cash flow
-16.0%
Cash-on-Cash Return
2.0%
Cap rate
0.3%
Rent to Value Ratio
Active
$560,000
5
bds
|
3
ba
|
2,288
sqft
|
built
1975
849 W 225 S, Orem, UT 84058
$-1,301
Cash flow
-12.1%
Cash-on-Cash Return
2.9%
Cap rate
0.4%
Rent to Value Ratio
Active
$769,000
4
bds
|
2
ba
|
2,369
sqft
|
built
1914
714 S 600 E, Salt Lake City, UT 84102
$-1,708
Cash flow
-11.6%
Cash-on-Cash Return
3.0%
Cap rate
0.4%
Rent to Value Ratio
Active
$865,000
4
bds
|
4
ba
|
3,918
sqft
|
built
2006
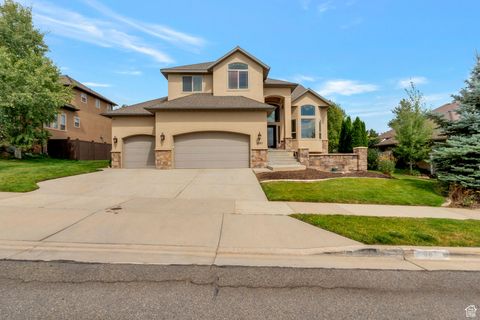
2087 E Eagle Crest Dr, Draper, UT 84020
$-2,109
Cash flow
-12.7%
Cash-on-Cash Return
2.8%
Cap rate
0.4%
Rent to Value Ratio
Active
$749,000
5
bds
|
3
ba
|
3,311
sqft
|
built
1997
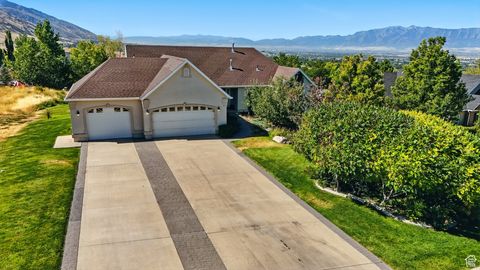
1990 E Canyon Ridge Dr, North Logan, UT 84341
$-1,918
Cash flow
-13.4%
Cash-on-Cash Return
2.6%
Cap rate
0.4%
Rent to Value Ratio
Active
$500,000
3
bds
|
4
ba
|
2,088
sqft
|
built
2001
239 E 7350 S, Midvale, UT 84047
$-1,284
Cash flow
-13.4%
Cash-on-Cash Return
2.6%
Cap rate
0.4%
Rent to Value Ratio
Active
$565,000
4
bds
|
3
ba
|
2,800
sqft
|
built
2008
2318 S 3450 W, Syracuse, UT 84075
$-993
Cash flow
-9.2%
Cash-on-Cash Return
3.6%
Cap rate
0.5%
Rent to Value Ratio
Active
$314,900
2
bds
|
2
ba
|
955
sqft
|
built
1996
1191 W 1275 S, Orem, UT 84058
$-833
Cash flow
-13.8%
Cash-on-Cash Return
2.5%
Cap rate
0.4%
Rent to Value Ratio
Active
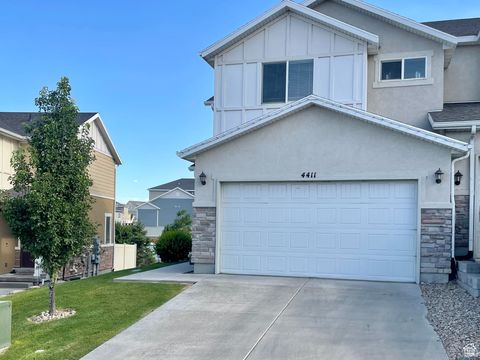
$459,900
3
bds
|
3
ba
|
2,060
sqft
|
built
2016
4411 W Meadow Path Ln, Herriman, UT 84096
$-978
Cash flow
-11.1%
Cash-on-Cash Return
3.1%
Cap rate
0.5%
Rent to Value Ratio
Active
$639,000
4
bds
|
4
ba
|
2,910
sqft
|
built
2007
2189 N 2600 W, Lehi, UT 84043
$-1,074
Cash flow
-8.8%
Cash-on-Cash Return
3.7%
Cap rate
0.5%
Rent to Value Ratio
Active
$689,000
4
bds
|
4
ba
|
3,125
sqft
|
built
2012
1965 N 3050 W, Provo, UT 84601
$-1,635
Cash flow
-12.4%
Cash-on-Cash Return
2.8%
Cap rate
0.4%
Rent to Value Ratio
Active
$849,900
7
bds
|
4
ba
|
3,134
sqft
|
built
1921
182 E Kelsey Ave, Salt Lake City, UT 84111
$-2,517
Cash flow
-15.5%
Cash-on-Cash Return
2.1%
Cap rate
0.3%
Rent to Value Ratio
Active
$339,000
3
bds
|
2
ba
|
1,420
sqft
|
built
2007
982 W 960 N, Orem, UT 84057
$-851
Cash flow
-13.1%
Cash-on-Cash Return
2.7%
Cap rate
0.5%
Rent to Value Ratio
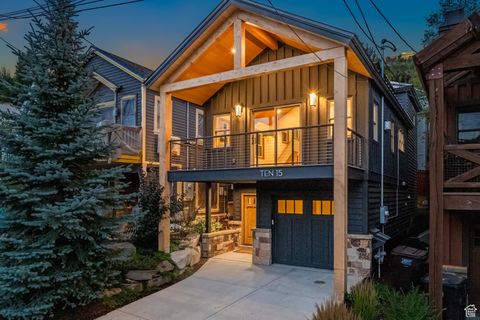
Active
$4,190,000
3
bds
|
3
ba
|
2,231
sqft
|
built
2004
1015 Norfolk Ave, Park City, UT 84060
$-15,964
Cash flow
-19.9%
Cash-on-Cash Return
1.1%
Cap rate
0.2%
Rent to Value Ratio
Active
$599,900
6
bds
|
3
ba
|
3,053
sqft
|
built
2005
2899 S 1080 W, Nibley, UT 84321
$-1,093
Cash flow
-9.5%
Cash-on-Cash Return
3.5%
Cap rate
0.5%
Rent to Value Ratio