South Carolina Investment Properties for Sale
Browse homes for sale and investment properties in South Carolina. Refine your search by price, property type, or more.
Best cash flowing properties in South Carolina
Active
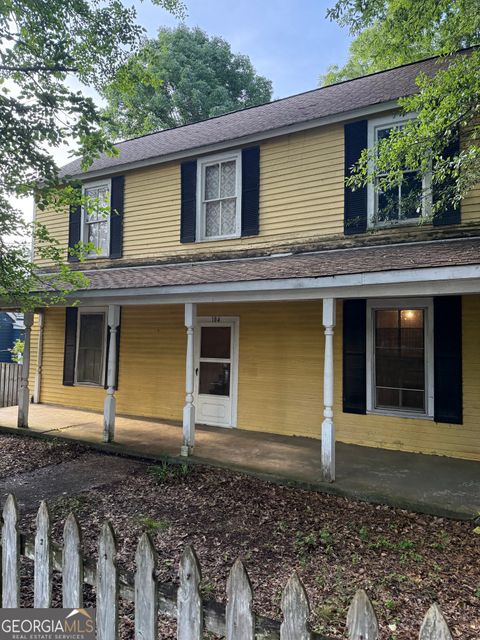
$79,500
3
bds
|
1
ba
|
2,291
sqft
|
built
1942
104 W Mauldin St, Walhalla, SC 29691
$779
Cash flow
51.1%
Cash-on-Cash Return
17.4%
Cap rate
2.3%
Rent to Value Ratio

Active
$185,000
9
bds
|
4
ba
|
0
sqft
|
built
1955
1481 Center Street Ext, Mount Pleasant, SC
$643
Cash flow
18.1%
Cash-on-Cash Return
9.8%
Cap rate
1.2%
Rent to Value Ratio
30 out of 86 properties for sale in South Carolina
Limited Results Shown
Create a free account, or log in to reveal all property listings and enjoy the complete experience.
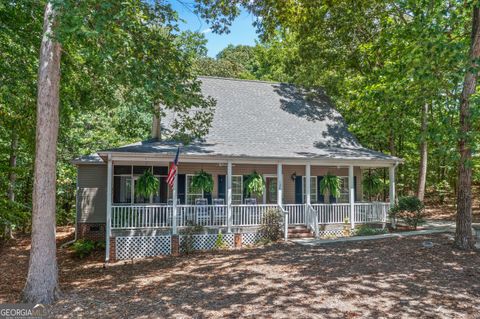
Active
$483,000
3
bds
|
2.5
ba
|
2,421
sqft
|
built
1997
137 Indian Hills Dr, Westminster, SC 29693
$-800
Cash flow
-8.6%
Cash-on-Cash Return
3.7%
Cap rate
0.5%
Rent to Value Ratio
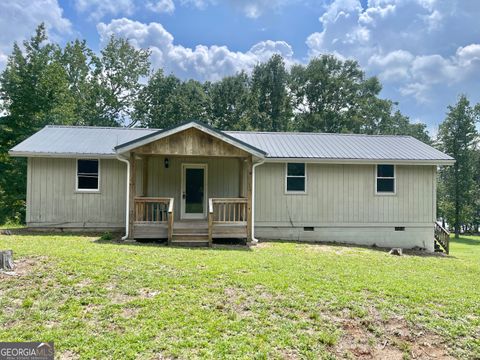
Active
$198,800
3
bds
|
3
ba
|
1,571
sqft
|
built
1974
432 Hyde Cove Dr, Fair Play, SC 29643
$10
Cash flow
0.3%
Cash-on-Cash Return
5.7%
Cap rate
0.8%
Rent to Value Ratio
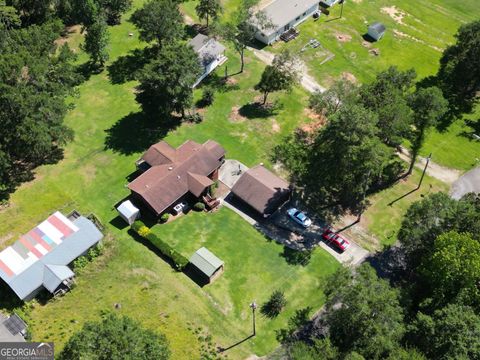
Active
$405,000
4
bds
|
2
ba
|
3,504
sqft
|
built
1983
428 Hyde Cove Dr, Fair Play, SC 29643
$-463
Cash flow
-6.0%
Cash-on-Cash Return
4.3%
Cap rate
0.5%
Rent to Value Ratio
Active
$2,999,000
5
bds
|
6
ba
|
5,638
sqft
|
built
2005
255 Mount Vintage Plantation Dr, North Augusta, SC 29860
$-12,410
Cash flow
-21.6%
Cash-on-Cash Return
0.7%
Cap rate
0.1%
Rent to Value Ratio
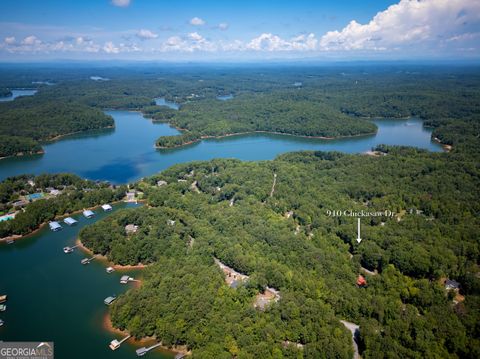
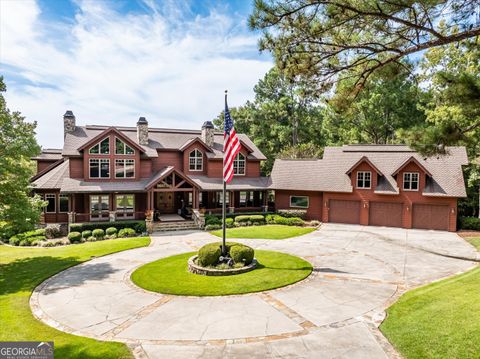
Active
$565,000
3
bds
|
3
ba
|
2,793
sqft
|
built
1990
910 Chickasaw Dr, Westminster, SC 29693
$-1,197
Cash flow
-11.1%
Cash-on-Cash Return
3.1%
Cap rate
0.5%
Rent to Value Ratio
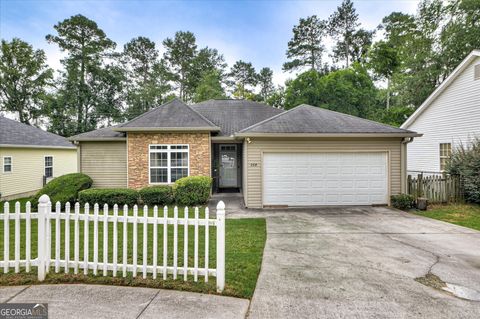
Active
$260,000
3
bds
|
2
ba
|
1,440
sqft
|
built
2004
268 Spring Oak Ln, North Augusta, SC 29841
$57
Cash flow
1.1%
Cash-on-Cash Return
5.9%
Cap rate
0.8%
Rent to Value Ratio

Active
$195,000
2
bds
|
2
ba
|
1,150
sqft
|
built
1985
707 Northlake Dr, Anderson, SC 29625
$24
Cash flow
0.6%
Cash-on-Cash Return
5.8%
Cap rate
0.8%
Rent to Value Ratio
Active
$899,000
3
bds
|
3.5
ba
|
3,296
sqft
|
built
1987
108 Tulip Ln, Westminster, SC 29693
$-2,481
Cash flow
-14.4%
Cash-on-Cash Return
2.4%
Cap rate
0.3%
Rent to Value Ratio

Active
$899,900
3
bds
|
2
ba
|
2,300
sqft
|
built
1980
4605 Pine Ln, Anderson, SC 29621
$-2,467
Cash flow
-14.3%
Cash-on-Cash Return
2.4%
Cap rate
0.3%
Rent to Value Ratio

Active
$799,000
3
bds
|
2
ba
|
1,978
sqft
|
built
1910
692 King St, Charleston, SC 29403
$-1,980
Cash flow
-12.9%
Cash-on-Cash Return
2.7%
Cap rate
0.4%
Rent to Value Ratio

Active
$798,000
5
bds
|
2
ba
|
4,000
sqft
|
built
1860
140 S Mechanic St, Pendleton, SC 29670
$-2,671
Cash flow
-17.5%
Cash-on-Cash Return
1.7%
Cap rate
0.3%
Rent to Value Ratio
Active
$1,299,000
4
bds
|
4
ba
|
3,073
sqft
|
built
2007
395 New Cut Rd, Edgefield, SC 29824
$-4,662
Cash flow
-18.7%
Cash-on-Cash Return
1.4%
Cap rate
0.2%
Rent to Value Ratio
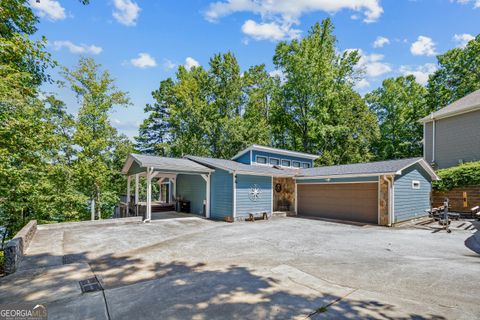
Active
$565,000
4
bds
|
3
ba
|
2,500
sqft
|
built
2000
621 Chickasaw Dr, Westminster, SC 29693
$-930
Cash flow
-8.6%
Cash-on-Cash Return
3.7%
Cap rate
0.5%
Rent to Value Ratio

Active
$1,125,000
6
bds
|
0
ba
|
4,468
sqft
|
built
2007
590 River Forks Rd, Anderson, SC 29626
$-2,604
Cash flow
-12.1%
Cash-on-Cash Return
2.9%
Cap rate
0.4%
Rent to Value Ratio

Active
$824,900
3
bds
|
0
ba
|
2,278
sqft
|
built
1955
215 Barnard Ave SE, Aiken, SC 29801
$-2,386
Cash flow
-15.1%
Cash-on-Cash Return
2.2%
Cap rate
0.3%
Rent to Value Ratio

Active
$295,000
4
bds
|
4
ba
|
1,721
sqft
|
built
2008
1523 Gadwall Way, Seneca, SC 29678
$-228
Cash flow
-4.0%
Cash-on-Cash Return
4.8%
Cap rate
0.7%
Rent to Value Ratio
Active
$1,375,000
4
bds
|
0
ba
|
4,186
sqft
|
built
2010
582 Rock Creek Bay Dr, Fair Play, SC 29643
$-4,225
Cash flow
-16.0%
Cash-on-Cash Return
2.0%
Cap rate
0.3%
Rent to Value Ratio

Active
$265,000
3
bds
|
2
ba
|
1,800
sqft
|
built
1988
251 Cherokee Dr, Fair Play, SC 29643
$37
Cash flow
0.7%
Cash-on-Cash Return
5.8%
Cap rate
0.8%
Rent to Value Ratio
Active
$650,000
4
bds
|
3
ba
|
1,961
sqft
|
built
1989
305 Edgewater Dr, Anderson, SC 29626
$-1,810
Cash flow
-14.5%
Cash-on-Cash Return
2.3%
Cap rate
0.4%
Rent to Value Ratio
Active
$320,500
3
bds
|
2
ba
|
1,579
sqft
|
built
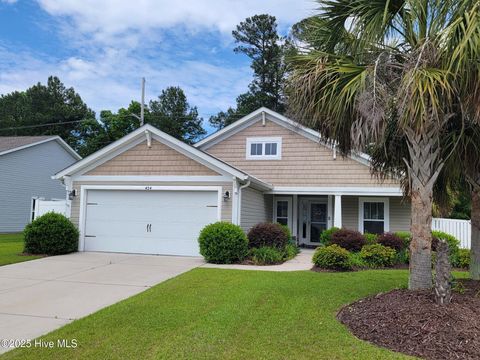
2010
424 Enderby Way, Little River, SC 29566
$-78
Cash flow
-1.3%
Cash-on-Cash Return
5.4%
Cap rate
0.7%
Rent to Value Ratio

Active
$250,000
2
bds
|
2
ba
|
1,035
sqft
|
built
2000
3979 Forsythia Ct, Myrtle Beach, SC 29588
$-315
Cash flow
-6.6%
Cash-on-Cash Return
4.2%
Cap rate
0.7%
Rent to Value Ratio

Active
$799,000
3
bds
|
2
ba
|
1,995
sqft
|
built
1964
215 Cedar St, Anderson, SC 29626
$-2,344
Cash flow
-15.3%
Cash-on-Cash Return
2.2%
Cap rate
0.3%
Rent to Value Ratio

Active
$375,000
5
bds
|
0
ba
|
2,000
sqft
|
built
2019
348 N Port Bass Dr, Fair Play, SC 29643
$-384
Cash flow
-5.3%
Cash-on-Cash Return
4.5%
Cap rate
0.6%
Rent to Value Ratio

Active
$509,000
3
bds
|
3
ba
|
2,402
sqft
|
built
1989
3026 Cedar Creek Run, Little River, SC 29566
$-768
Cash flow
-7.9%
Cash-on-Cash Return
3.9%
Cap rate
0.5%
Rent to Value Ratio

Active
$700,000
4
bds
|
3
ba
|
3,020
sqft
|
built
1980
1130 Cartee Rd, Anderson, SC 29625
$-763
Cash flow
-5.7%
Cash-on-Cash Return
4.4%
Cap rate
0.6%
Rent to Value Ratio

Active
$459,900
3
bds
|
2
ba
|
2,522
sqft
|
built
2016
676 Lafayette Park Dr, Little River, SC 29566
$-537
Cash flow
-6.1%
Cash-on-Cash Return
4.3%
Cap rate
0.6%
Rent to Value Ratio
Active
$444,000
5
bds
|
2
ba
|
2,678
sqft
|
built
1940
420 Columbia Rd, Edgefield, SC 29824
$-169
Cash flow
-2.0%
Cash-on-Cash Return
5.2%
Cap rate
0.6%
Rent to Value Ratio
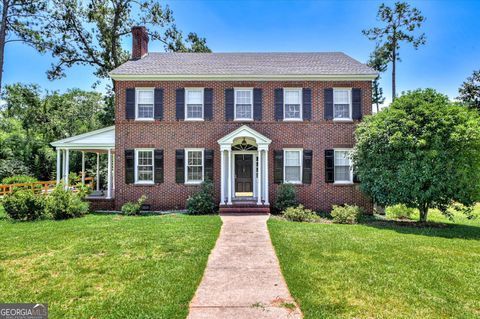
Active
$389,900
4
bds
|
2
ba
|
3,368
sqft
|
built
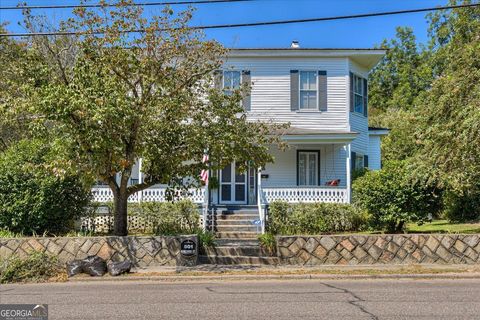
1900
501 Buncombe St, Edgefield, SC 29824
$-120
Cash flow
-1.6%
Cash-on-Cash Return
5.3%
Cap rate
0.6%
Rent to Value Ratio