Illinois Investment Properties for Sale
Browse homes for sale and investment properties in Illinois. Refine your search by price, property type, or more.
Best cash flowing properties in Illinois
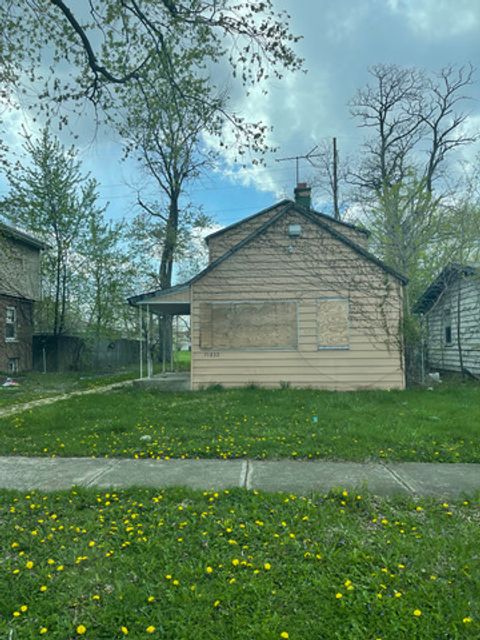
Active
$55,000
3
bds
|
1
ba
|
990
sqft
|
built
1925
15032 Winchester Ave, Harvey, IL 60426
$868
Cash flow
18.4%
Cash-on-Cash Return
18.9%
Cap rate
2.7%
Rent to Value Ratio
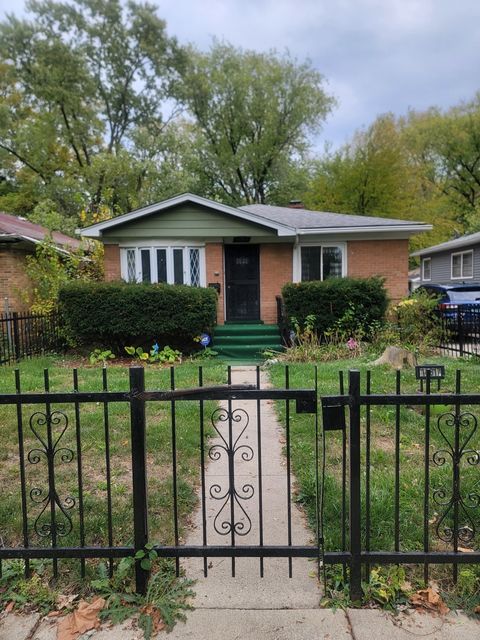
Active
$110,000
3
bds
|
1
ba
|
946
sqft
|
built
1960
14817 Lexington Ave, Harvey, IL 60426
$719
Cash flow
34.1%
Cash-on-Cash Return
13.5%
Cap rate
1.6%
Rent to Value Ratio
7,261 out of 11,246 properties for sale in Illinois
Limited Results Shown
Create a free account, or log in to reveal all property listings and enjoy the complete experience.

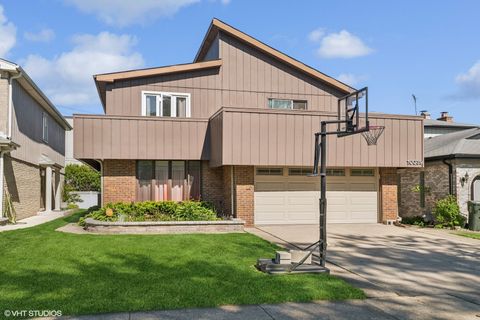
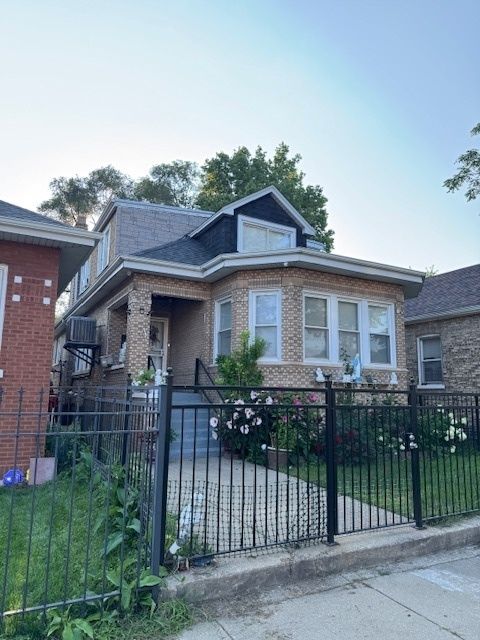
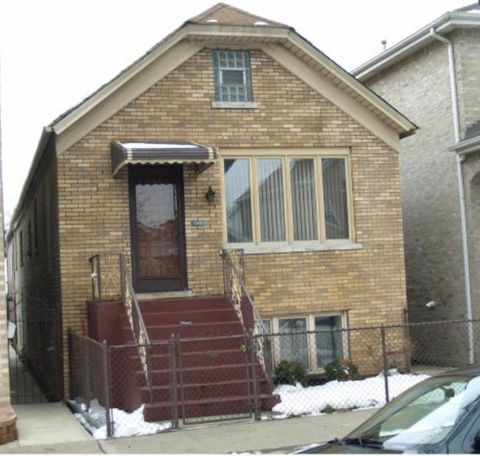
Active
$142,500
5
bds
|
3
ba
|
1,500
sqft
|
built
1927
11949 S Lafayette Ave, Chicago, IL 60628
$653
Cash flow
23.9%
Cash-on-Cash Return
11.2%
Cap rate
1.4%
Rent to Value Ratio

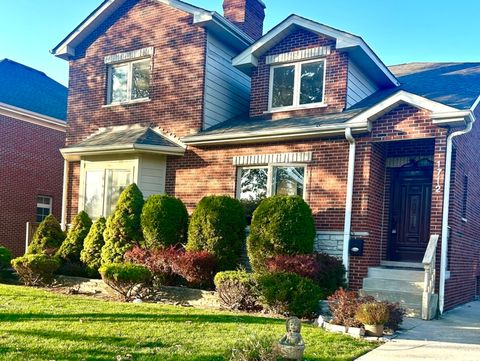
Active
$189,000
3
bds
|
3
ba
|
1,323
sqft
|
built
1983
281 Hoxie Ave, Calumet City, IL 60409
$693
Cash flow
19.1%
Cash-on-Cash Return
10.1%
Cap rate
1.2%
Rent to Value Ratio
Active
$725,000
4
bds
|
3
ba
|
3,096
sqft
|
built
1976
10039 La Crosse Ave, Skokie, IL 60077
$-1,643
Cash flow
-11.8%
Cash-on-Cash Return
3.0%
Cap rate
0.6%
Rent to Value Ratio
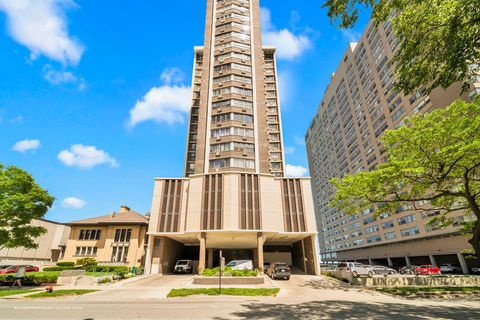
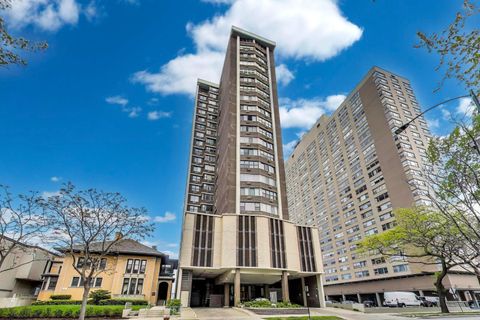
Active
$215,000
2
bds
|
2
ba
|
1,200
sqft
|
built
1970
6325 N Sheridan Rd, Chicago, IL 60660
$-551
Cash flow
-13.4%
Cash-on-Cash Return
2.6%
Cap rate
1.2%
Rent to Value Ratio
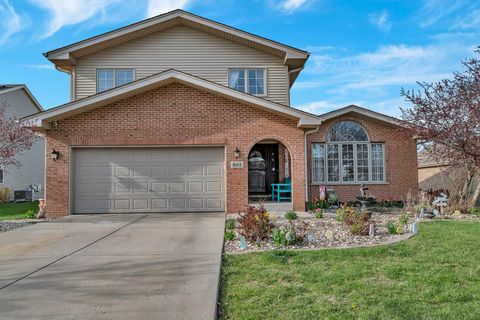
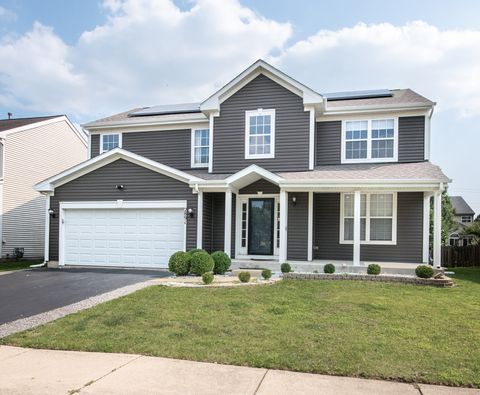
Active
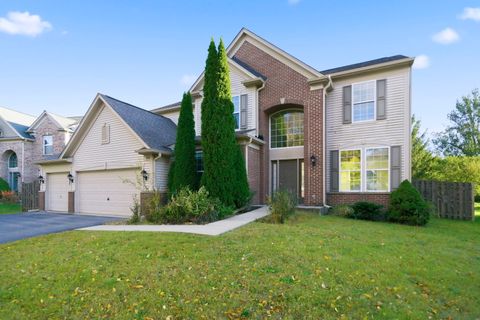
$389,900
4
bds
|
4
ba
|
2,460
sqft
|
built
2005
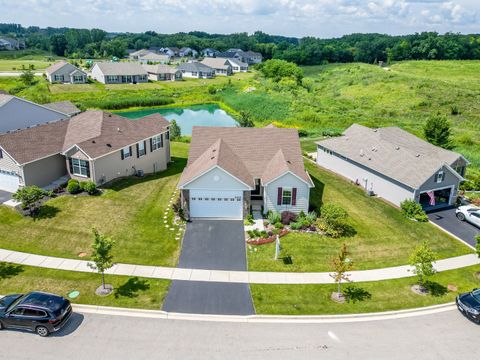
605 High Grove Dr, Minooka, IL 60447
$-488
Cash flow
-6.5%
Cash-on-Cash Return
4.2%
Cap rate
0.8%
Rent to Value Ratio
Active
$305,000
5
bds
|
4
ba
|
1,848
sqft
|
built
1930
6922 S Campbell Ave, Chicago, IL 60629
$-80
Cash flow
-1.4%
Cash-on-Cash Return
5.4%
Cap rate
0.8%
Rent to Value Ratio
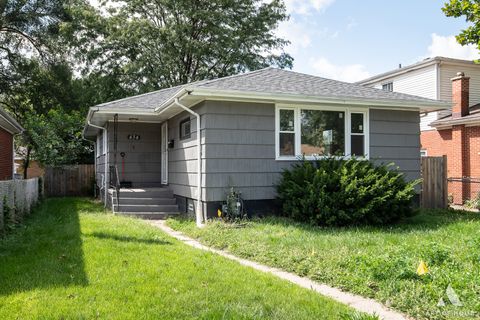
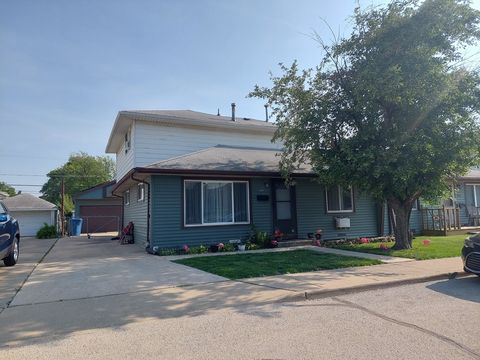
Active
$184,000
3
bds
|
2
ba
|
1,200
sqft
|
built
1961
434 Mackinaw Ave, Calumet City, IL 60409
$38
Cash flow
1.1%
Cash-on-Cash Return
5.9%
Cap rate
1.0%
Rent to Value Ratio

Active
$340,000
4
bds
|
4
ba
|
0
sqft
|
built
1912
7601 S Morgan St, Chicago, IL 60620
$-581
Cash flow
-8.9%
Cash-on-Cash Return
3.6%
Cap rate
0.6%
Rent to Value Ratio

Active
$325,000
4
bds
|
3
ba
|
2,700
sqft
|
built
1913
7339 S Evans Ave, Chicago, IL 60619
$122
Cash flow
2.0%
Cash-on-Cash Return
6.1%
Cap rate
0.8%
Rent to Value Ratio
Active
$169,500
1
bds
|
1
ba
|
814
sqft
|
built
1974
6325 N Sheridan Rd, Chicago, IL 60660
$-361
Cash flow
-11.1%
Cash-on-Cash Return
3.1%
Cap rate
1.1%
Rent to Value Ratio
Active
$529,600
4
bds
|
3
ba
|
2,894
sqft
|
built
2005
402 Marshall Ash St, Bolingbrook, IL 60490
$-1,743
Cash flow
-17.2%
Cash-on-Cash Return
1.7%
Cap rate
0.6%
Rent to Value Ratio
Active
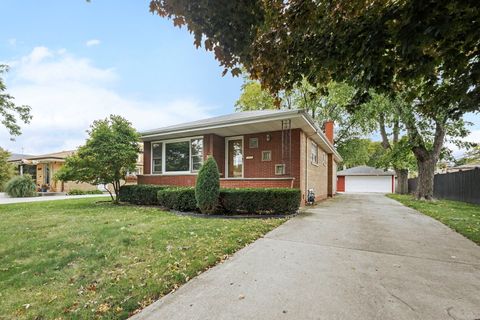
$274,900
4
bds
|
2
ba
|
1,246
sqft
|
built
1952
4421 W 87th St, Hometown, IL 60456
$-95
Cash flow
-1.8%
Cash-on-Cash Return
5.3%
Cap rate
0.8%
Rent to Value Ratio
Active
$445,000
3
bds
|
4
ba
|
4,000
sqft
|
built
1890
3727 S Lowe Ave, Chicago, IL 60609
$-203
Cash flow
-2.4%
Cash-on-Cash Return
5.1%
Cap rate
0.8%
Rent to Value Ratio
Active
$838,000
5
bds
|
4
ba
|
2,634
sqft
|
built
2006
1712 Woodland Ave, Park Ridge, IL 60068
$-2,018
Cash flow
-12.6%
Cash-on-Cash Return
2.8%
Cap rate
0.5%
Rent to Value Ratio
Active
$465,000
3
bds
|
3
ba
|
0
sqft
|
built
2022
2032 Wentworth Dr, Volo, IL 60020
$-952
Cash flow
-10.7%
Cash-on-Cash Return
3.2%
Cap rate
0.7%
Rent to Value Ratio

Active
$450,000
3
bds
|
2
ba
|
1,582
sqft
|
built
1946
7805 W Farragut Ave, Chicago, IL 60656
$-568
Cash flow
-6.6%
Cash-on-Cash Return
4.2%
Cap rate
0.6%
Rent to Value Ratio
Active
$399,900
3
bds
|
2
ba
|
1,389
sqft
|
built
1961
10624 Lawler Ave, Oak Lawn, IL 60453
$-737
Cash flow
-9.6%
Cash-on-Cash Return
3.5%
Cap rate
0.7%
Rent to Value Ratio
Active
$425,000
4
bds
|
3
ba
|
2,400
sqft
|
built
2004
2891 Frances Ln, Montgomery, IL 60538
$-647
Cash flow
-7.9%
Cash-on-Cash Return
3.9%
Cap rate
0.8%
Rent to Value Ratio
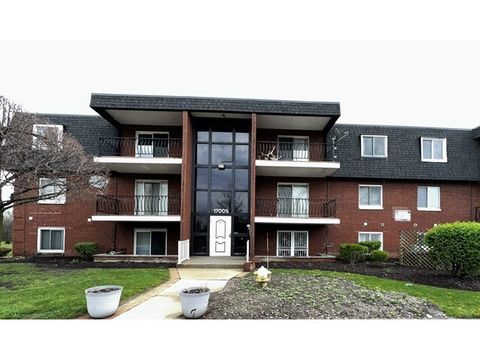
Active
$50,000
1
bds
|
1
ba
|
0
sqft
|
built
1978
17005 Albany Ave, Hazel Crest, IL 60429
$664
Cash flow
15.5%
Cash-on-Cash Return
15.9%
Cap rate
3.2%
Rent to Value Ratio
Active
$1,390,000
4
bds
|
5
ba
|
5,000
sqft
|
built
2002
11735 Orchard Rd, Willow Springs, IL 60480
$-4,895
Cash flow
-18.4%
Cash-on-Cash Return
1.5%
Cap rate
0.4%
Rent to Value Ratio
Active
$565,000
3
bds
|
3
ba
|
2,246
sqft
|
built
1988
412 Chateau Dr, Buffalo Grove, IL 60089
$-1,396
Cash flow
-12.9%
Cash-on-Cash Return
2.7%
Cap rate
0.6%
Rent to Value Ratio
Active
$325,000
5
bds
|
2
ba
|
2,020
sqft
|
built
1952
2300 Greengold St, Crest Hill, IL 60403
$-583
Cash flow
-9.4%
Cash-on-Cash Return
3.5%
Cap rate
0.7%
Rent to Value Ratio
Active
$565,000
3
bds
|
2
ba
|
1,600
sqft
|
built
2005
2130 W Division St, Chicago, IL 60622
$-1,275
Cash flow
-11.8%
Cash-on-Cash Return
3.0%
Cap rate
0.6%
Rent to Value Ratio

Active
$296,500
3
bds
|
2
ba
|
1,900
sqft
|
built
1979
181 W 28th St, South Chicago Heights, IL 60411
$-362
Cash flow
-6.4%
Cash-on-Cash Return
4.2%
Cap rate
0.7%
Rent to Value Ratio
Active
$525,000
3
bds
|
3
ba
|
3,176
sqft
|
built
1975
323 W Golf Rd, Libertyville, IL 60048
$-915
Cash flow
-9.1%
Cash-on-Cash Return
3.6%
Cap rate
0.7%
Rent to Value Ratio

Active
$420,000
5
bds
|
2
ba
|
0
sqft
|
built
1913
5919 S Rockwell St, Chicago, IL 60629
$-1,096
Cash flow
-13.6%
Cash-on-Cash Return
2.5%
Cap rate
0.4%
Rent to Value Ratio
Active
$345,000
3
bds
|
3
ba
|
1,900
sqft
|
built
1964
20534 Arcadian Dr, Olympia Fields, IL 60461
$-528
Cash flow
-8.0%
Cash-on-Cash Return
3.8%
Cap rate
0.8%
Rent to Value Ratio
Active
$420,000
3
bds
|
3
ba
|
2,740
sqft
|
built
1991
36077 N Bridlewood Ave, Gurnee, IL 60031
$-925
Cash flow
-11.5%
Cash-on-Cash Return
3.0%
Cap rate
0.7%
Rent to Value Ratio

Active
$379,999
4
bds
|
3
ba
|
1,552
sqft
|
built
1926
5544 S California Ave, Chicago, IL 60629
$-595
Cash flow
-8.2%
Cash-on-Cash Return
3.8%
Cap rate
0.5%
Rent to Value Ratio
Active
$449,900
3
bds
|
2
ba
|
1,575
sqft
|
built
1951
832 Sylviawood Ave, Park Ridge, IL 60068
$-428
Cash flow
-5.0%
Cash-on-Cash Return
4.5%
Cap rate
0.8%
Rent to Value Ratio

Active
$436,900
2
bds
|
2
ba
|
1,275
sqft
|
built
2004
200 W Grand Ave, Chicago, IL 60654
$-837
Cash flow
-10.0%
Cash-on-Cash Return
3.4%
Cap rate
0.9%
Rent to Value Ratio

Active
$249,900
5
bds
|
2
ba
|
2,520
sqft
|
built
1897
845 W 50th Pl, Chicago, IL 60609
$-98
Cash flow
-2.0%
Cash-on-Cash Return
5.2%
Cap rate
0.7%
Rent to Value Ratio

Active
$232,500
4
bds
|
2
ba
|
0
sqft
|
built
1965
15666 Woodlawn East Ave, South Holland, IL 60473
$40
Cash flow
0.9%
Cash-on-Cash Return
5.9%
Cap rate
1.0%
Rent to Value Ratio

Active
$2,599,000
7
bds
|
7
ba
|
8,360
sqft
|
built
1912
1120 Forest Ave, Evanston, IL 60202
$-13,027
Cash flow
-26.2%
Cash-on-Cash Return
-0.3%
Cap rate
0.2%
Rent to Value Ratio

Active
$1,300,000
3
bds
|
3
ba
|
5,849
sqft
|
built
2017
26303 W Merton Rd, Barrington, IL 60010
$-4,670
Cash flow
-18.7%
Cash-on-Cash Return
1.4%
Cap rate
0.3%
Rent to Value Ratio
Active
$548,500
5
bds
|
3
ba
|
2,486
sqft
|
built
1927
3336 Grand Blvd, Brookfield, IL 60513
$-1,176
Cash flow
-11.2%
Cash-on-Cash Return
3.1%
Cap rate
0.6%
Rent to Value Ratio

Active
$299,000
10
bds
|
6
ba
|
0
sqft
|
built
1906
4800 S Wood St, Chicago, IL 60609
$-402
Cash flow
-7.0%
Cash-on-Cash Return
4.1%
Cap rate
0.6%
Rent to Value Ratio
Active
$388,000
3
bds
|
2
ba
|
1,301
sqft
|
built
1963
414 Skokie Ct, Wilmette, IL 60091
$-4
Cash flow
-0.1%
Cash-on-Cash Return
5.7%
Cap rate
0.7%
Rent to Value Ratio