

$389,900
Investment Summary
- Monthly Cash Flow
- -$303
- Cap Rate
- 4.7%
- Cash-on-Cash Return
- -4.1%
- Debt Coverage Ratio
- 0.84
- Internal Rate of Return (5 years)
- 0.1%
Cash Flow
Net Operating Income (NOI) minus mortgage payments.
Calculation:
NOI - Mortgage Payments
Cap Rate (Market Value)
Capitalization Rate is a rate of return that compares the yearly Net Operating Income (NOI) to the market value.
Calculation:
NOI / Market Value
Cash-on-Cash Return (CoC)
Annual Cash Flow / Cash Invested
Calculation:
Annual cash flow divided by initial cash invested.
Debt Coverage Ratio (DCR)
Net Operating Income (NOI) divided by total debt payments.
Calculation:
NOI / Total Debt Payments
Internal Rate of Return (IRR)
A metric for assessing profitability over time. IRR is the discount rate at which the net present value (NPV) of all future cash flows (positive and negative) from an investment equals zero — including both periodic cash flow (such as rent) and a projected sale at the end of the holding period. It represents the expected annualized return, accounting for income, expenses, and the recovery of capital through a future sale.
Property Description
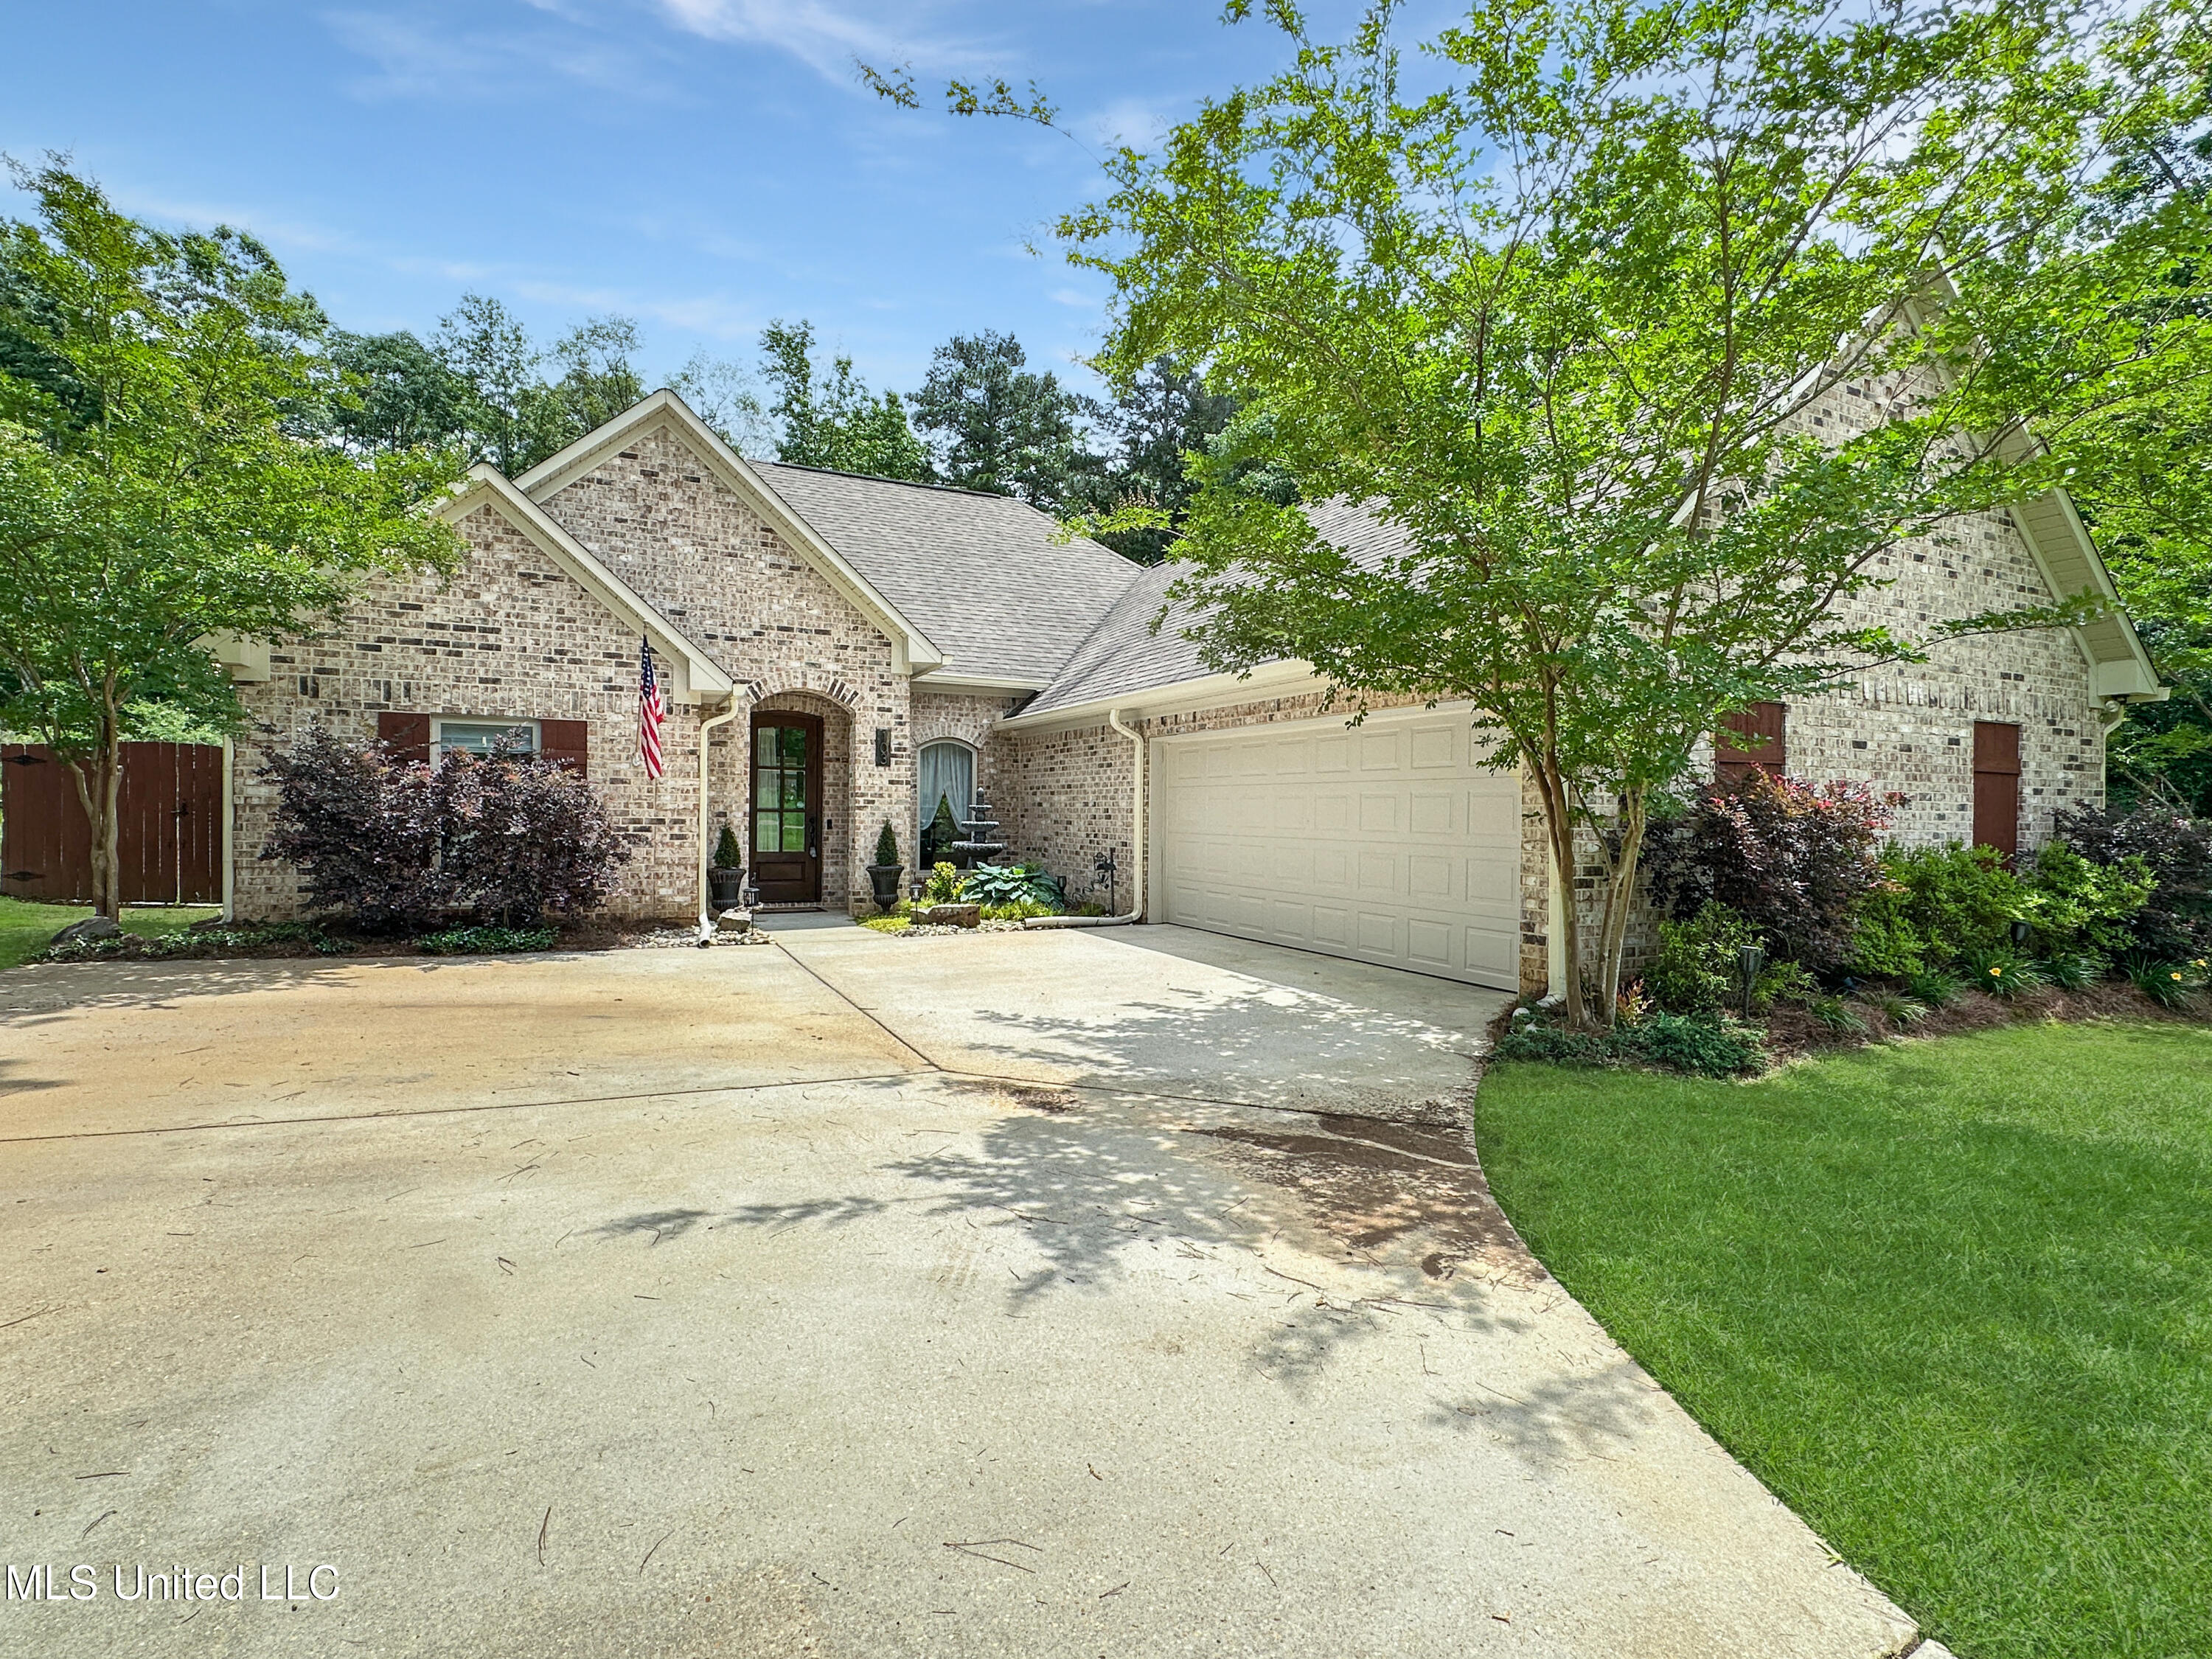
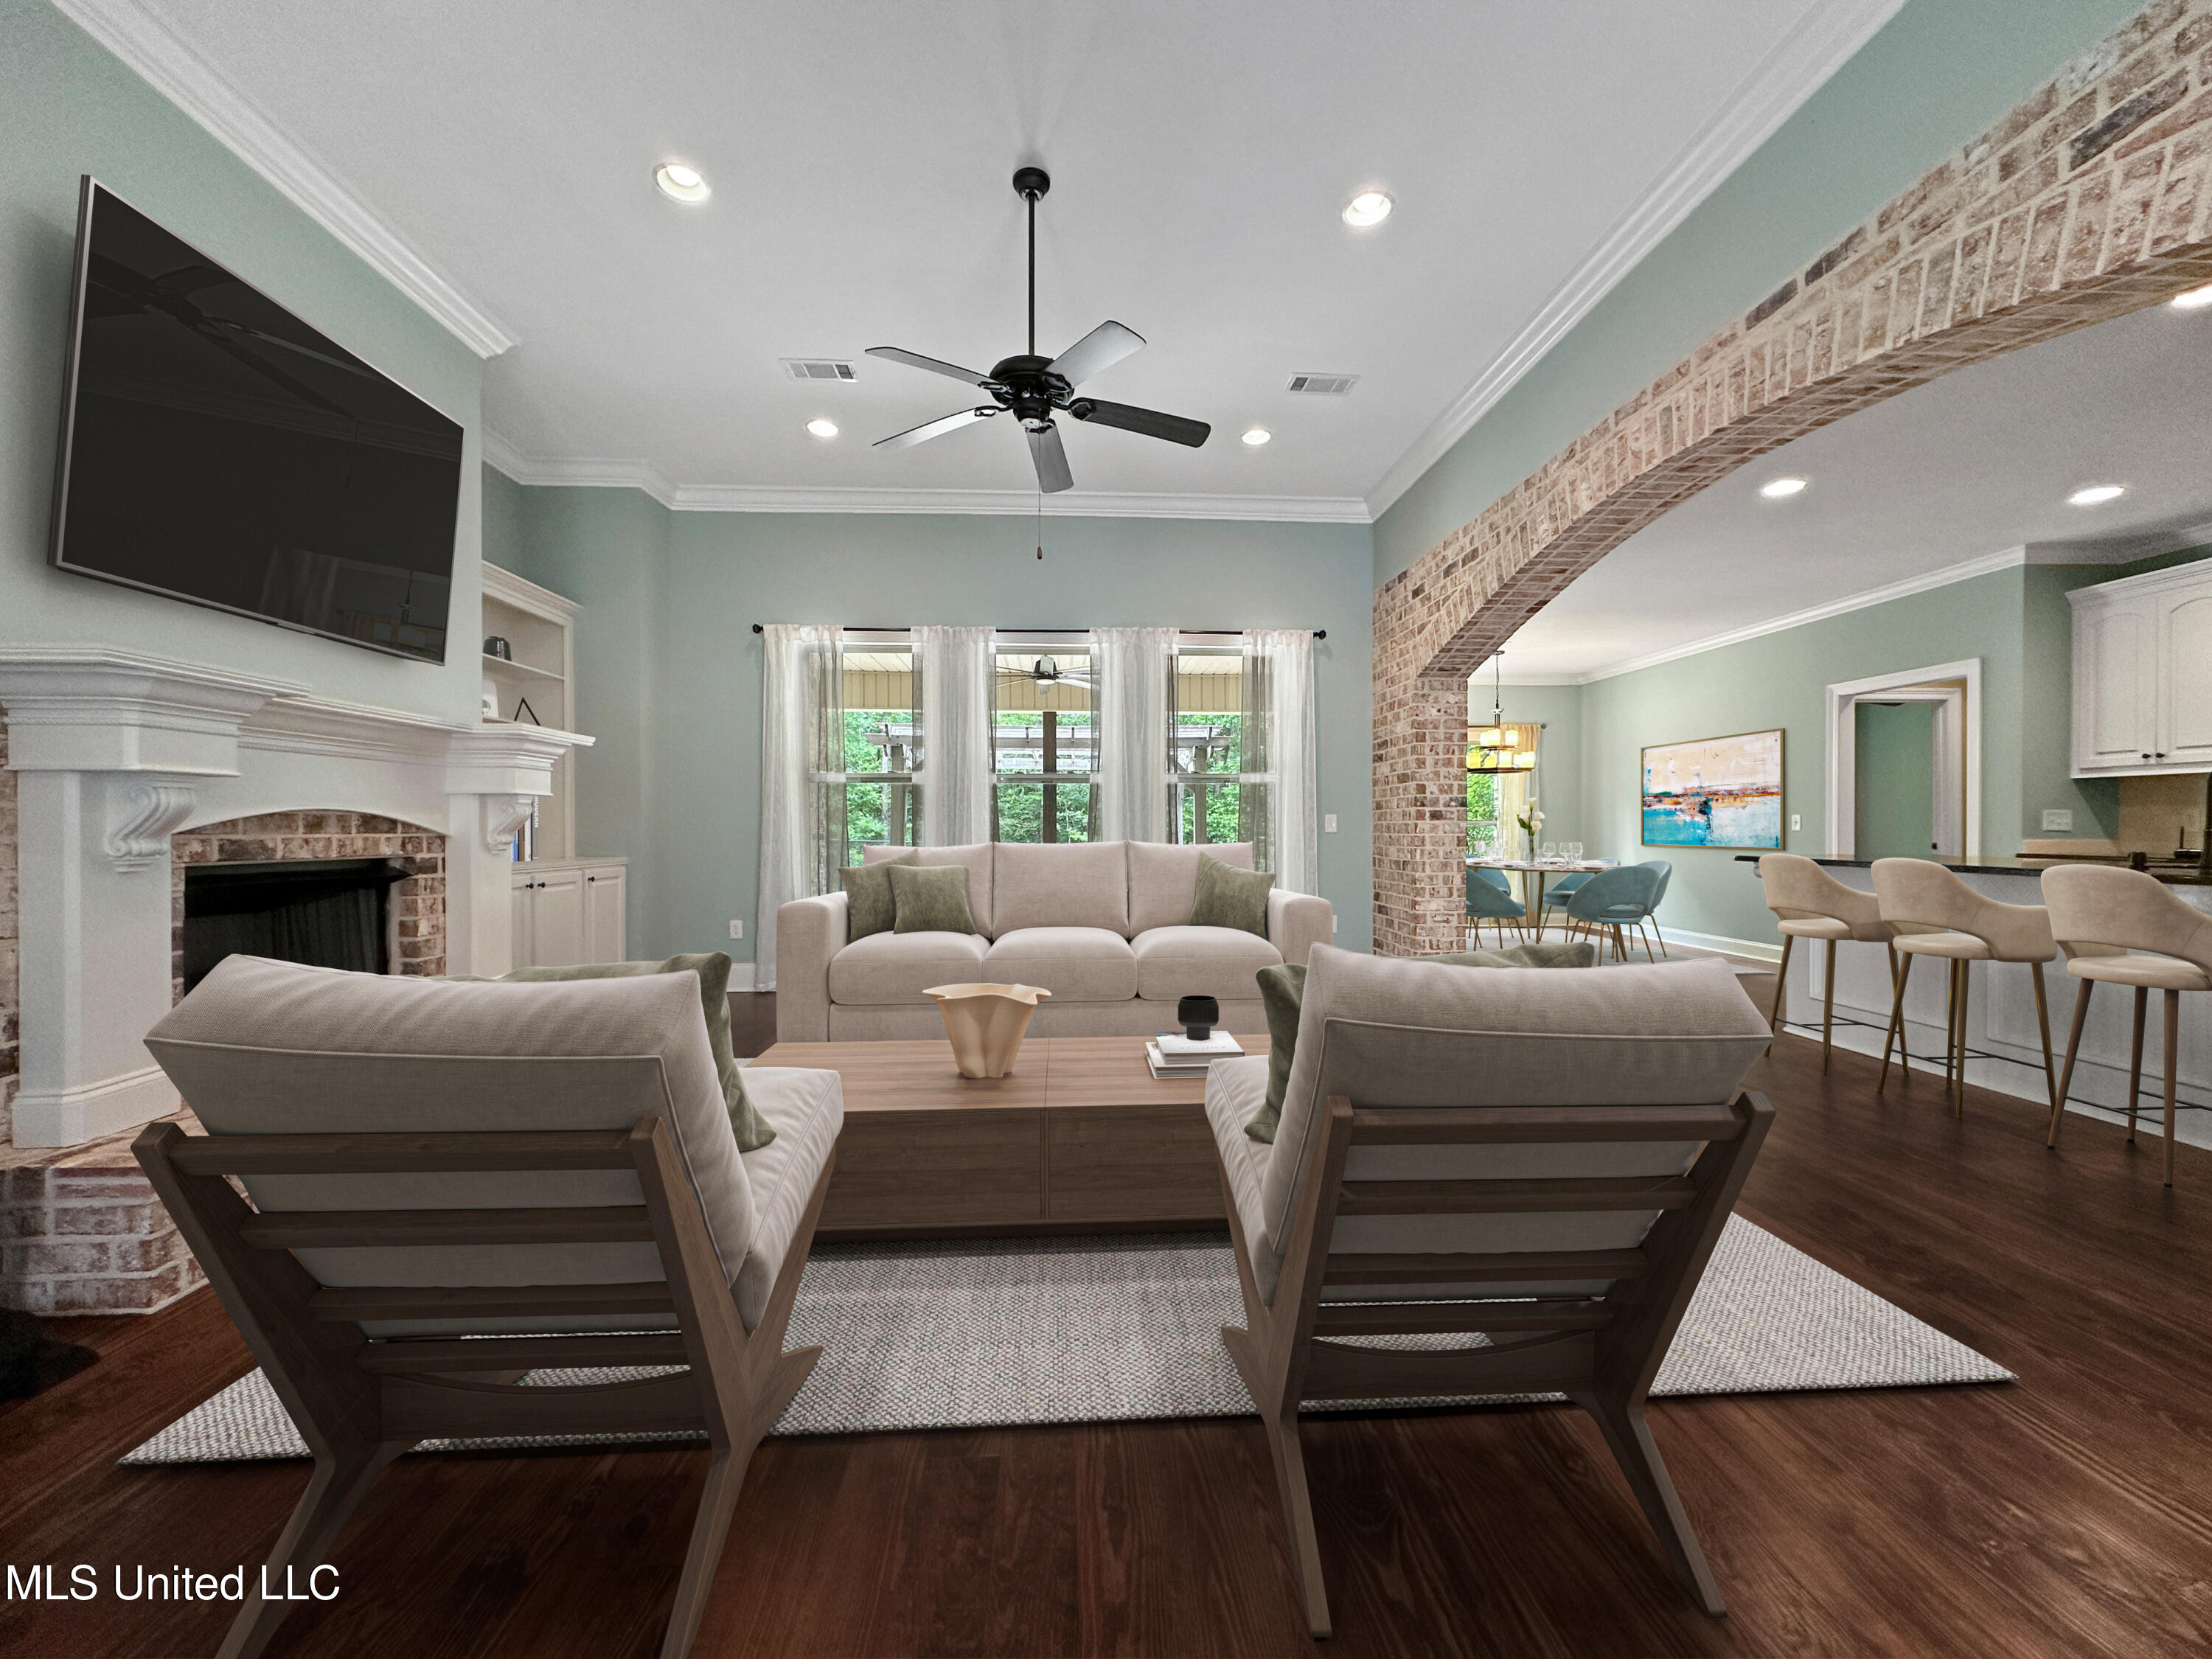
MOTIVATED SELLER! PRICE IMPROVEMENT! $25K price drop from original list price!!! BEAUTIFUL HOME and PROPERTY! Welcome to your new dream home at 103 Saint Charles Ave, Florence, MS—a beautifully appointed residence set in a charming, low-traffic subdivision within the Florence School District. This split-plan gem is designed for sophisticated living, with every detail thoughtfully curated for comfort and style. Step inside to an inviting open living area that centers around a magnificent gas log fireplace graced with an elegant mantle. A striking brick archway gracefully separates the living space from a stunning kitchen, establishing a seamless connection between cozy gatherings and culinary adventures. The chef's kitchen is a masterpiece: a built-in island bar comfortably seats 4-5 guests, complemented by ample cabinet space, under-counter lighting, a coffee bar, granite countertops, and stainless-steel appliances—with the refrigerator staying with the home for your convenience. Abundant natural light streams through large windows, highlighting the expansive dining area where there's plenty of room to host memorable dinners. Every corner of this home speaks to quality, from the hardwood floors and ceiling fans adorning the living room, bedrooms, and back porch, to the practical built-in desk in the hallway, leading to the two-car garage, a half bathroom, generous pantry, and storage cabinetry. The private main suite offers a tranquil retreat with an ensuite bath that truly impresses. A unique feature of this home is the walk-through closet—complete with built-in dresser and shoe rack furniture—that not only connects seamlessly to the laundry room but also adds a touch of bespoke elegance. The laundry room is thoughtfully designed with a utility sink and ample custom cabinetry. The ensuite bath brings luxury and convenience together with dual sinks, a sumptuous, jetted tub, a separate shower, and a dedicated water closet. Step outside onto the back porch—a versatile space ideal for unwinding after a long day or entertaining guests. The meticulously landscaped lawn, featuring two charming fountains, provides a picturesque setting. The fenced backyard, secured with a black chain link fence and three gates, offer additional security and space for your pet to roam, while the wooded area at the back of the lot ensures a serene, secluded ambiance away from the bustle. There is even a shed in the back with double doors for additional storage. Additional thoughtful features include a Ring doorbell camera, retained window treatments, and TV mounts in the master bedroom, guest bedroom, and back porch, making moving in as seamless as possible. With aluminum gutters and downspouts effortlessly managing the elements, this home is built to offer both beauty and practicality. Experience the perfect blend of modern amenities and inviting charm at 103 St Charles Ave—a sanctuary where every detail invites you to stay and savor life's moments.
Build Your Team
Quickly find investor-friendly professionals who can help you succeed in real estate investing at any stage of the investing journey.


Agents
Match with investor-friendly agents who can help you find, analyze, and close your next deal


Lenders
Get the best funding…find investor-friendly lenders who specialize in your deal strategy


Property Managers
Transition to passive investing. Find a trusted property management partnership that lasts.


Tax Pros & Accountants
Taxes and financial reporting made easy—find experts to create tax savings strategies, file taxes, and more
Location
Property Details
Parking
- Description: Garage Door Opener
- Details: Attached, Garage Door Opener, Garage Faces Side
- Garage Spaces: 2
- Spaces Total: 2
Bedroom Information
- # of Bedrooms: 3
Bathroom Information
- # of Baths (Full): 2
- # of Baths (Partial): 1
- # of Baths (Total): 3.0
Interior Features
- # of Rooms: 6
- # of Stories: 1
- Fireplace: Yes
Exterior Features
- Exterior Walls Materials: Brick Veneer
- Foundation: Slab
- Roof Type: Hip
- Roof Material: Shingle
Land Information
- Land Use: Residential
- Land Use Subtype: Single Family Residential
Lot Information
- Parcel ID: C0400014500190
- Lot Size: 66211 sqft
Property Information
- Property Type: Single Family Residence
- Style: Traditional
- Year Built: 2017
Tax Information
- Annual Tax: $2,191
Utilities
- Heating: Central, Propane
- Cooling: Ceiling Fan(s), Central Air
Location
- County: Rankin
Listing Details
Investment Summary
- Monthly Cash Flow
- -$303
- Cap Rate
- 4.7%
- Cash-on-Cash Return
- -4.1%
- Debt Coverage Ratio
- 0.84
- Internal Rate of Return (5 years)
- 0.1%
Cash Flow
Net Operating Income (NOI) minus mortgage payments.
Calculation:
NOI - Mortgage Payments
Cap Rate (Market Value)
Capitalization Rate is a rate of return that compares the yearly Net Operating Income (NOI) to the market value.
Calculation:
NOI / Market Value
Cash-on-Cash Return (CoC)
Annual Cash Flow / Cash Invested
Calculation:
Annual cash flow divided by initial cash invested.
Debt Coverage Ratio (DCR)
Net Operating Income (NOI) divided by total debt payments.
Calculation:
NOI / Total Debt Payments
Internal Rate of Return (IRR)
A metric for assessing profitability over time. IRR is the discount rate at which the net present value (NPV) of all future cash flows (positive and negative) from an investment equals zero — including both periodic cash flow (such as rent) and a projected sale at the end of the holding period. It represents the expected annualized return, accounting for income, expenses, and the recovery of capital through a future sale.
Purchase Details
Purchase PriceThe price paid for the property. Purchase price:
| $389,900 |
|---|---|
Amount FinancedThe amount of the purchase financed through a loan. Amount financed:
| -$311,920 |
Down paymentThe initial payment made towards the purchase. Down payment:
| $77,980 |
Closing CostsFees and expenses associated with purchasing a property, typically ranging from 2% to 5% of the home’s purchase price, paid at the end of a home purchase to cover services like lending, title transfer, and taxes. Closing costs:
| $11,697 |
Rehab CostsCosts incurred to repair or improve the property, including: roof, flooring, exterior siding, kitchen, exterior paint, bathrooms, etc. Rehab costs:
| $0 |
Initial Cash InvestedThe total initial cash invested in the property. Calculation:Down payment + Buying costs + Rehab costs Initial cash invested:
| $89,677 |
Square Feet (SQFT)The total square footage of the property. Square feet:
| 0 |
Cost Per Square FootCost per square foot of the property. Calculation:Purchase Price / Square Feet Cost per square foot:
| n/a |
Monthly Rent Per Square FootMonthly rent divided by the number of square feet. This ratio helps investors compare rental income efficiency across properties, markets, and unit sizes Calculation:Monthly Rent / Square Feet Monthly rent per square foot:
| n/a |
Financing Details
Loan AmountThe total sum of money borrowed from a lender to finance a property purchase. Calculation:Purchase Price - Down Payment
Loan amount:
| $311,920 |
|---|---|
Loan to Value Ratio (LTV)Loan amount divided by the market value of the property. Calculation:Loan Amount / Market Value
Loan to value ratio:
| 80.0% |
Loan TypeThe type of loan (e.g., fixed, adjustable).
Loan type:
| Amortizing |
TermThe loan repayment period in years.
Term:
| 30 years |
Interest RateThe percentage a lender charges on the borrowed amount of a loan, determining the cost of borrowing money.
Interest rate:
| 5.875% |
Principal & Interest (PI)The principal is the portion of the loan payment that reduces the loan balance. The interest is the lender's charge for borrowing money. Calculation:(P * r * (1 + r) ** n) / ((1 + r) ** n - 1) Where:
P = Loan amount (principal)
Principal & interest:
| $1,845 |
Property TaxesAnnual taxes levied by local governments on real estate properties. These taxes fund public services like schools, roads, and emergency services.
Property tax:
| $183 |
InsuranceThe costs for insurance coverage to protect against financial losses due to risks like fire, natural disasters, theft, liability, or tenant-related damages. Calculation:Assumes 7% of gross rental income, unless insurance rates are specified.
Insurance:
| $175 |
Private Mortgage Insurance (PMI)A fee that borrowers pay when they take out a conventional loan with a loan-to-value (LTV) ratio above 80%.
Private mortgage insurance (PMI):
| $0 |
Monthly PaymentThe fixed amount a borrower pays each month to repay a loan. It typically includes principal and interest (P&I) and may also cover property taxes, insurance, HOA fees, and PMI if escrowed. Monthly payment:
| $2,203 |
Operating Income
| % Rent | Monthly | Yearly | |
|---|---|---|---|
Gross RentThe total rental income received from tenants before deducting any expenses. Includes base rent, late fees, pet fees, parking fees, and other recurring charges.
Gross rent:
| $2,500 | $30,000 | |
Vacancy LossExpected loss of rent due to vacancies.
Vacancy loss:
(6%)
| 6% | -$150 | -$1,800 |
Operating IncomeGross rental income minus vacancy loss. Calculation:Gross rent - Vacancy loss
Operating income:
| $2,350 | $28,200 |
Operating Expenses
| % Rent | Monthly | Yearly | |
|---|---|---|---|
Property TaxesAnnual taxes levied by local governments on real estate properties. These taxes fund public services like schools, roads, and emergency services. | 7% | -$183 | -$2,191 |
InsuranceThe costs for insurance coverage to protect against financial losses due to risks like fire, natural disasters, theft, liability, or tenant-related damages. Calculation:Assumes 7% of gross rental income, unless insurance rates are specified. | 7% | -$175 | -$2,100 |
Property ManagementThe costs associated with hiring a property manager to handle the day-to-day operations of a rental property. Includes management fees, leasing fes, eviction fees, etc. Calculation:Assumes 8% of gross rental income. | 8% | -$200 | -$2,400 |
Repairs & MaintenanceOngoing costs for routine upkeep and minor fixes needed to keep a property in good working condition. Calculation:Assumes 5% of gross rental income. Varies by property age and condition. | 5% | -$125 | -$1,500 |
Capital ExpensesLarge, infrequent costs for major improvements or replacements, like a new roof, HVAC system, or appliances. Calculation:Assumes 5% of gross rental income. Varies by property age. | 5% | -$125 | -$1,500 |
HOA FeesRegular dues paid to a Homeowners Association for community maintenance, amenities, and management. Similar fees include: Condo Association Fees, Co-op Maintenance Fees, etc. | n/a | n/a | n/a |
Operating ExpensesRecurring costs required to maintain and manage a rental property, including property taxes, insurance, maintenance, repairs, utilities (if paid by the owner), property management fees, and other day-to-day expenses. Calculation:Insurance + Property Taxes + Property Management + Repairs & Maintenance + Capital Expenditures + HOA Fees | 32% | -$808 | -$9,691 |
Cash Flow
| Monthly | Yearly | |
|---|---|---|
Net Operating Income (NOI)The income generated from a property after deducting all operating expenses but before deducting mortgage payments, taxes, and capital expenditures. Calculation:Gross Operating Income - Operating Expenses
Net operating income:
| $1,542 | $18,504 |
Mortgage PaymentThe fixed amount a borrower pays each month to repay a loan. It typically includes principal and interest (P&I) and may also cover property taxes, insurance, HOA fees, and PMI if escrowed. | -$1,845 | -$22,140 |
Cash FlowNet Operating Income (NOI) minus mortgage payments. Calculation:NOI - Mortgage Payments | -$303 | -$3,636 |