
$999,000
Investment Summary
- Monthly Cash Flow
- -$4,117
- Cap Rate
- 1.1%
- Cash-on-Cash Return
- -21.5%
- Debt Coverage Ratio
- 0.18
- Internal Rate of Return (5 years)
- -16.8%
Cash Flow
Net Operating Income (NOI) minus mortgage payments.
Calculation:
NOI - Mortgage Payments
Cap Rate (Market Value)
Capitalization Rate is a rate of return that compares the yearly Net Operating Income (NOI) to the market value.
Calculation:
NOI / Market Value
Cash-on-Cash Return (CoC)
Annual Cash Flow / Cash Invested
Calculation:
Annual cash flow divided by initial cash invested.
Debt Coverage Ratio (DCR)
Net Operating Income (NOI) divided by total debt payments.
Calculation:
NOI / Total Debt Payments
Internal Rate of Return (IRR)
A metric for assessing profitability over time. IRR is the discount rate at which the net present value (NPV) of all future cash flows (positive and negative) from an investment equals zero — including both periodic cash flow (such as rent) and a projected sale at the end of the holding period. It represents the expected annualized return, accounting for income, expenses, and the recovery of capital through a future sale.
Property Description
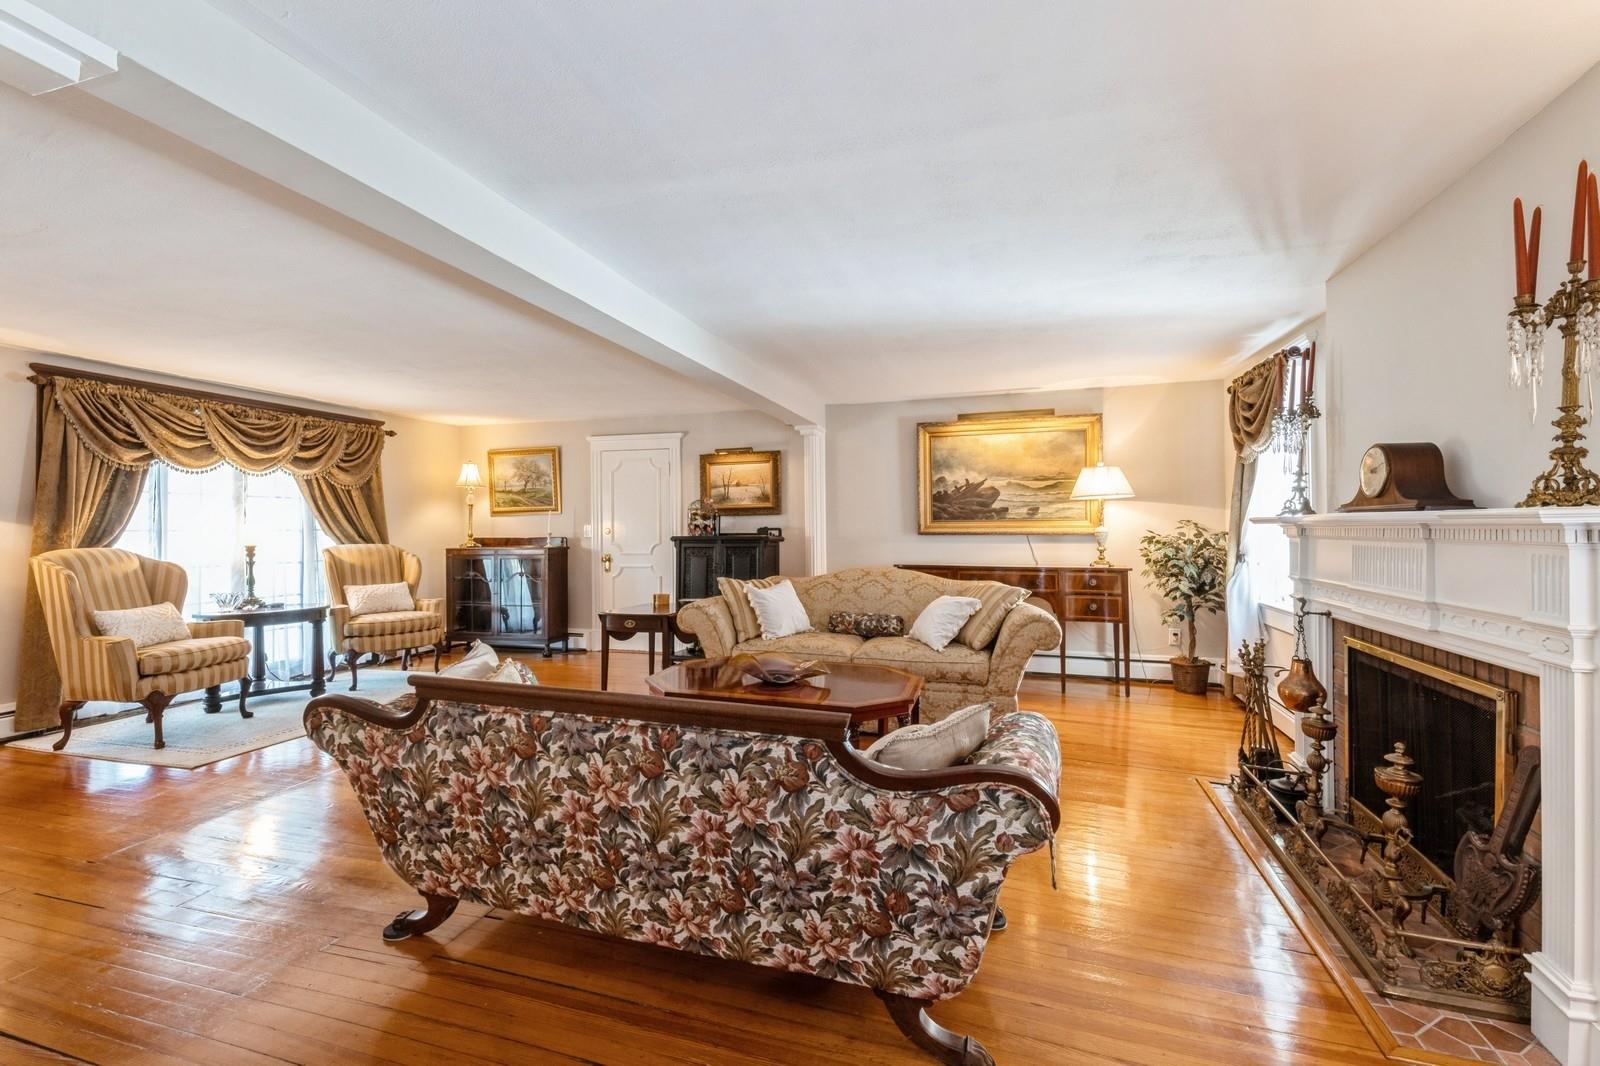
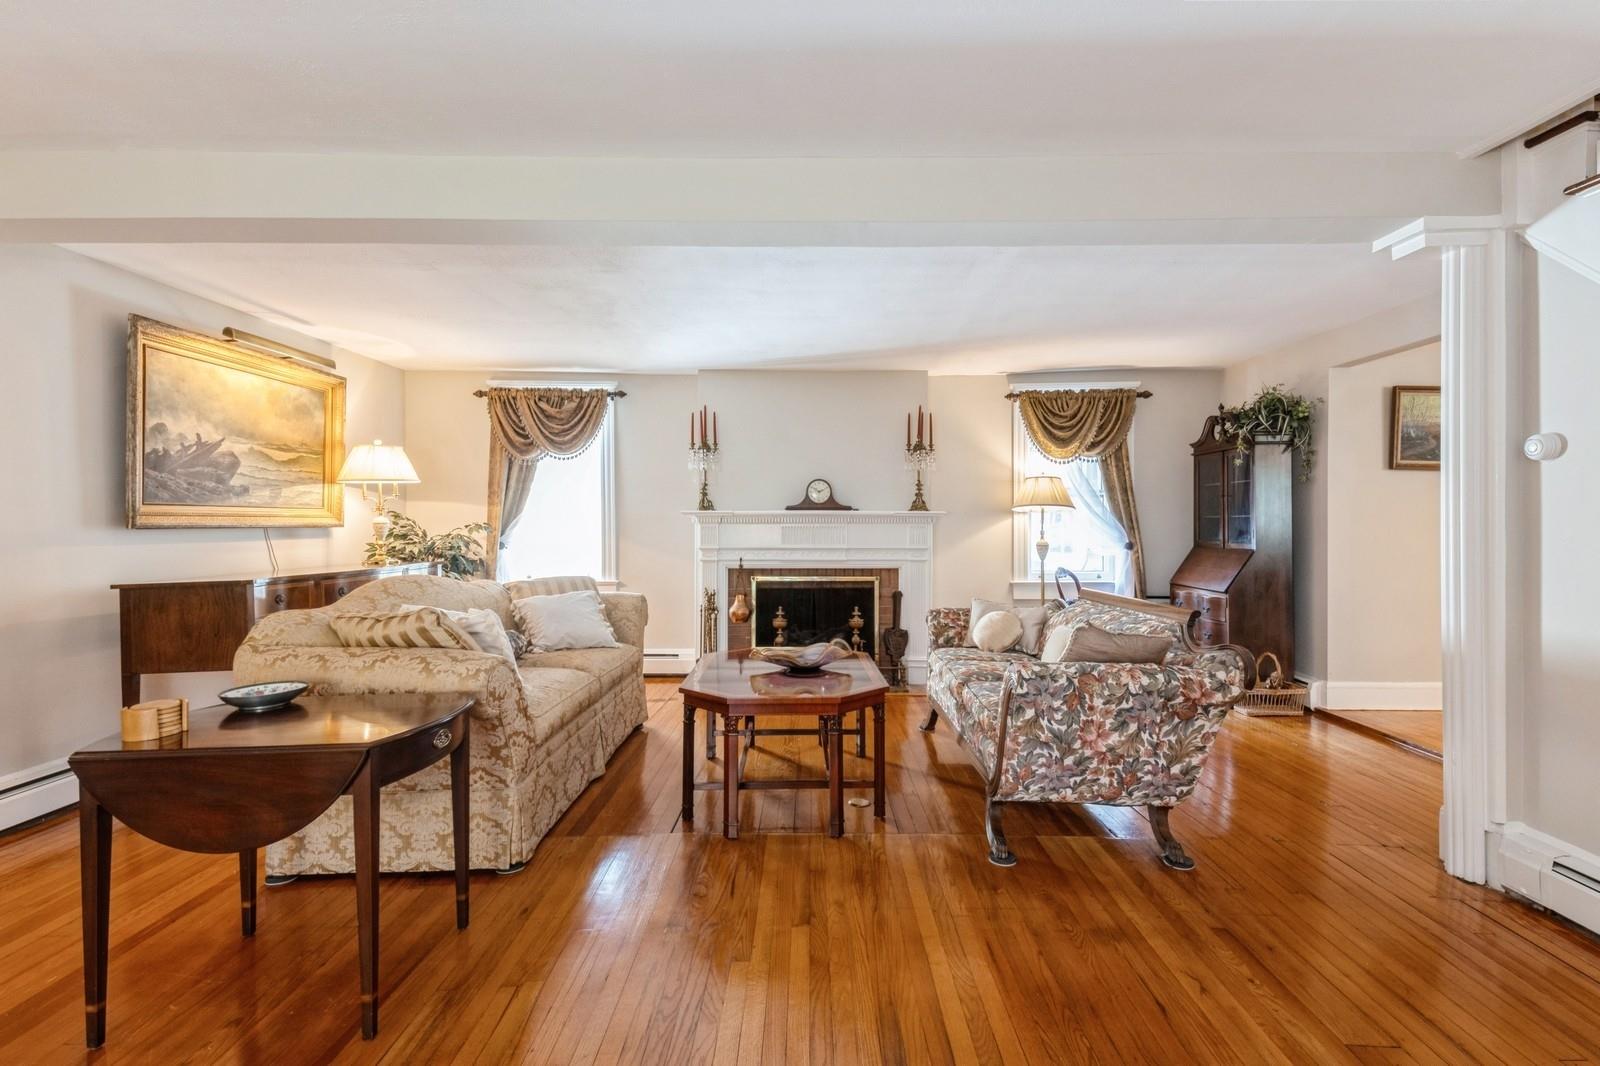
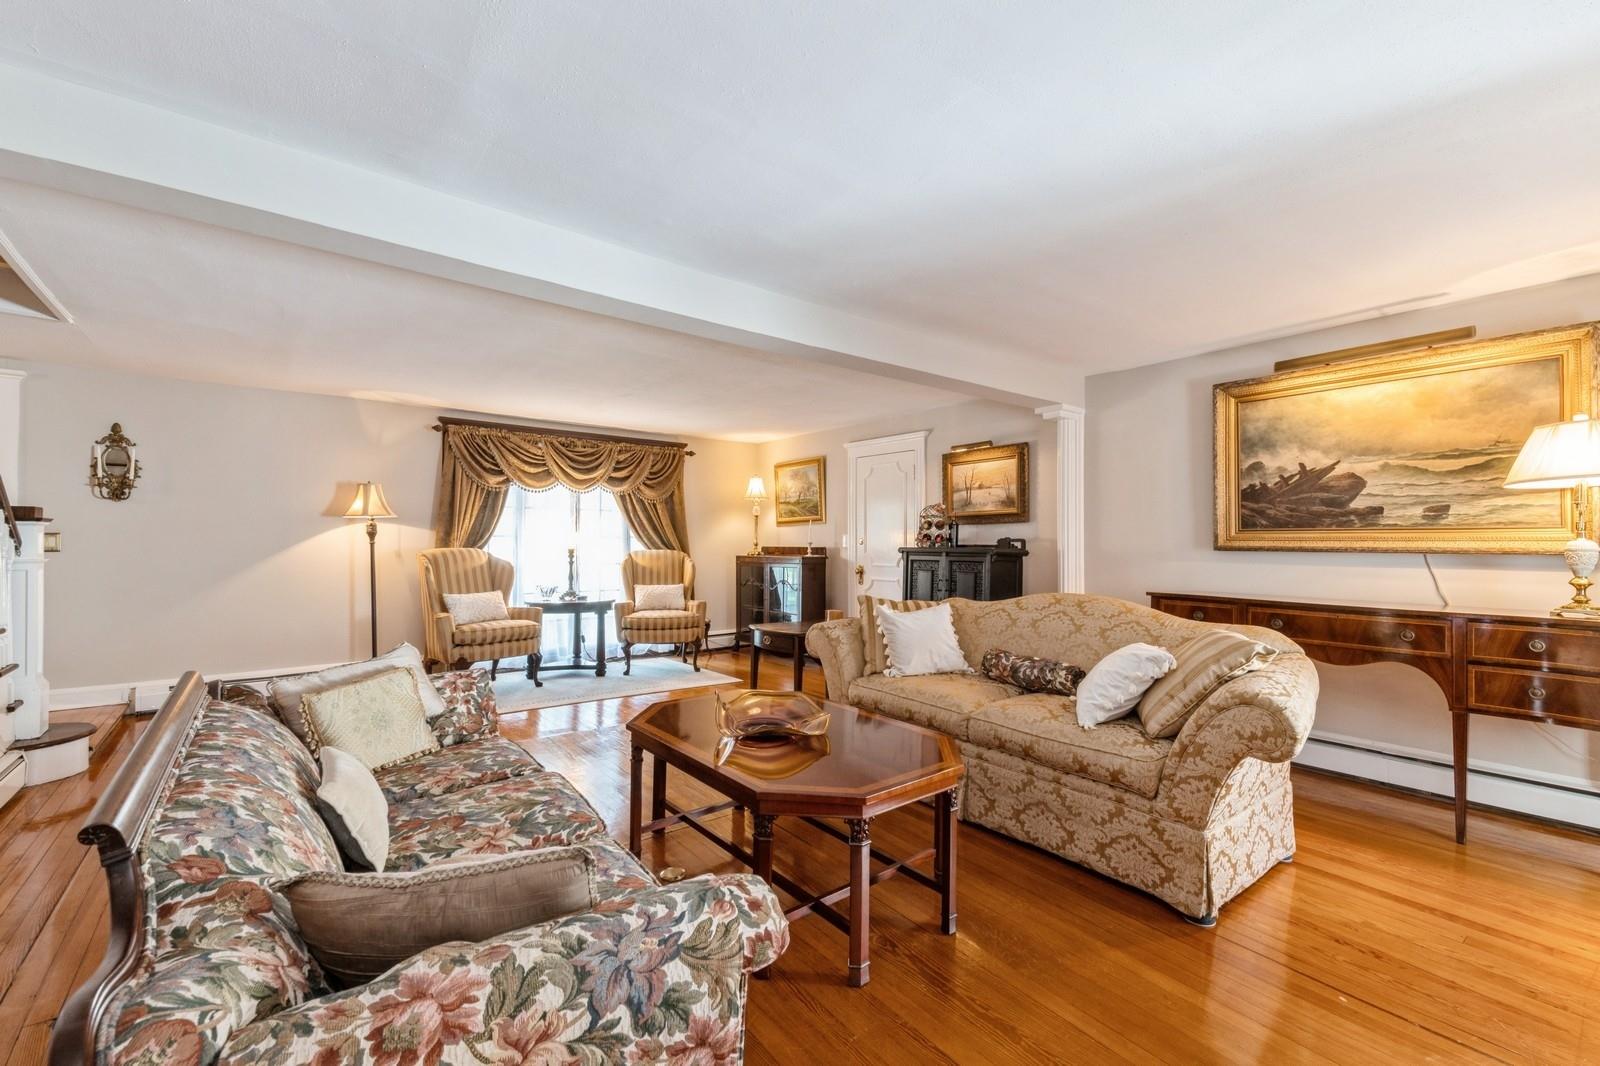
Two magnificent homes in one! Welcome to the ultimate location for the multi-generation lifestyle. This solidly built and lovingly cared for home combines a classic grand colonial with a gorgeous accessory apartment to offer the epitome of luxurious living with extended family or for income. This 4/5 bedroom, 3.5-bath historic colonial complete with an office has 3,317 square feet of beautifully appointed living space nestled on 1.17 private acres in a serene, partially wooded setting. This captivating home offers a rare blend of old-world charm and modern comfort, featuring 9-foot ceilings, rich wood flooring throughout, and exquisite architectural details. Extensively enlarged and remodeled in 1960, the home features floor-to-ceiling 19th century English bronze patio windows, Spanish chandelier, hand-carved Irish oak mantle gracing the gas log fireplace, and other fine details. Another renovation in 2004 brought the electrical and heating systems into the 21st century with 200 amp service, new wiring, and gas fired high efficiency heating. A custom chef's kitchen was added, a true highlight boasting two professional-grade gas stove/ovens, Sub-Zero refrigerator/freezer, cherry cabinetry with granite countertops and backsplash, and gleaming wood flooring—perfect for culinary enthusiasts and entertaining guests. Built also in 2004 was the legal accessory apartment—with its own entrance and parking, separated from the main house for extra privacy by the first floor walk-through laundry room. The thoughtful design offers first floor living with picture windows, a large bright living room, spacious bedroom with two closets, eat-in kitchen with cherry cabinetry and granite counters, and a full bath with a seated shower. Enjoy all the seasons in the inviting three-season porch with a wood-burning stove, or entertain with ease in the private courtyard graced with an expansive patio complete with outdoor kitchen equipped with natural gas grill, burner, refrigerator and hot/cold water. The beautifully landscaped grounds include two long driveways with lighted brick entry walls, Wi-fi enabled in-ground sprinklers, two large sheds, an outhouse (a two-seater!), and a fully fenced partially wooded rear yard offering ultimate privacy and enough room for both pool and tennis court! With a detached 1-car garage with heated workshop, partial basement, three-zone heating and two hot water heaters, this home combines heritage, function, and beauty in one exceptional property. Conveniently located between the restaurants and activities in the village of Patchogue and the charm and beauty of the Village of Bellport, this property is a true gem with thoughtful updates throughout—ready to welcome its next chapter with the fortunate buyers obtaining this majestic estate!
Build Your Team
Quickly find investor-friendly professionals who can help you succeed in real estate investing at any stage of the investing journey.


Agents
Match with investor-friendly agents who can help you find, analyze, and close your next deal


Lenders
Get the best funding…find investor-friendly lenders who specialize in your deal strategy


Property Managers
Transition to passive investing. Find a trusted property management partnership that lasts.


Tax Pros & Accountants
Taxes and financial reporting made easy—find experts to create tax savings strategies, file taxes, and more
Location
Property Details
Parking
- Details: Driveway, Garage
- Garage Spaces: 1
- Spaces Total: 0
Bedroom Information
- # of Bedrooms: 4
Bathroom Information
- # of Baths (Full): 3
- # of Baths (Total): 4.0
Interior Features
- # of Rooms: 12
- # of Stories: 2
- Basement: Yes
- Basement Description: Partial
- Fireplace: Yes
Exterior Features
- Exterior Walls Materials: Wood
Land Information
- Land Use: Residential
- Land Use Subtype: Single Family Residential with ADU
Lot Information
- Parcel ID: 0200977.7002.00002.000
- Lot Size: 50965 sqft
Property Information
- Property Type: Single Family Residence
- Style: Colonial
- Year Built: 1779
Tax Information
- Annual Tax: $18,594
Utilities
- Water & Sewer: Public
- Heating: Wood Stove, Natural Gas
- Cooling: Wall/Window Unit(s)
Location
- County: Suffolk
Listing Details
Investment Summary
- Monthly Cash Flow
- -$4,117
- Cap Rate
- 1.1%
- Cash-on-Cash Return
- -21.5%
- Debt Coverage Ratio
- 0.18
- Internal Rate of Return (5 years)
- -16.8%
Cash Flow
Net Operating Income (NOI) minus mortgage payments.
Calculation:
NOI - Mortgage Payments
Cap Rate (Market Value)
Capitalization Rate is a rate of return that compares the yearly Net Operating Income (NOI) to the market value.
Calculation:
NOI / Market Value
Cash-on-Cash Return (CoC)
Annual Cash Flow / Cash Invested
Calculation:
Annual cash flow divided by initial cash invested.
Debt Coverage Ratio (DCR)
Net Operating Income (NOI) divided by total debt payments.
Calculation:
NOI / Total Debt Payments
Internal Rate of Return (IRR)
A metric for assessing profitability over time. IRR is the discount rate at which the net present value (NPV) of all future cash flows (positive and negative) from an investment equals zero — including both periodic cash flow (such as rent) and a projected sale at the end of the holding period. It represents the expected annualized return, accounting for income, expenses, and the recovery of capital through a future sale.
Purchase Details
Purchase PriceThe price paid for the property. Purchase price:
| $999,000 |
|---|---|
Amount FinancedThe amount of the purchase financed through a loan. Amount financed:
| -$799,200 |
Down paymentThe initial payment made towards the purchase. Down payment:
| $199,800 |
Closing CostsFees and expenses associated with purchasing a property, typically ranging from 2% to 5% of the home’s purchase price, paid at the end of a home purchase to cover services like lending, title transfer, and taxes. Closing costs:
| $29,970 |
Rehab CostsCosts incurred to repair or improve the property, including: roof, flooring, exterior siding, kitchen, exterior paint, bathrooms, etc. Rehab costs:
| $0 |
Initial Cash InvestedThe total initial cash invested in the property. Calculation:Down payment + Buying costs + Rehab costs Initial cash invested:
| $229,770 |
Square Feet (SQFT)The total square footage of the property. Square feet:
| 3,317 |
Cost Per Square FootCost per square foot of the property. Calculation:Purchase Price / Square Feet Cost per square foot:
| $301 |
Monthly Rent Per Square FootMonthly rent divided by the number of square feet. This ratio helps investors compare rental income efficiency across properties, markets, and unit sizes Calculation:Monthly Rent / Square Feet Monthly rent per square foot:
| $1.09 |
Financing Details
Loan AmountThe total sum of money borrowed from a lender to finance a property purchase. Calculation:Purchase Price - Down Payment
Loan amount:
| $799,200 |
|---|---|
Loan to Value Ratio (LTV)Loan amount divided by the market value of the property. Calculation:Loan Amount / Market Value
Loan to value ratio:
| 80.0% |
Loan TypeThe type of loan (e.g., fixed, adjustable).
Loan type:
| Amortizing |
TermThe loan repayment period in years.
Term:
| 30 years |
Interest RateThe percentage a lender charges on the borrowed amount of a loan, determining the cost of borrowing money.
Interest rate:
| 6.500% |
Principal & Interest (PI)The principal is the portion of the loan payment that reduces the loan balance. The interest is the lender's charge for borrowing money. Calculation:(P * r * (1 + r) ** n) / ((1 + r) ** n - 1) Where:
P = Loan amount (principal)
Principal & interest:
| $5,051 |
Property TaxesAnnual taxes levied by local governments on real estate properties. These taxes fund public services like schools, roads, and emergency services.
Property tax:
| $1,550 |
InsuranceThe costs for insurance coverage to protect against financial losses due to risks like fire, natural disasters, theft, liability, or tenant-related damages. Calculation:Assumes 7% of gross rental income, unless insurance rates are specified.
Insurance:
| $252 |
Private Mortgage Insurance (PMI)A fee that borrowers pay when they take out a conventional loan with a loan-to-value (LTV) ratio above 80%.
Private mortgage insurance (PMI):
| $0 |
Monthly PaymentThe fixed amount a borrower pays each month to repay a loan. It typically includes principal and interest (P&I) and may also cover property taxes, insurance, HOA fees, and PMI if escrowed. Monthly payment:
| $6,853 |
Operating Income
| % Rent | Monthly | Yearly | |
|---|---|---|---|
Gross RentThe total rental income received from tenants before deducting any expenses. Includes base rent, late fees, pet fees, parking fees, and other recurring charges.
Gross rent:
| $3,600 | $43,200 | |
Vacancy LossExpected loss of rent due to vacancies.
Vacancy loss:
(6%)
| 6% | -$216 | -$2,592 |
Operating IncomeGross rental income minus vacancy loss. Calculation:Gross rent - Vacancy loss
Operating income:
| $3,384 | $40,608 |
Operating Expenses
| % Rent | Monthly | Yearly | |
|---|---|---|---|
Property TaxesAnnual taxes levied by local governments on real estate properties. These taxes fund public services like schools, roads, and emergency services. | 43% | -$1,550 | -$18,594 |
InsuranceThe costs for insurance coverage to protect against financial losses due to risks like fire, natural disasters, theft, liability, or tenant-related damages. Calculation:Assumes 7% of gross rental income, unless insurance rates are specified. | 7% | -$252 | -$3,024 |
Property ManagementThe costs associated with hiring a property manager to handle the day-to-day operations of a rental property. Includes management fees, leasing fes, eviction fees, etc. Calculation:Assumes 8% of gross rental income. | 8% | -$288 | -$3,456 |
Repairs & MaintenanceOngoing costs for routine upkeep and minor fixes needed to keep a property in good working condition. Calculation:Assumes 5% of gross rental income. Varies by property age and condition. | 5% | -$180 | -$2,160 |
Capital ExpensesLarge, infrequent costs for major improvements or replacements, like a new roof, HVAC system, or appliances. Calculation:Assumes 5% of gross rental income. Varies by property age. | 5% | -$180 | -$2,160 |
HOA FeesRegular dues paid to a Homeowners Association for community maintenance, amenities, and management. Similar fees include: Condo Association Fees, Co-op Maintenance Fees, etc. | n/a | n/a | n/a |
Operating ExpensesRecurring costs required to maintain and manage a rental property, including property taxes, insurance, maintenance, repairs, utilities (if paid by the owner), property management fees, and other day-to-day expenses. Calculation:Insurance + Property Taxes + Property Management + Repairs & Maintenance + Capital Expenditures + HOA Fees | 68% | -$2,450 | -$29,394 |
Cash Flow
| Monthly | Yearly | |
|---|---|---|
Net Operating Income (NOI)The income generated from a property after deducting all operating expenses but before deducting mortgage payments, taxes, and capital expenditures. Calculation:Gross Operating Income - Operating Expenses
Net operating income:
| $934 | $11,208 |
Mortgage PaymentThe fixed amount a borrower pays each month to repay a loan. It typically includes principal and interest (P&I) and may also cover property taxes, insurance, HOA fees, and PMI if escrowed. | -$5,051 | -$60,612 |
Cash FlowNet Operating Income (NOI) minus mortgage payments. Calculation:NOI - Mortgage Payments | $4,117 | $49,404 |