Suffolk County Investment Properties for Sale
Browse homes for sale and investment properties in Suffolk County. Refine your search by price, property type, or more.
Best cash flowing properties in Suffolk County
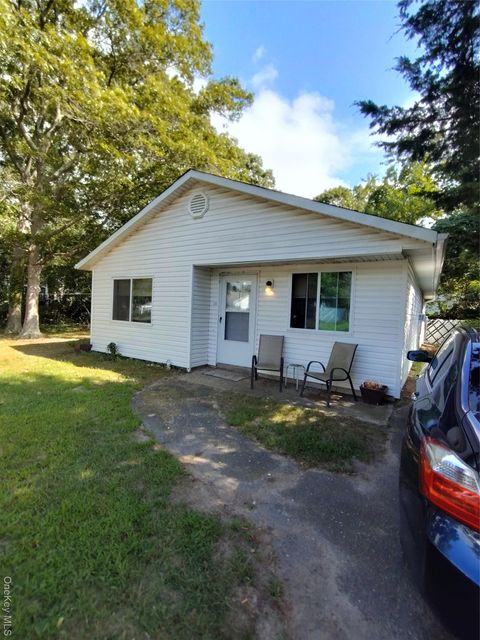
Active
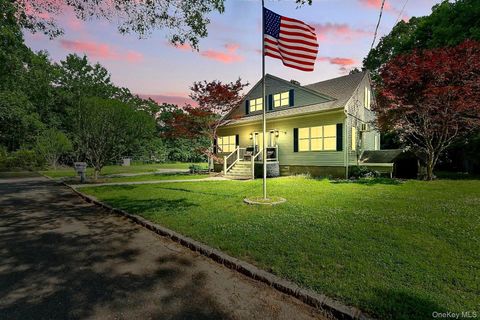
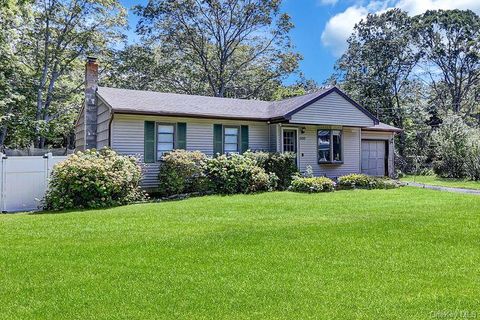
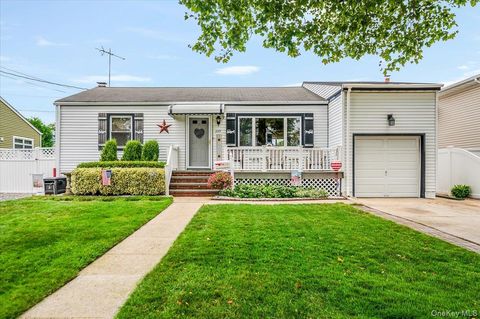
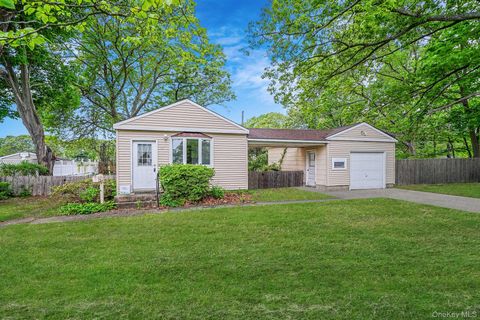
$399,000
3
bds
|
1
ba
|
1,100
sqft
|
built
1975
14 Wellwood Dr, Shirley, NY 11967
$-184
Cash flow
-2.4%
Cash-on-Cash Return
5.5%
Cap rate
0.9%
Rent to Value Ratio
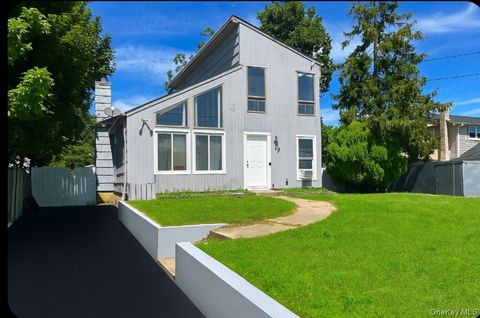
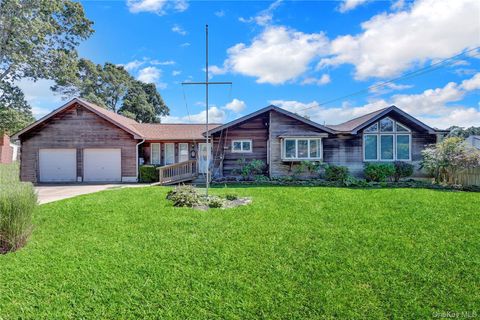
Active
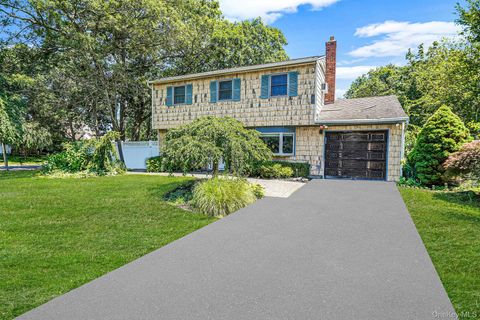
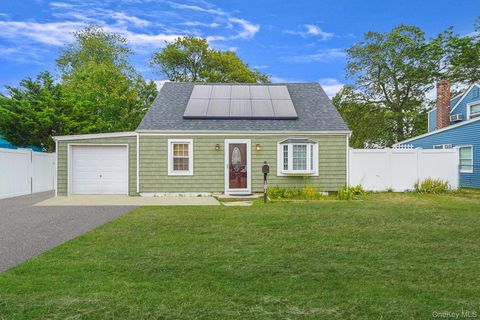
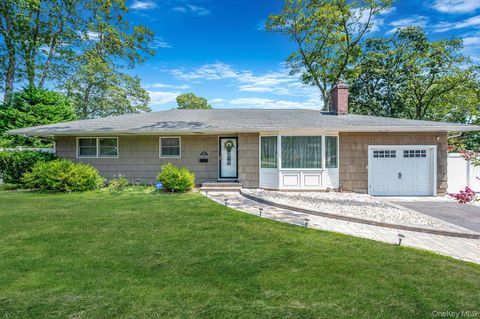
$390,000
3
bds
|
2
ba
|
1,600
sqft
|
built
1988
85 Saint George Dr, Shirley, NY 11967
$-368
Cash flow
-4.9%
Cash-on-Cash Return
4.9%
Cap rate
0.8%
Rent to Value Ratio
1,025 out of 2,489 properties for sale in Suffolk County
Limited Results Shown
Create a free account, or log in to reveal all property listings and enjoy the complete experience.
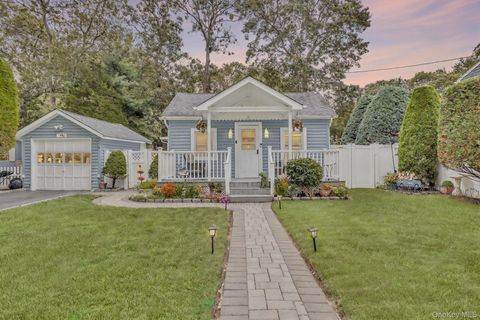
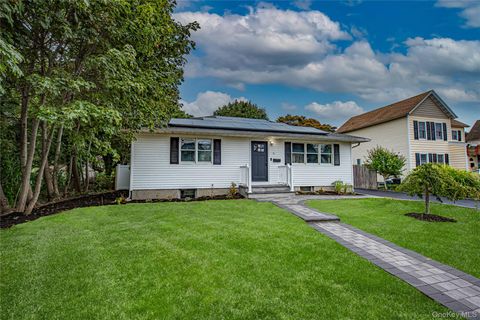
Active
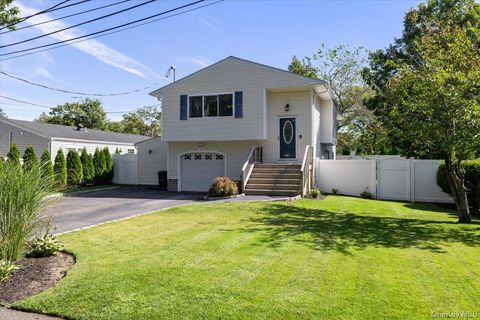
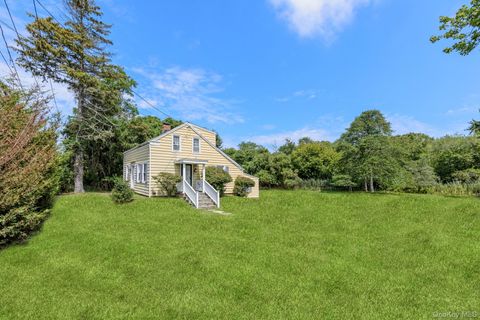
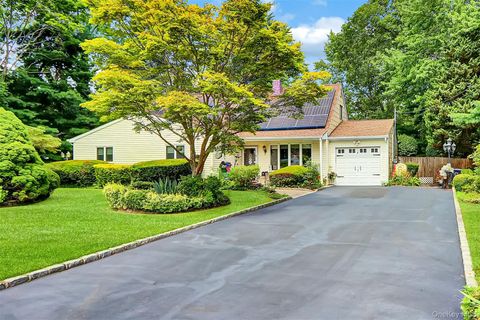
$599,999
2
bds
|
1
ba
|
914
sqft
|
built
1950
44 Lexington Ave, Patchogue, NY 11772
$-1,325
Cash flow
-11.5%
Cash-on-Cash Return
3.4%
Cap rate
0.5%
Rent to Value Ratio

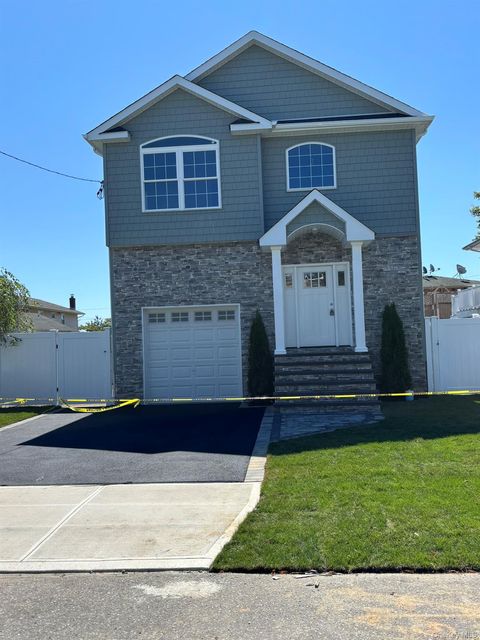
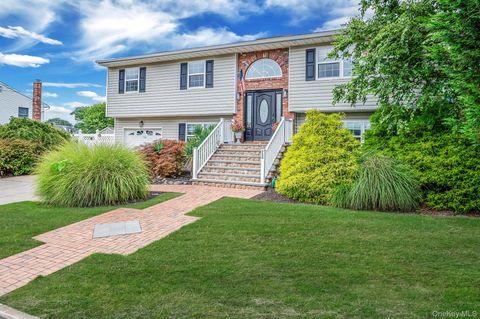
Active
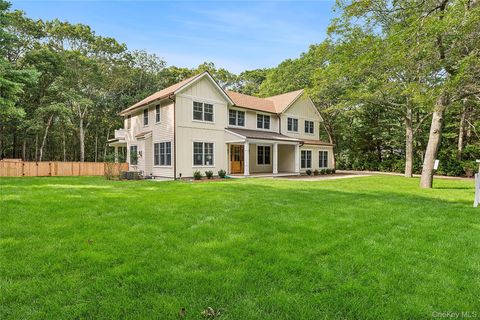
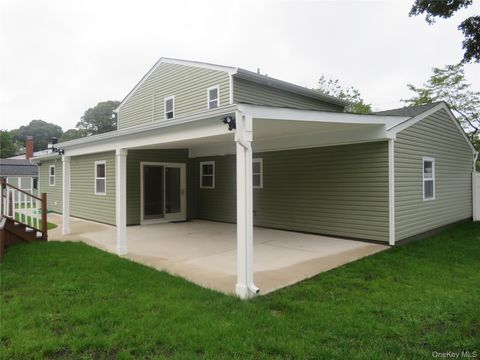
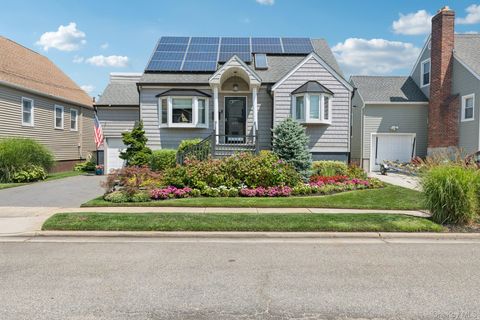
$670,000
4
bds
|
3
ba
|
2,400
sqft
|
built
1975
45 Rush St, Port Jefferson Station, NY 11776
$-1,993
Cash flow
-15.5%
Cash-on-Cash Return
2.5%
Cap rate
0.5%
Rent to Value Ratio
Active
$695,000
3
bds
|
2
ba
|
1,200
sqft
|
built
1935
28 E 6th St, Patchogue, NY 11772
$-2,233
Cash flow
-16.8%
Cash-on-Cash Return
2.2%
Cap rate
0.5%
Rent to Value Ratio
Active
$849,000
4
bds
|
3
ba
|
2,200
sqft
|
built
2025
3 Garfield Pl, Lindenhurst, NY 11757
$-2,499
Cash flow
-15.4%
Cash-on-Cash Return
2.5%
Cap rate
0.3%
Rent to Value Ratio
Active
$549,999
3
bds
|
1
ba
|
972
sqft
|
built
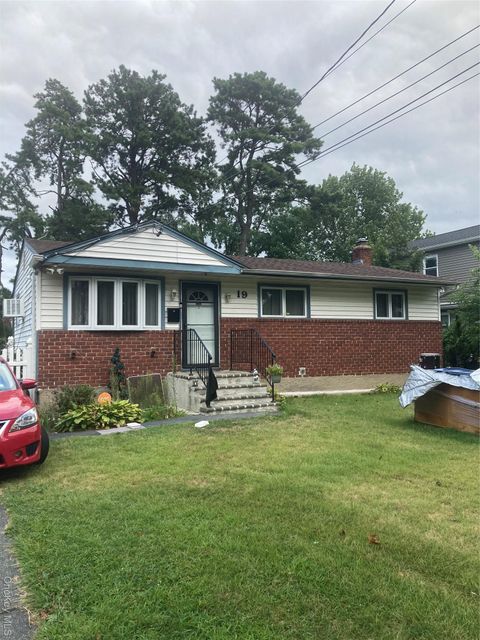
1970
19 Logan Rd, Brentwood, NY 11717
$-1,806
Cash flow
-17.1%
Cash-on-Cash Return
2.1%
Cap rate
0.5%
Rent to Value Ratio
Active
$599,000
3
bds
|
2
ba
|
1,200
sqft
|
built
1948
205 S 12th St, Lindenhurst, NY 11757
$-1,598
Cash flow
-13.9%
Cash-on-Cash Return
2.9%
Cap rate
0.5%
Rent to Value Ratio
Active
$499,000
3
bds
|
1
ba
|
1,000
sqft
|
built
1971
161 Shinnecock Ave, Mastic, NY 11950
$-840
Cash flow
-8.8%
Cash-on-Cash Return
4.0%
Cap rate
0.6%
Rent to Value Ratio
Active
$395,000
1
bds
|
2
ba
|
916
sqft
|
built
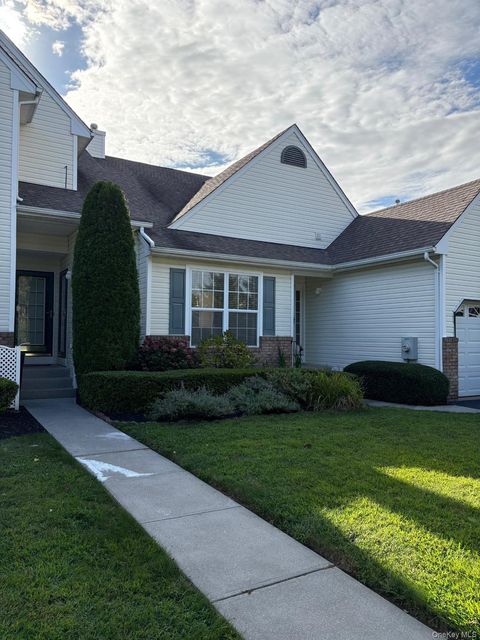
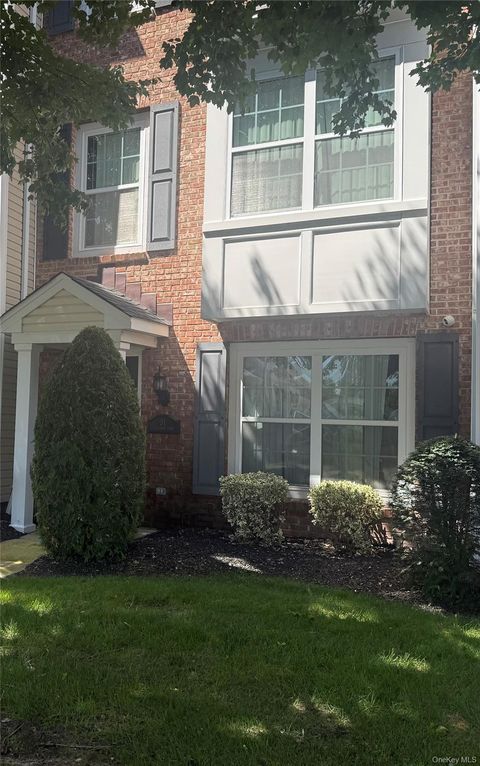
1999
1506 Nicole Dr, Port Jefferson Station, NY 11776
$-1,048
Cash flow
-13.8%
Cash-on-Cash Return
2.9%
Cap rate
0.7%
Rent to Value Ratio
Active
$852,000
4
bds
|
3
ba
|
1,800
sqft
|
built
1964
3 Alabama Ave, Port Jefferson Station, NY 11776
$-1,775
Cash flow
-10.9%
Cash-on-Cash Return
3.6%
Cap rate
0.6%
Rent to Value Ratio
Active
$499,999
3
bds
|
2
ba
|
1,593
sqft
|
built
1958
16 Flintlock Dr, Shirley, NY 11967
$-868
Cash flow
-9.1%
Cash-on-Cash Return
4.0%
Cap rate
0.7%
Rent to Value Ratio
Active
$599,999
3
bds
|
2
ba
|
2,146
sqft
|
built
1959
31 Terrell St, Patchogue, NY 11772
$-1,738
Cash flow
-15.1%
Cash-on-Cash Return
2.6%
Cap rate
0.5%
Rent to Value Ratio
Active
$805,000
4
bds
|
3
ba
|
2,388
sqft
|
built
1995
750 Hancock Pl, Lindenhurst, NY 11757
$-3,457
Cash flow
-22.4%
Cash-on-Cash Return
0.9%
Cap rate
0.3%
Rent to Value Ratio
Active
$839,000
3
bds
|
3
ba
|
2,612
sqft
|
built
2000
7 Oliver St, Port Jefferson Station, NY 11776
$-2,775
Cash flow
-17.3%
Cash-on-Cash Return
2.1%
Cap rate
0.5%
Rent to Value Ratio
Active
$699,000
4
bds
|
3
ba
|
1,778
sqft
|
built
2002
289 Carleton Dr E, Shirley, NY 11967
$-1,620
Cash flow
-12.1%
Cash-on-Cash Return
3.3%
Cap rate
0.6%
Rent to Value Ratio
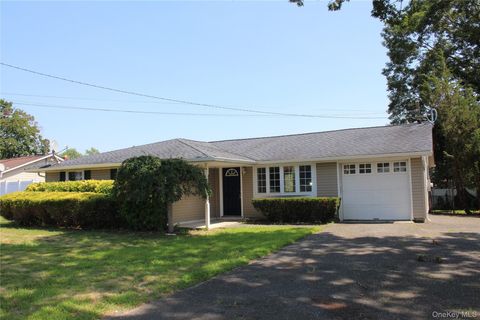
Active
$499,000
3
bds
|
1
ba
|
1,010
sqft
|
built
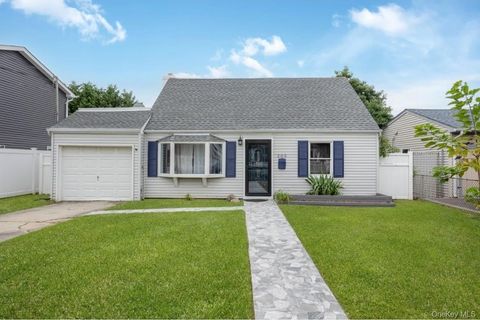
1958
78 E Seacrest Ave, Lindenhurst, NY 11757
$-1,103
Cash flow
-11.5%
Cash-on-Cash Return
3.4%
Cap rate
0.6%
Rent to Value Ratio
Active
$599,000
3
bds
|
2
ba
|
1,500
sqft
|
built
1970
1 Dillon Ave, Port Jefferson Station, NY 11776
$-1,485
Cash flow
-12.9%
Cash-on-Cash Return
3.1%
Cap rate
0.6%
Rent to Value Ratio
Active
$535,000
3
bds
|
1
ba
|
1,128
sqft
|
built
1944
75 E Shore Dr, Patchogue, NY 11772
$-1,070
Cash flow
-10.4%
Cash-on-Cash Return
3.7%
Cap rate
0.6%
Rent to Value Ratio
Active
$8,975,000
7
bds
|
5
ba
|
2,000
sqft
|
built
1966
6 Gallatin Ln, East Hampton, NY 11937
$-39,431
Cash flow
-22.9%
Cash-on-Cash Return
0.8%
Cap rate
0.1%
Rent to Value Ratio
Active
$499,000
3
bds
|
1
ba
|
0
sqft
|
built
1962
26 William St, Port Jefferson Station, NY 11776
$-893
Cash flow
-9.3%
Cash-on-Cash Return
3.9%
Cap rate
0.7%
Rent to Value Ratio
Active
$799,000
4
bds
|
3
ba
|
3,000
sqft
|
built
2001
4 Patty Ann Ct, Port Jefferson Station, NY 11776
$-2,541
Cash flow
-16.6%
Cash-on-Cash Return
2.3%
Cap rate
0.6%
Rent to Value Ratio
Active
$599,000
2
bds
|
3
ba
|
1,080
sqft
|
built
2007
31 Stahlman Ln, Patchogue, NY 11772
$-1,681
Cash flow
-14.6%
Cash-on-Cash Return
2.7%
Cap rate
0.5%
Rent to Value Ratio
Active
$849,999
3
bds
|
2
ba
|
2,167
sqft
|
built
1949
729 S 9th St, Lindenhurst, NY 11757
$-3,777
Cash flow
-23.2%
Cash-on-Cash Return
0.7%
Cap rate
0.3%
Rent to Value Ratio
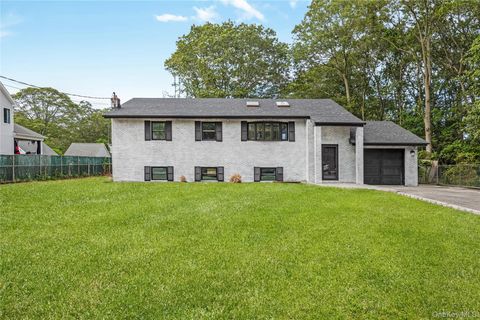
Active
$579,000
4
bds
|
2
ba
|
1,244
sqft
|
built
1967
114 Granny Rd, Farmingville, NY 11738
$-1,368
Cash flow
-12.3%
Cash-on-Cash Return
3.2%
Cap rate
0.6%
Rent to Value Ratio
Active
$699,999
5
bds
|
3
ba
|
2,608
sqft
|
built
1989
101 Crestwood Dr, Shirley, NY 11967
$-2,661
Cash flow
-19.8%
Cash-on-Cash Return
1.5%
Cap rate
0.4%
Rent to Value Ratio
Active
$550,000
3
bds
|
2
ba
|
912
sqft
|
built
1987
500 Boxwood Dr, Shirley, NY 11967
$-1,149
Cash flow
-10.9%
Cash-on-Cash Return
3.6%
Cap rate
0.6%
Rent to Value Ratio
Active
$499,888
3
bds
|
3
ba
|
1,260
sqft
|
built
1959
20 Revere Cir, Port Jefferson Station, NY 11776
$-878
Cash flow
-9.2%
Cash-on-Cash Return
4.0%
Cap rate
0.7%
Rent to Value Ratio
Active
$614,999
3
bds
|
2
ba
|
1,900
sqft
|
built
1972
15 Grand Ave, Patchogue, NY 11772
$-1,375
Cash flow
-11.7%
Cash-on-Cash Return
3.4%
Cap rate
0.6%
Rent to Value Ratio

Active
$559,000
5
bds
|
2
ba
|
1,200
sqft
|
built
1990
143 Robinwood Dr, Shirley, NY 11967
$-991
Cash flow
-9.2%
Cash-on-Cash Return
3.9%
Cap rate
0.6%
Rent to Value Ratio
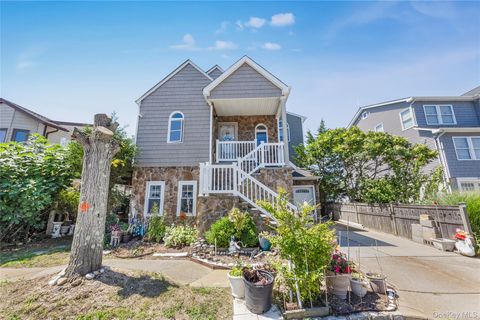
Active
$4,695,000
7
bds
|
7
ba
|
4,974
sqft
|
built
2025
9 Lincoln St, Sag Harbor, NY 11963
$-16,855
Cash flow
-18.7%
Cash-on-Cash Return
1.8%
Cap rate
0.2%
Rent to Value Ratio
Active
$559,000
3
bds
|
1
ba
|
991
sqft
|
built
1953
225 Granada Pkwy, Lindenhurst, NY 11757
$-1,802
Cash flow
-16.8%
Cash-on-Cash Return
2.2%
Cap rate
0.5%
Rent to Value Ratio
Active
$639,999
4
bds
|
2
ba
|
1,600
sqft
|
built
1951
181 S Alleghany Ave, Lindenhurst, NY 11757
$-2,061
Cash flow
-16.8%
Cash-on-Cash Return
2.2%
Cap rate
0.4%
Rent to Value Ratio
Active
$1,595,000
3
bds
|
3
ba
|
1,900
sqft
|
built
1895
1680 N Sea Rd, Southampton, NY 11968
$-3,985
Cash flow
-13.0%
Cash-on-Cash Return
3.1%
Cap rate
0.4%
Rent to Value Ratio
Active
$699,900
6
bds
|
3
ba
|
2,825
sqft
|
built
1970
22 Shamrock Ln, Centereach, NY 11720
$-2,265
Cash flow
-16.9%
Cash-on-Cash Return
2.2%
Cap rate
0.5%
Rent to Value Ratio
Active
$445,000
2
bds
|
1
ba
|
900
sqft
|
built
1937
96 Toomey Rd, West Islip, NY 11795
$-1,383
Cash flow
-16.2%
Cash-on-Cash Return
2.3%
Cap rate
0.5%
Rent to Value Ratio
Active
$729,000
4
bds
|
2
ba
|
1,887
sqft
|
built
1960
249 N Prospect Ave, Patchogue, NY 11772
$-1,780
Cash flow
-12.7%
Cash-on-Cash Return
3.1%
Cap rate
0.6%
Rent to Value Ratio
Active
$609,999
4
bds
|
2
ba
|
1,560
sqft
|
built
1971
5 Aspen St, Port Jefferson Station, NY 11776
$-1,288
Cash flow
-11.0%
Cash-on-Cash Return
3.5%
Cap rate
0.7%
Rent to Value Ratio
Active
$899,000
3
bds
|
2
ba
|
1,800
sqft
|
built
1947
650 S 9th St, Lindenhurst, NY 11757
$-3,805
Cash flow
-22.1%
Cash-on-Cash Return
1.0%
Cap rate
0.3%
Rent to Value Ratio
Active
$465,000
3
bds
|
1
ba
|
996
sqft
|
built
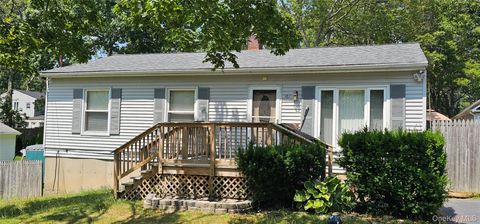
1970
62 Eleanor Ave, Mastic, NY 11950
$-573
Cash flow
-6.4%
Cash-on-Cash Return
4.6%
Cap rate
0.8%
Rent to Value Ratio