Suffolk County Investment Properties for Sale
Browse homes for sale and investment properties in Suffolk County. Refine your search by price, property type, or more.
Best cash flowing properties in Suffolk County
Active
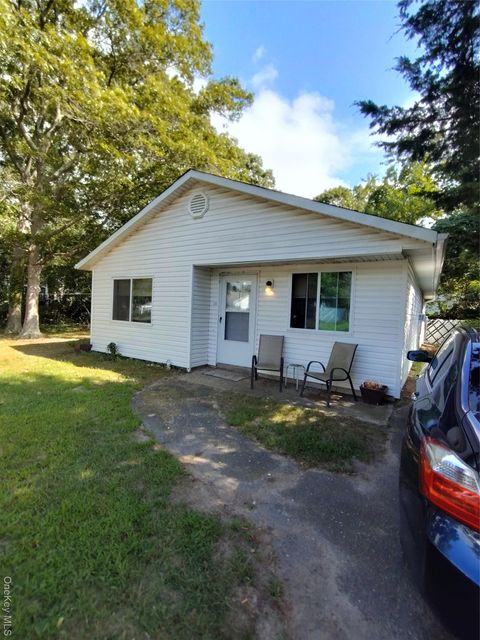
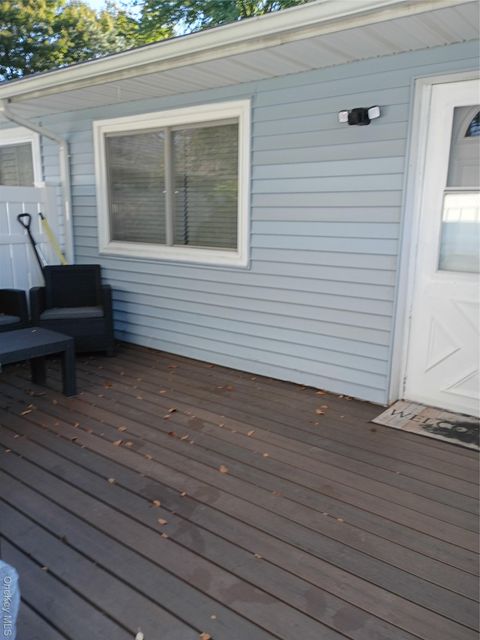
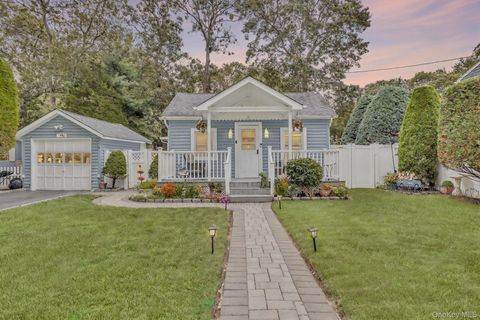
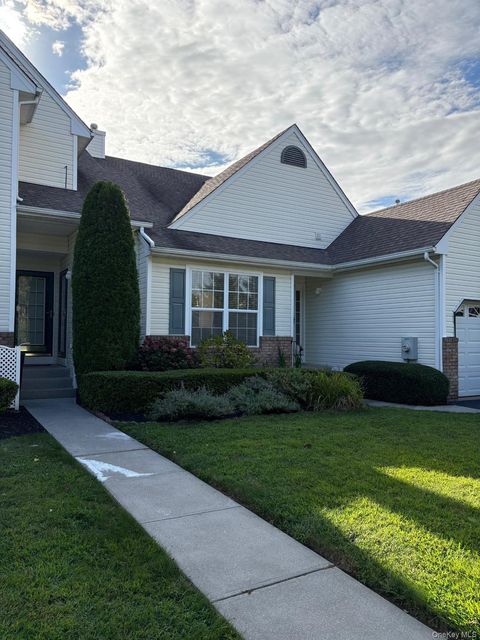
$399,000
3
bds
|
1
ba
|
1,100
sqft
|
built
1975
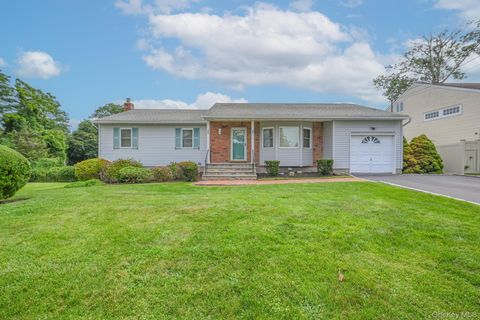
14 Wellwood Dr, Shirley, NY 11967
$-184
Cash flow
-2.4%
Cash-on-Cash Return
5.5%
Cap rate
0.9%
Rent to Value Ratio
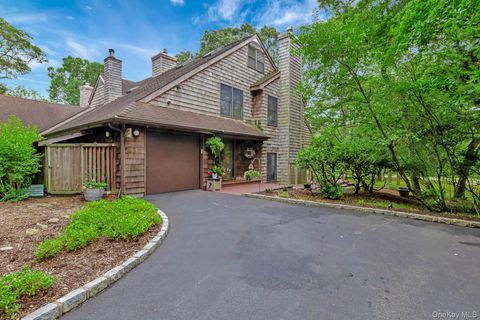
Active
$355,000
1
bds
|
1
ba
|
702
sqft
|
built
1972
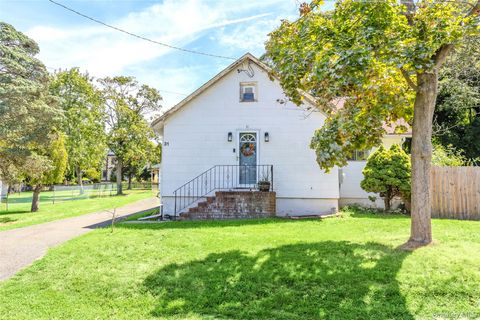
269 Storm Dr, Holtsville, NY 11742
$-618
Cash flow
-9.1%
Cash-on-Cash Return
4.0%
Cap rate
0.7%
Rent to Value Ratio
1,437 out of 1,743 properties for sale in Suffolk County
Limited Results Shown
Create a free account, or log in to reveal all property listings and enjoy the complete experience.

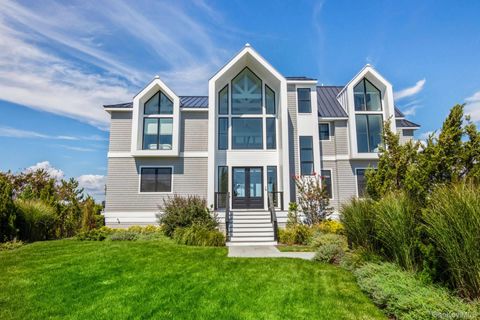
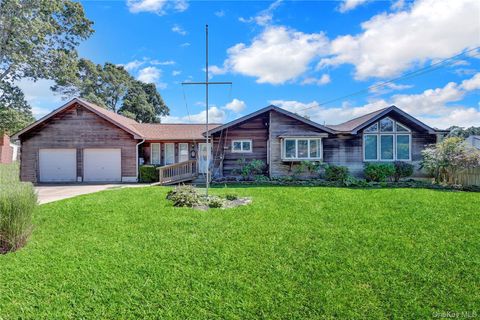
Active
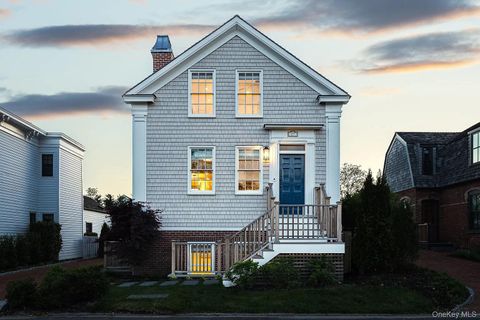
$1,195,000
3
bds
|
2
ba
|
2,350
sqft
|
built
2005
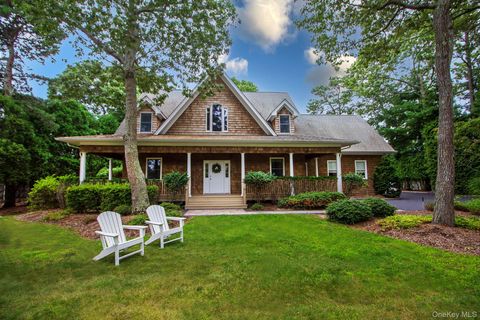
155 2nd Ave, Peconic, NY 11958
$-4,406
Cash flow
-19.2%
Cash-on-Cash Return
1.6%
Cap rate
0.3%
Rent to Value Ratio
Active
$7,950,000
6
bds
|
7
ba
|
5,200
sqft
|
built
2020
20 Cove Ln, Westhampton Beach, NY 11978
$-36,297
Cash flow
-23.8%
Cash-on-Cash Return
0.6%
Cap rate
0.1%
Rent to Value Ratio
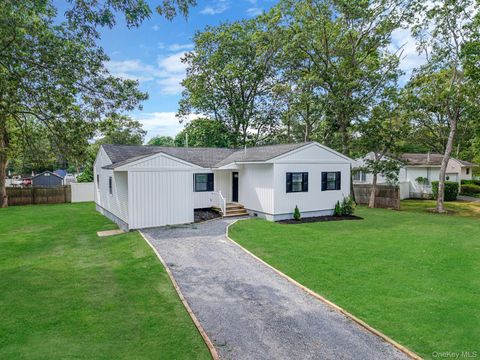
Active
$580,000
2
bds
|
3
ba
|
1,600
sqft
|
built
1985
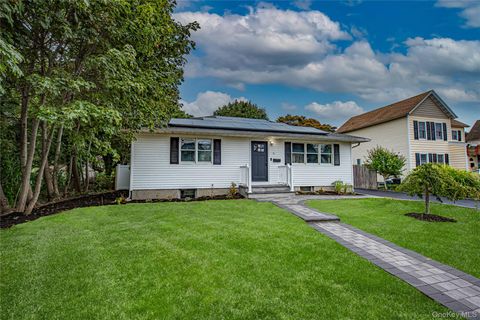
204 Pepperidge Lake Rd, Eastport, NY 11941
$-2,013
Cash flow
-18.1%
Cash-on-Cash Return
1.9%
Cap rate
0.6%
Rent to Value Ratio
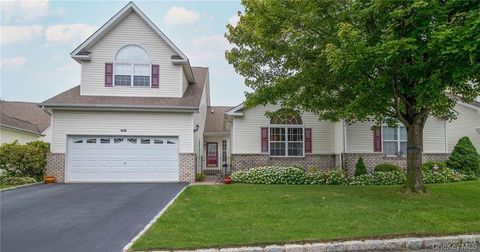
Active
$599,999
2
bds
|
1
ba
|
914
sqft
|
built
1950
44 Lexington Ave, Patchogue, NY 11772
$-1,325
Cash flow
-11.5%
Cash-on-Cash Return
3.4%
Cap rate
0.5%
Rent to Value Ratio
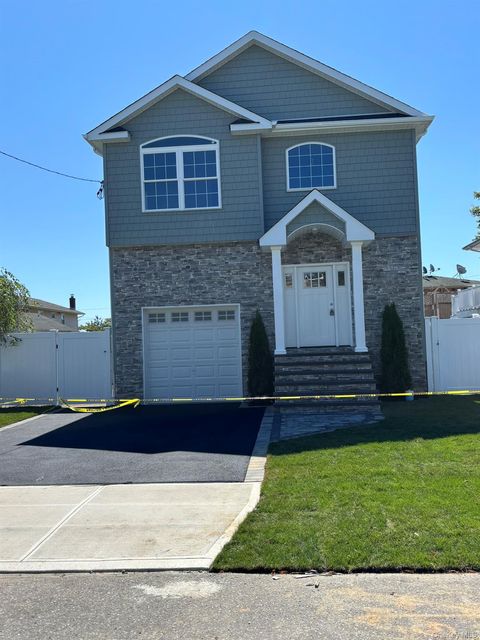
Active
$849,000
4
bds
|
3
ba
|
2,200
sqft
|
built
2025
3 Garfield Pl, Lindenhurst, NY 11757
$-2,499
Cash flow
-15.4%
Cash-on-Cash Return
2.5%
Cap rate
0.3%
Rent to Value Ratio
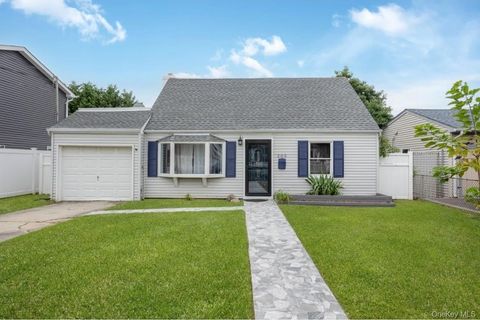
Active
$599,000
3
bds
|
2
ba
|
1,200
sqft
|
built
1948
205 S 12th St, Lindenhurst, NY 11757
$-1,598
Cash flow
-13.9%
Cash-on-Cash Return
2.9%
Cap rate
0.5%
Rent to Value Ratio
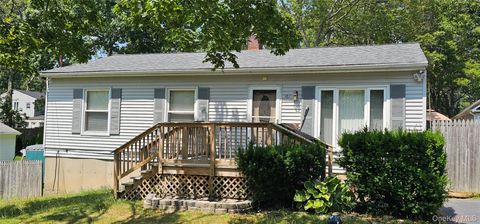
Active
$499,000
3
bds
|
1
ba
|
1,000
sqft
|
built
1971
161 Shinnecock Ave, Mastic, NY 11950
$-840
Cash flow
-8.8%
Cash-on-Cash Return
4.0%
Cap rate
0.6%
Rent to Value Ratio
Active
$395,000
1
bds
|
2
ba
|
916
sqft
|
built
1999
1506 Nicole Dr, Port Jefferson Station, NY 11776
$-1,048
Cash flow
-13.8%
Cash-on-Cash Return
2.9%
Cap rate
0.7%
Rent to Value Ratio
Active
$499,999
3
bds
|
2
ba
|
1,593
sqft
|
built
1958
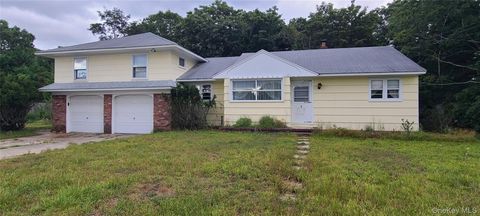
16 Flintlock Dr, Shirley, NY 11967
$-868
Cash flow
-9.1%
Cash-on-Cash Return
4.0%
Cap rate
0.7%
Rent to Value Ratio
Active
$665,000
4
bds
|
2
ba
|
1,700
sqft
|
built
1971
220 Peekskill Ave, Medford, NY 11763
$-1,926
Cash flow
-15.1%
Cash-on-Cash Return
2.6%
Cap rate
0.5%
Rent to Value Ratio
Active
$775,000
4
bds
|
4
ba
|
2,367
sqft
|
built
2002
37 Constantine Way, Mount Sinai, NY 11766
$-1,941
Cash flow
-13.1%
Cash-on-Cash Return
3.1%
Cap rate
0.6%
Rent to Value Ratio
Active
$675,000
3
bds
|
2
ba
|
1,250
sqft
|
built
1993
59 Rosewood Rd, Kings Park, NY 11754
$-2,369
Cash flow
-18.3%
Cash-on-Cash Return
1.9%
Cap rate
0.5%
Rent to Value Ratio
Active
$1,750,000
4
bds
|
4
ba
|
2,938
sqft
|
built
2003
49 Bridle Path, Westhampton Beach, NY 11978
$-4,416
Cash flow
-13.2%
Cash-on-Cash Return
3.0%
Cap rate
0.4%
Rent to Value Ratio
Active
$499,996
2
bds
|
2
ba
|
1,040
sqft
|
built
1948
31 Elm Rd, Rocky Point, NY 11778
$-1,337
Cash flow
-14.0%
Cash-on-Cash Return
2.9%
Cap rate
0.6%
Rent to Value Ratio
Active
$599,999
3
bds
|
2
ba
|
2,146
sqft
|
built
1959
31 Terrell St, Patchogue, NY 11772
$-1,738
Cash flow
-15.1%
Cash-on-Cash Return
2.6%
Cap rate
0.5%
Rent to Value Ratio
Active
$979,000
5
bds
|
3
ba
|
2,102
sqft
|
built
1963
8 N Westbury Rd, Hampton Bays, NY 11946
$-1,744
Cash flow
-9.3%
Cash-on-Cash Return
3.9%
Cap rate
0.6%
Rent to Value Ratio
Active
$679,000
3
bds
|
3
ba
|
2,700
sqft
|
built
1977
26 Concord Dr, Holtsville, NY 11742
$-2,103
Cash flow
-16.2%
Cash-on-Cash Return
2.4%
Cap rate
0.5%
Rent to Value Ratio
Active
$549,000
2
bds
|
3
ba
|
1,840
sqft
|
built
1991
25 Jeremy Cir, Nesconset, NY 11767
$-1,935
Cash flow
-18.4%
Cash-on-Cash Return
1.8%
Cap rate
0.6%
Rent to Value Ratio
Active
$998,999
3
bds
|
3
ba
|
2,100
sqft
|
built
1996
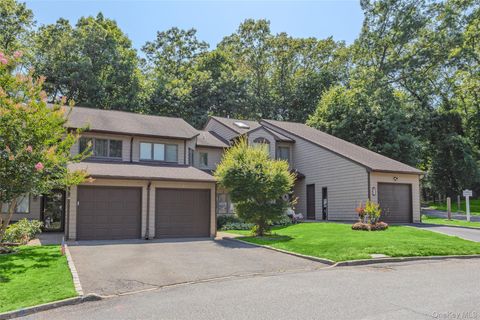
7 Silver Pond Cir, Commack, NY 11725
$-2,897
Cash flow
-15.1%
Cash-on-Cash Return
2.6%
Cap rate
0.5%
Rent to Value Ratio
Active
$805,000
4
bds
|
3
ba
|
2,388
sqft
|
built
1995
750 Hancock Pl, Lindenhurst, NY 11757
$-3,457
Cash flow
-22.4%
Cash-on-Cash Return
0.9%
Cap rate
0.3%
Rent to Value Ratio
Active
$740,000
3
bds
|
3
ba
|
1,997
sqft
|
built
1999
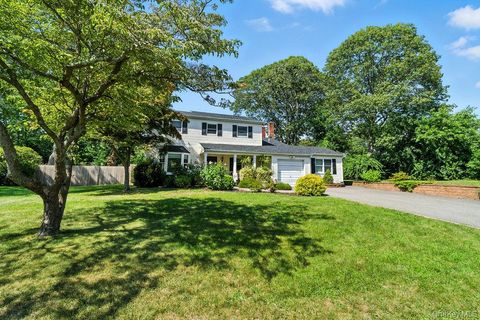
220 Erik Dr, East Setauket, NY 11733
$-1,954
Cash flow
-13.8%
Cash-on-Cash Return
2.9%
Cap rate
0.5%
Rent to Value Ratio

Active
$825,000
4
bds
|
3
ba
|
1,984
sqft
|
built
1972
26 Royal Way, Shoreham, NY 11786
$-2,491
Cash flow
-15.8%
Cash-on-Cash Return
2.4%
Cap rate
0.6%
Rent to Value Ratio
Active
$12,750,000
7
bds
|
9
ba
|
10,000
sqft
|
built
2025
16 Arbor Path, Amagansett, NY 11930
$-59,346
Cash flow
-24.3%
Cash-on-Cash Return
0.5%
Cap rate
0.1%
Rent to Value Ratio
Active
$2,999,000
4
bds
|
4
ba
|
4,743
sqft
|
built
2016
12 Redwood Dr, Dix Hills, NY 11746
$-15,648
Cash flow
-27.2%
Cash-on-Cash Return
-0.2%
Cap rate
0.1%
Rent to Value Ratio
Active
$725,000
3
bds
|
3
ba
|
1,728
sqft
|
built
1989
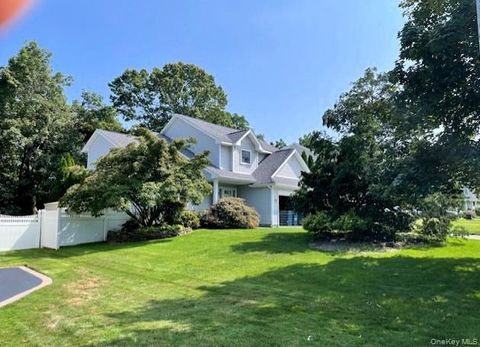
20 Lincoln Blvd, East Moriches, NY 11940
$-1,808
Cash flow
-13.0%
Cash-on-Cash Return
3.1%
Cap rate
0.6%
Rent to Value Ratio
Active
$1,050,000
3
bds
|
2
ba
|
1,203
sqft
|
built
1911
122 Bayview Ave, Northport, NY 11768
$-3,042
Cash flow
-15.1%
Cash-on-Cash Return
2.6%
Cap rate
0.5%
Rent to Value Ratio
Active
$699,000
4
bds
|
3
ba
|
1,778
sqft
|
built
2002
289 Carleton Dr E, Shirley, NY 11967
$-1,620
Cash flow
-12.1%
Cash-on-Cash Return
3.3%
Cap rate
0.6%
Rent to Value Ratio
Active
$674,987
3
bds
|
2
ba
|
2,000
sqft
|
built
1998
72 Oak Ave, Flanders, NY 11901
$-945
Cash flow
-7.3%
Cash-on-Cash Return
4.4%
Cap rate
0.6%
Rent to Value Ratio
Active
$599,996
3
bds
|
2
ba
|
1,225
sqft
|
built
2001
77 Friendship Dr, Rocky Point, NY 11778
$-1,514
Cash flow
-13.2%
Cash-on-Cash Return
3.0%
Cap rate
0.6%
Rent to Value Ratio
Active
$2,700,000
5
bds
|
5
ba
|
4,200
sqft
|
built
1974
21 Waterview Dr, Port Jefferson, NY 11777
$-13,643
Cash flow
-26.4%
Cash-on-Cash Return
0.0%
Cap rate
0.1%
Rent to Value Ratio
Active
$839,000
3
bds
|
3
ba
|
2,612
sqft
|
built
2000
7 Oliver St, Port Jefferson Station, NY 11776
$-2,775
Cash flow
-17.3%
Cash-on-Cash Return
2.1%
Cap rate
0.5%
Rent to Value Ratio
Active
$749,000
3
bds
|
2
ba
|
2,029
sqft
|
built
1961
10 13th Ave, West Babylon, NY 11704
$-3,349
Cash flow
-23.3%
Cash-on-Cash Return
0.7%
Cap rate
0.4%
Rent to Value Ratio
Active
$5,495,000
4
bds
|
5
ba
|
2,650
sqft
|
built
2024
27 Howard St, Sag Harbor, NY 11963
$-21,452
Cash flow
-20.4%
Cash-on-Cash Return
1.4%
Cap rate
0.2%
Rent to Value Ratio
Active
$959,000
2
bds
|
1
ba
|
68,825
sqft
|
built
1957
1 Ashland Dr, Huntington, NY 11743
$-2,409
Cash flow
-13.1%
Cash-on-Cash Return
3.1%
Cap rate
0.5%
Rent to Value Ratio
Active
$8,995,000
5
bds
|
8
ba
|
6,200
sqft
|
built
2013
32 Neck Path, East Hampton, NY 11937
$-42,046
Cash flow
-24.4%
Cash-on-Cash Return
0.5%
Cap rate
0.1%
Rent to Value Ratio
Active
$1,249,000
3
bds
|
2
ba
|
2,000
sqft
|
built
1963
230 Sequams Lane Ctr, West Islip, NY 11795
$-3,453
Cash flow
-14.4%
Cash-on-Cash Return
2.8%
Cap rate
0.5%
Rent to Value Ratio
Active
$699,998
4
bds
|
2
ba
|
1,852
sqft
|
built
1975
2 Alan St, Holbrook, NY 11741
$-1,664
Cash flow
-12.4%
Cash-on-Cash Return
3.2%
Cap rate
0.6%
Rent to Value Ratio
Active
$599,000
3
bds
|
2
ba
|
1,500
sqft
|
built
1970
1 Dillon Ave, Port Jefferson Station, NY 11776
$-1,485
Cash flow
-12.9%
Cash-on-Cash Return
3.1%
Cap rate
0.6%
Rent to Value Ratio