Worcester County Investment Properties for Sale
Browse homes for sale and investment properties in Worcester County. Refine your search by price, property type, or more.
Best cash flowing properties in Worcester County
Active
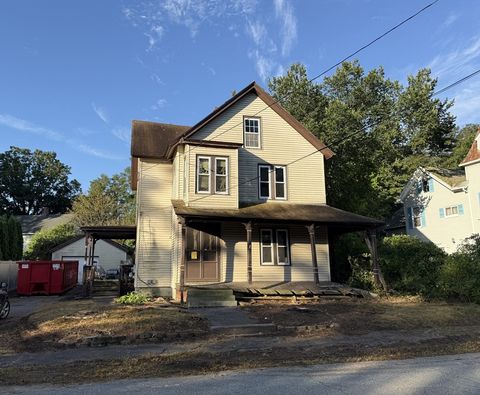
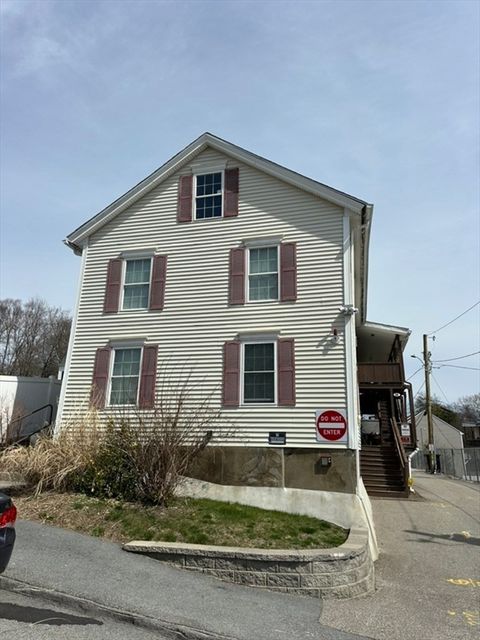
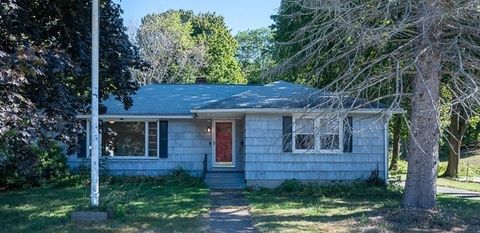
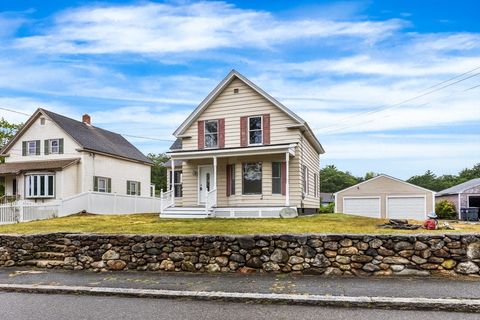
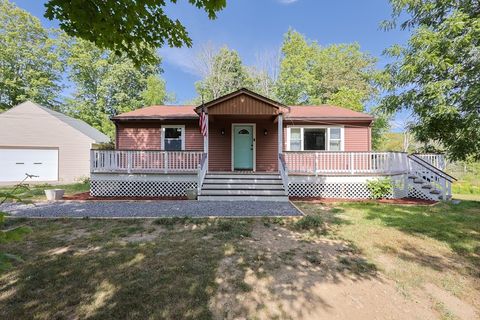
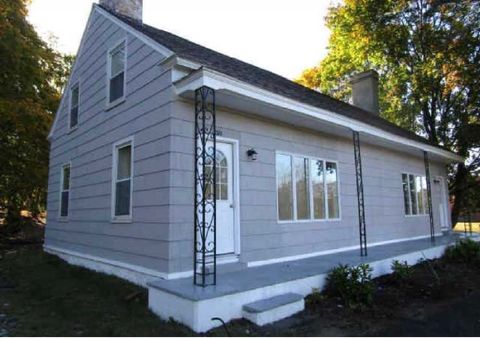
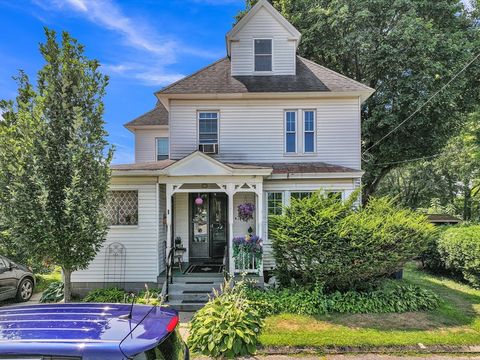
$189,900
5
bds
|
2
ba
|
1,746
sqft
|
built
1882
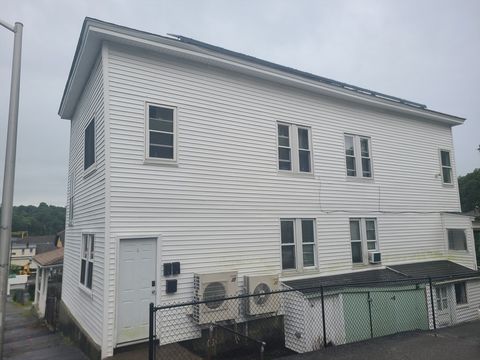
38 Elm St, Warren, MA 01083
$703
Cash flow
19.3%
Cash-on-Cash Return
10.1%
Cap rate
1.4%
Rent to Value Ratio
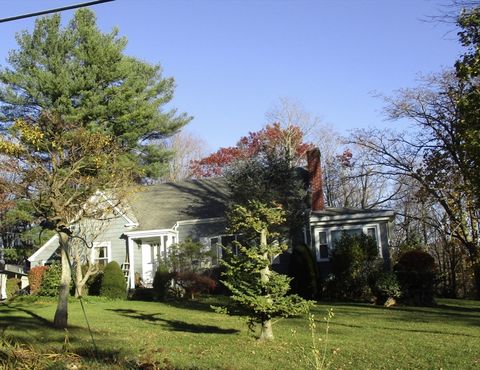
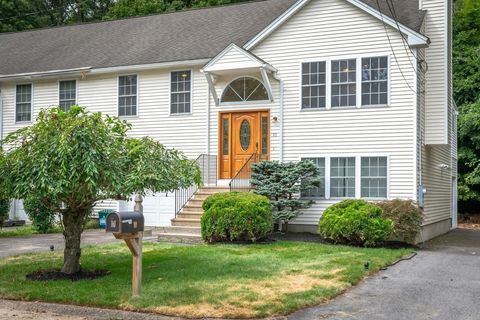
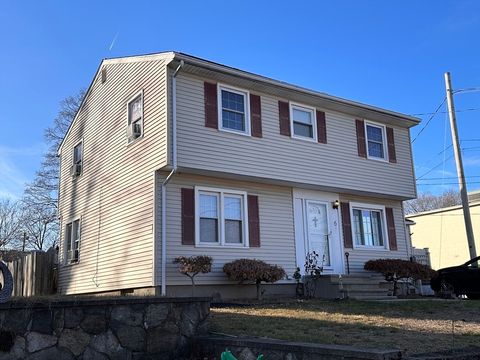
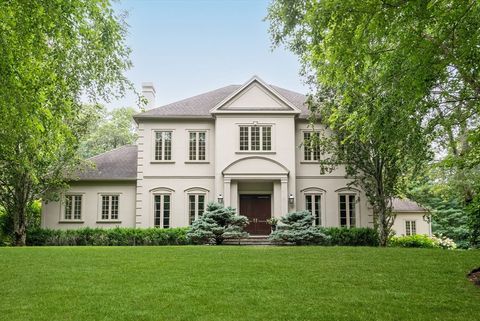
Active
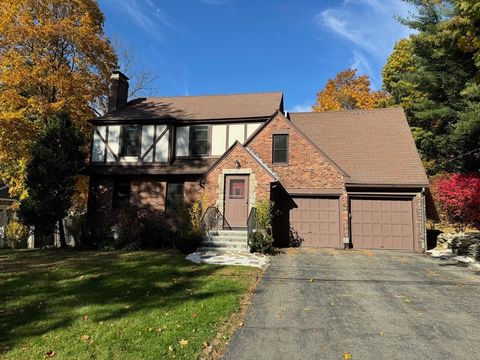
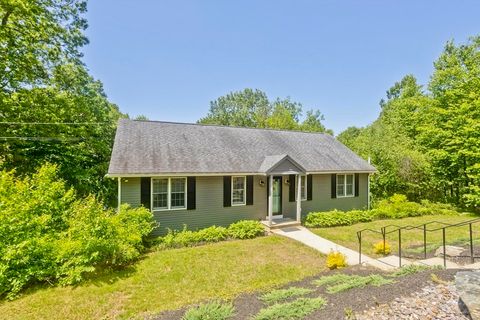
$339,900
3
bds
|
2
ba
|
1,824
sqft
|
built
1941
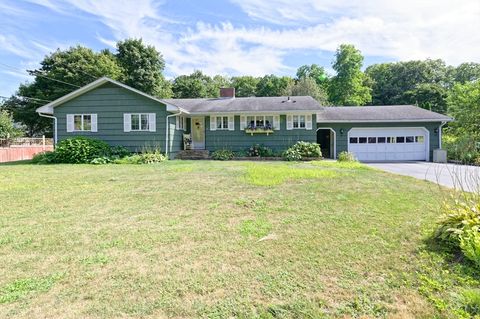
264 Brattle St, Holden, MA 01520
$115
Cash flow
1.8%
Cash-on-Cash Return
6.1%
Cap rate
0.9%
Rent to Value Ratio
521 out of 754 properties for sale in Worcester County
Limited Results Shown
Create a free account, or log in to reveal all property listings and enjoy the complete experience.

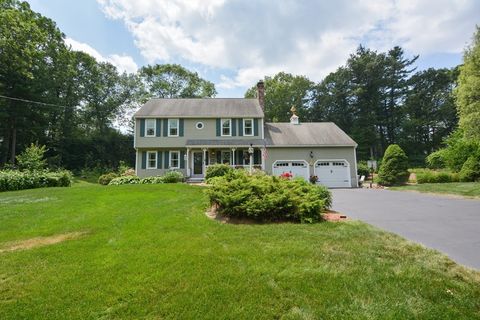
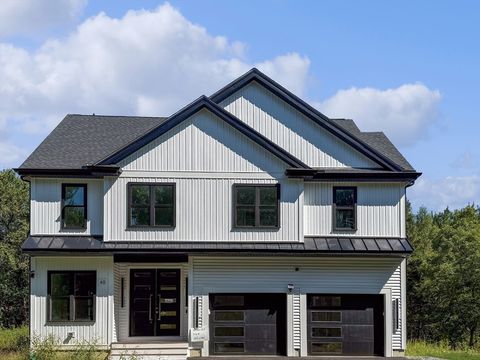
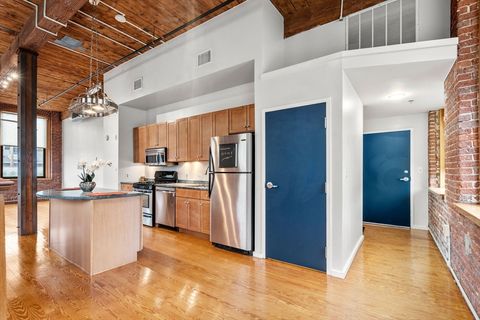
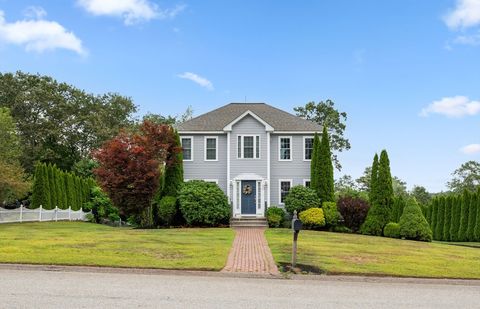
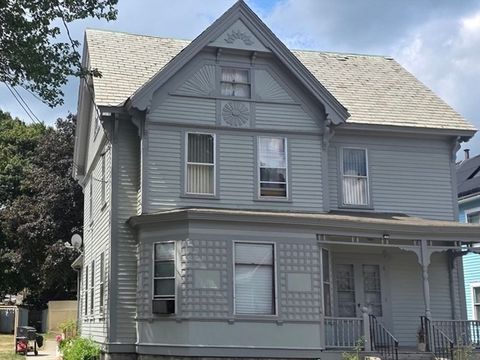
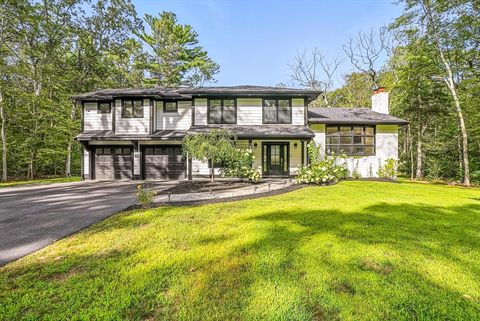
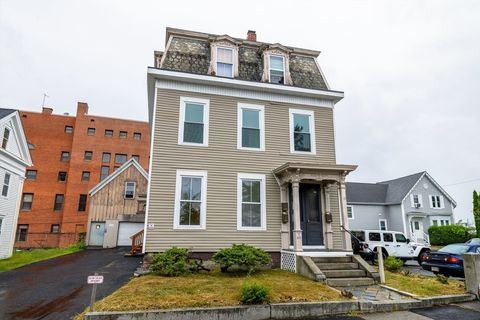
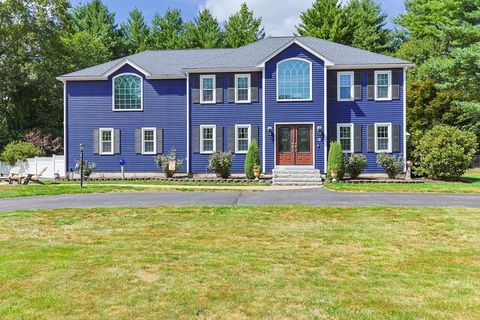
Active
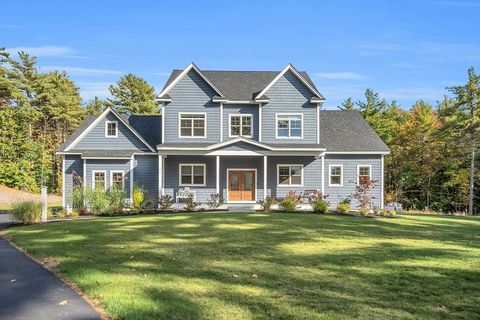
$715,000
3
bds
|
4
ba
|
2,165
sqft
|
built
2025
20 Wachusett Dr, Westminster, MA 01473
$-1,246
Cash flow
-9.1%
Cash-on-Cash Return
3.6%
Cap rate
0.5%
Rent to Value Ratio
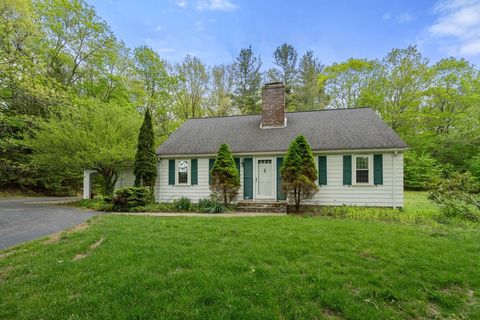
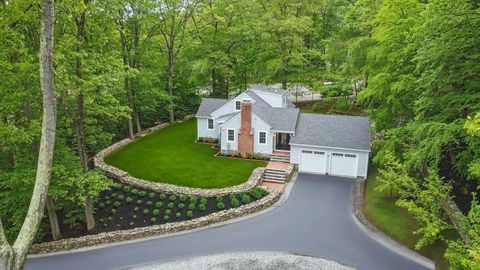
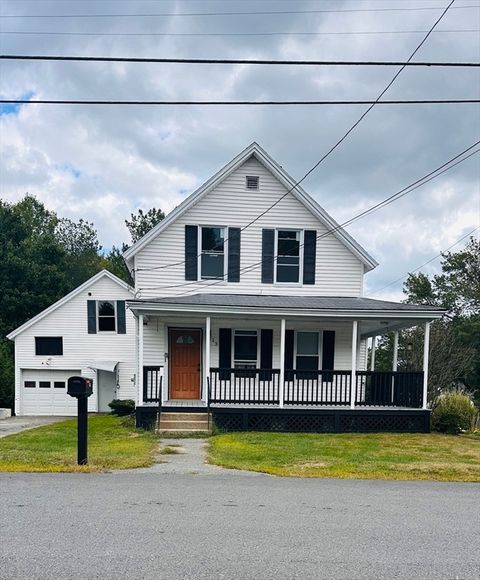
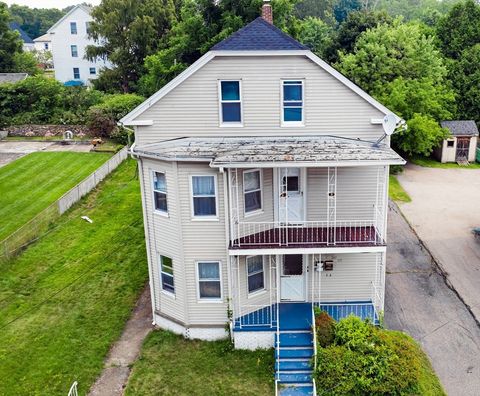
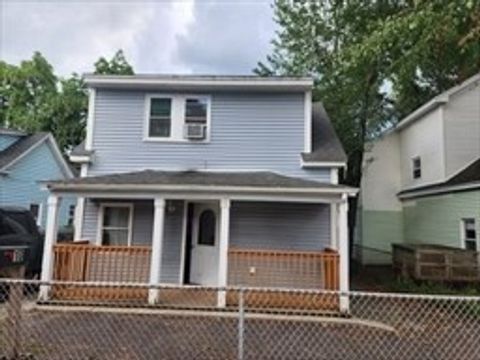
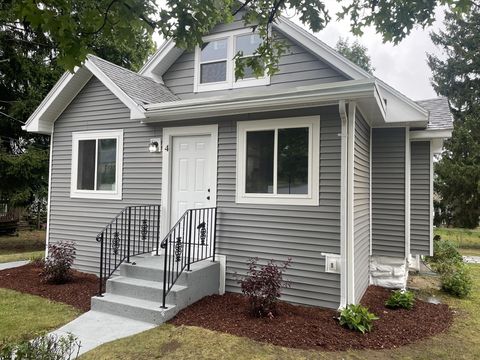
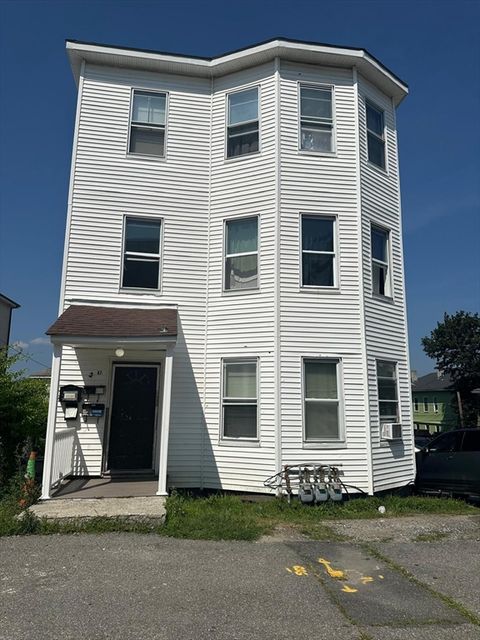
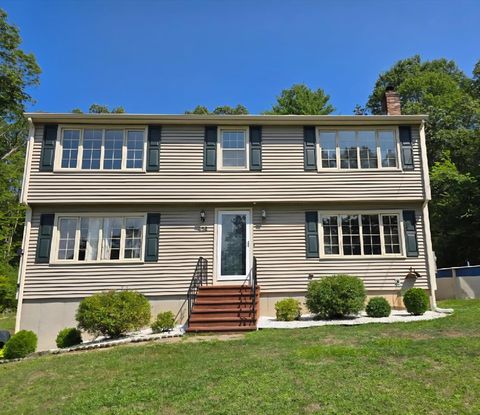
Active
$687,900
3
bds
|
2
ba
|
2,581
sqft
|
built
1989
2 Crestview Dr, Mendon, MA 01756
$-1,419
Cash flow
-10.8%
Cash-on-Cash Return
3.2%
Cap rate
0.5%
Rent to Value Ratio
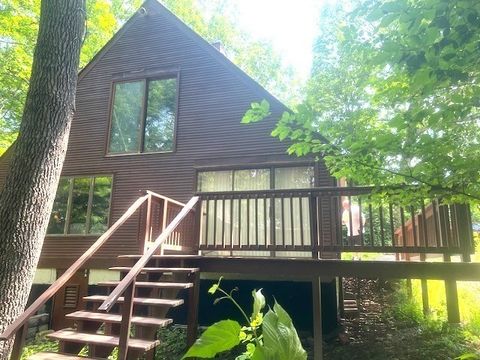
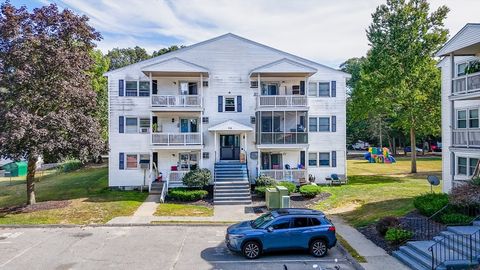
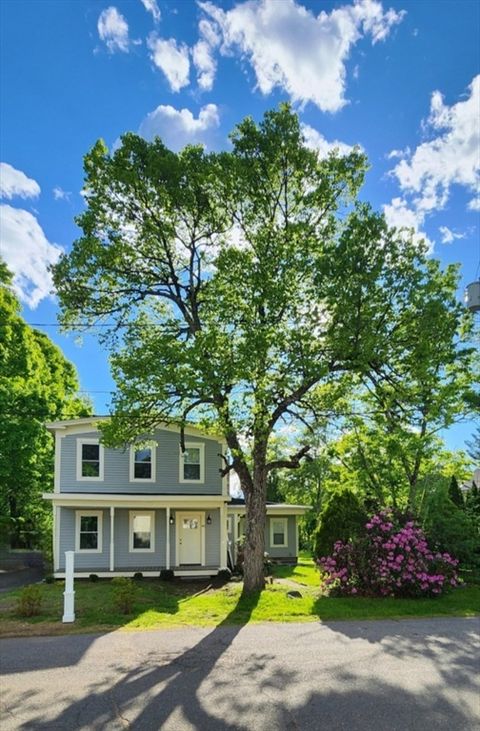
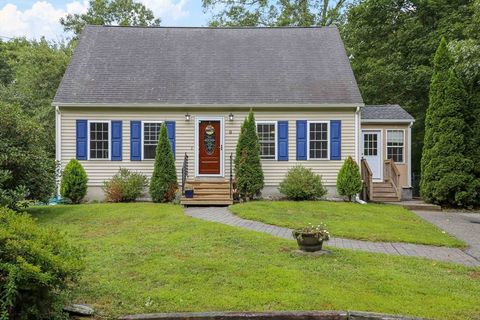
Active
$499,900
3
bds
|
2
ba
|
1,520
sqft
|
built
1958
35 Chapin Rd, Holden, MA 01520
$-560
Cash flow
-5.8%
Cash-on-Cash Return
4.3%
Cap rate
0.7%
Rent to Value Ratio
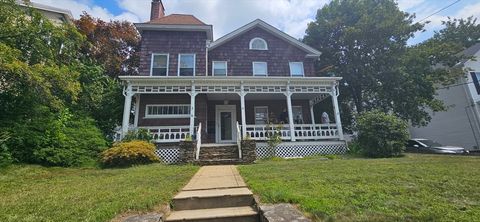
Active
$2,500,000
28
bds
|
12
ba
|
8,228
sqft
|
built
1905
6 Milton St, Worcester, MA 01605
$-12,101
Cash flow
-25.3%
Cash-on-Cash Return
-0.1%
Cap rate
0.1%
Rent to Value Ratio
Active
$1,350,000
4
bds
|
4
ba
|
4,000
sqft
|
built
2025
40 High St, Shrewsbury, MA 01545
$-3,406
Cash flow
-13.2%
Cash-on-Cash Return
2.7%
Cap rate
0.4%
Rent to Value Ratio
Active
$899,000
5
bds
|
3
ba
|
3,400
sqft
|
built
1949
315 Maple Ave, Shrewsbury, MA 01545
$-2,114
Cash flow
-12.3%
Cash-on-Cash Return
2.9%
Cap rate
0.4%
Rent to Value Ratio
Active
$650,000
2
bds
|
2
ba
|
1,800
sqft
|
built
1985
871 Pleasant St, Leominster, MA 01453
$-1,360
Cash flow
-10.9%
Cash-on-Cash Return
3.2%
Cap rate
0.5%
Rent to Value Ratio
Active
$385,000
3
bds
|
2
ba
|
1,420
sqft
|
built
1953
12 Pearl St, Gardner, MA 01440
$-286
Cash flow
-3.9%
Cash-on-Cash Return
4.8%
Cap rate
0.7%
Rent to Value Ratio
Active
$549,900
3
bds
|
2
ba
|
1,570
sqft
|
built
2002
10 Joppa Rd, Worcester, MA 01602
$-1,101
Cash flow
-10.4%
Cash-on-Cash Return
3.3%
Cap rate
0.5%
Rent to Value Ratio
Active
$405,000
2
bds
|
2
ba
|
1,234
sqft
|
built
1889
1 Envelope Ter, Worcester, MA 01604
$-1,022
Cash flow
-13.2%
Cash-on-Cash Return
2.7%
Cap rate
0.6%
Rent to Value Ratio
Active
$375,000
3
bds
|
2
ba
|
1,567
sqft
|
built
1900
13 Woodlawn St, Winchendon, MA 01475
$-481
Cash flow
-6.7%
Cash-on-Cash Return
4.1%
Cap rate
0.6%
Rent to Value Ratio
Active
$425,000
3
bds
|
2
ba
|
1,560
sqft
|
built
1960
6 Hillside Ave, Webster, MA 01570
$-507
Cash flow
-6.2%
Cash-on-Cash Return
4.2%
Cap rate
0.6%
Rent to Value Ratio
Active
$574,900
3
bds
|
3
ba
|
1,644
sqft
|
built
2010
40 Brunelle Dr, Rutland, MA 01543
$-879
Cash flow
-8.0%
Cash-on-Cash Return
3.8%
Cap rate
0.6%
Rent to Value Ratio
Active
$500,000
6
bds
|
3
ba
|
2,264
sqft
|
built
1900
29 Whitcomb St, Webster, MA 01570
$-950
Cash flow
-9.9%
Cash-on-Cash Return
3.4%
Cap rate
0.5%
Rent to Value Ratio
Active
$245,000
2
bds
|
1
ba
|
728
sqft
|
built
1988
30 Abbey Rd, Leominster, MA 01453
$-419
Cash flow
-8.9%
Cash-on-Cash Return
3.6%
Cap rate
0.7%
Rent to Value Ratio
Active
$309,900
4
bds
|
2
ba
|
1,526
sqft
|
built
1900
159 Lake Ellis Rd, Athol, MA 01331
$-24
Cash flow
-0.4%
Cash-on-Cash Return
5.6%
Cap rate
0.8%
Rent to Value Ratio
Active
$449,000
5
bds
|
2
ba
|
2,179
sqft
|
built
1900
85 Boutelle St, Fitchburg, MA 01420
$-609
Cash flow
-7.1%
Cash-on-Cash Return
4.1%
Cap rate
0.6%
Rent to Value Ratio
Active
$349,900
3
bds
|
2
ba
|
1,201
sqft
|
built
1900
10 Douglas Ct, Worcester, MA 01603
$-179
Cash flow
-2.7%
Cash-on-Cash Return
5.1%
Cap rate
0.7%
Rent to Value Ratio
Active
$460,000
4
bds
|
4
ba
|
2,770
sqft
|
built
1900
46 Austin St, Barre, MA 01005
$-595
Cash flow
-6.7%
Cash-on-Cash Return
4.1%
Cap rate
0.6%
Rent to Value Ratio
Active
$399,900
3
bds
|
1
ba
|
1,421
sqft
|
built
1950
20 Carleton Rd, Rochdale, MA 01542
$-399
Cash flow
-5.2%
Cash-on-Cash Return
4.5%
Cap rate
0.7%
Rent to Value Ratio
Active
$380,000
2
bds
|
1
ba
|
1,120
sqft
|
built
1975
74 Breen Rd, Hardwick, MA 01037
$-703
Cash flow
-9.7%
Cash-on-Cash Return
3.5%
Cap rate
0.5%
Rent to Value Ratio
Active
$1,250,000
4
bds
|
4
ba
|
3,548
sqft
|
built
2020
15 Kirali Ct, Westminster, MA 01473
$-2,297
Cash flow
-9.6%
Cash-on-Cash Return
3.5%
Cap rate
0.5%
Rent to Value Ratio
Active
$649,900
4
bds
|
4
ba
|
2,256
sqft
|
built
1939
3 Old English Rd, Worcester, MA 01609
$-674
Cash flow
-5.4%
Cash-on-Cash Return
4.4%
Cap rate
0.7%
Rent to Value Ratio
Active
$425,000
5
bds
|
2
ba
|
2,544
sqft
|
built
1980
150-152 Mill Cir, Winchendon, MA 01475
$-913
Cash flow
-11.2%
Cash-on-Cash Return
3.1%
Cap rate
0.5%
Rent to Value Ratio
Active
$2,595,000
4
bds
|
6
ba
|
5,656
sqft
|
built
2000
6 Witherbee Ln, Southborough, MA 01772
$-10,598
Cash flow
-21.3%
Cash-on-Cash Return
0.8%
Cap rate
0.2%
Rent to Value Ratio
Active
$975,000
4
bds
|
4
ba
|
2,472
sqft
|
built
1968
68 Pearl St, Upton, MA 01568
$-3,217
Cash flow
-17.2%
Cash-on-Cash Return
1.7%
Cap rate
0.3%
Rent to Value Ratio
Active
$499,900
3
bds
|
2
ba
|
1,600
sqft
|
built
1930
4 Blue Bell Rd, Worcester, MA 01606
$-1,314
Cash flow
-13.7%
Cash-on-Cash Return
2.5%
Cap rate
0.4%
Rent to Value Ratio
Active
$499,900
5
bds
|
3
ba
|
2,975
sqft
|
built
1900
176 Merriam Ave, Leominster, MA 01453
$-198
Cash flow
-2.1%
Cash-on-Cash Return
5.2%
Cap rate
0.8%
Rent to Value Ratio
Active
$754,900
3
bds
|
3
ba
|
1,776
sqft
|
built
1997
72 Flaxfield Rd, Dudley, MA 01571
$-1,689
Cash flow
-11.7%
Cash-on-Cash Return
3.0%
Cap rate
0.5%
Rent to Value Ratio
Active
$825,000
8
bds
|
3
ba
|
3,490
sqft
|
built
1856
10 Sycamore St, Worcester, MA 01608
$-2,440
Cash flow
-15.4%
Cash-on-Cash Return
2.1%
Cap rate
0.4%
Rent to Value Ratio
Active
$879,900
9
bds
|
3
ba
|
4,740
sqft
|
built
1900
82 Fox St, Worcester, MA 01604
$-3,357
Cash flow
-19.9%
Cash-on-Cash Return
1.1%
Cap rate
0.3%
Rent to Value Ratio
Active
$989,900
3
bds
|
5
ba
|
3,392
sqft
|
built
1994
19 King Philip Path, Mendon, MA 01756
$-2,263
Cash flow
-11.9%
Cash-on-Cash Return
2.9%
Cap rate
0.5%
Rent to Value Ratio
Active
$439,000
3
bds
|
2
ba
|
1,614
sqft
|
built
1998
9 Center Rd, Dudley, MA 01571
$-685
Cash flow
-8.1%
Cash-on-Cash Return
3.8%
Cap rate
0.6%
Rent to Value Ratio
Active
$599,900
4
bds
|
3
ba
|
1,862
sqft
|
built
1979
436 Blackstone St, Uxbridge, MA 01569
$-863
Cash flow
-7.5%
Cash-on-Cash Return
4.0%
Cap rate
0.6%
Rent to Value Ratio
Active
$439,900
5
bds
|
3
ba
|
3,100
sqft
|
built
1900
91 Everett St, Southbridge, MA 01550
$-657
Cash flow
-7.8%
Cash-on-Cash Return
3.9%
Cap rate
0.6%
Rent to Value Ratio
Active
$539,000
4
bds
|
3
ba
|
1,401
sqft
|
built
1957
9 Banning Dr, Whitinsville, MA 01588
$-934
Cash flow
-9.0%
Cash-on-Cash Return
3.6%
Cap rate
0.5%
Rent to Value Ratio
Active
$595,900
4
bds
|
2
ba
|
1,680
sqft
|
built
1890
37 Adams St, Worcester, MA 01604
$-1,294
Cash flow
-11.3%
Cash-on-Cash Return
3.1%
Cap rate
0.5%
Rent to Value Ratio
Active
$599,900
12
bds
|
3
ba
|
3,709
sqft
|
built
1900
25 Cohasse St, Southbridge, MA 01550
$-1,629
Cash flow
-14.2%
Cash-on-Cash Return
2.4%
Cap rate
0.4%
Rent to Value Ratio