Middlesex County Investment Properties for Sale
Browse homes for sale and investment properties in Middlesex County. Refine your search by price, property type, or more.
Best cash flowing properties in Middlesex County
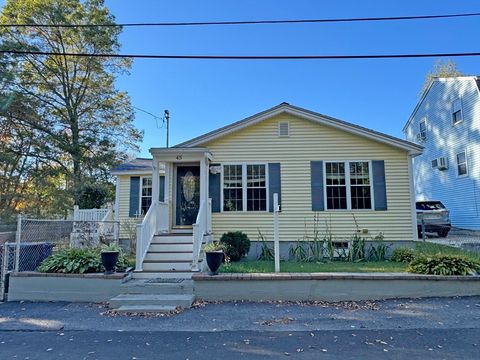
Active
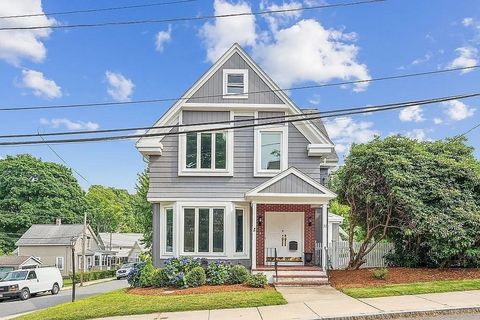
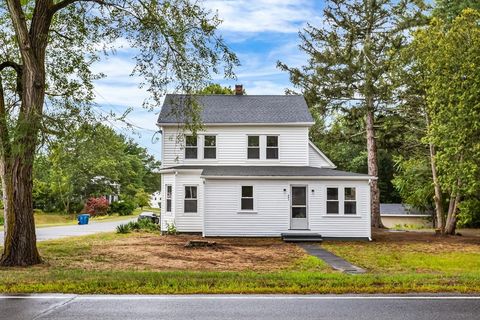
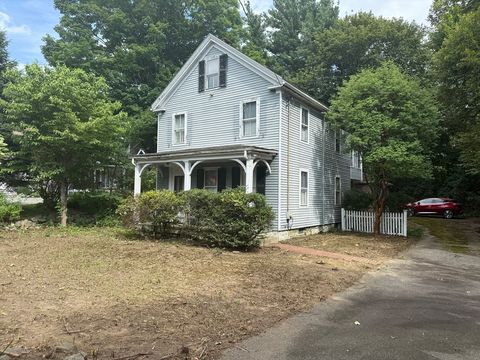
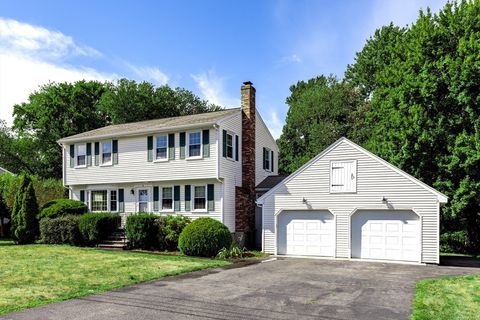
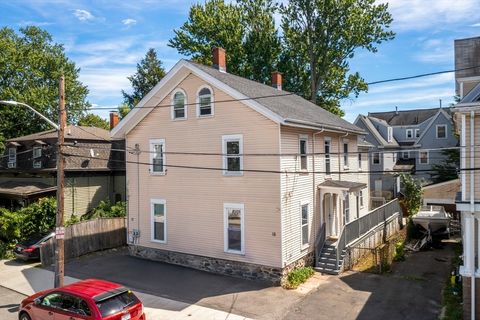
$699,000
4
bds
|
3
ba
|
2,037
sqft
|
built
1905
32 Water St, Marlborough, MA 01752
$-225
Cash flow
-1.7%
Cash-on-Cash Return
5.3%
Cap rate
0.7%
Rent to Value Ratio
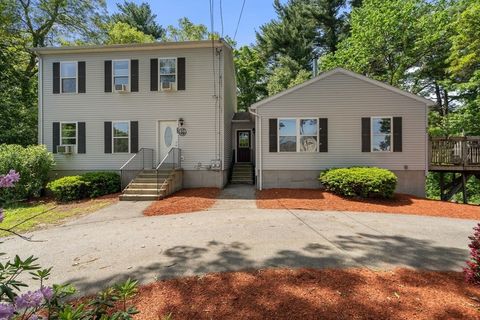
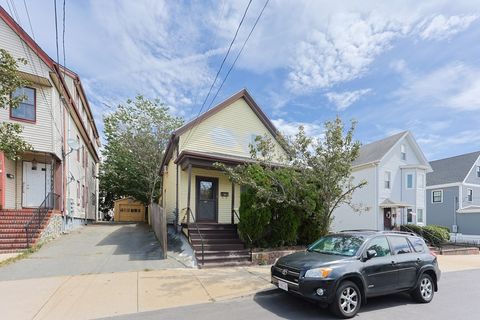
Active
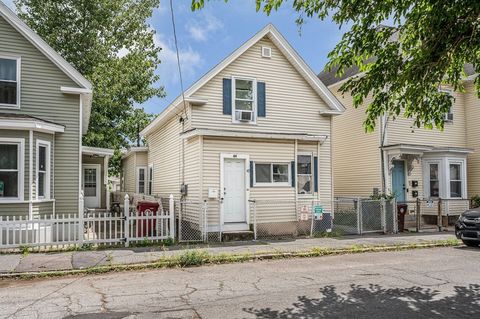
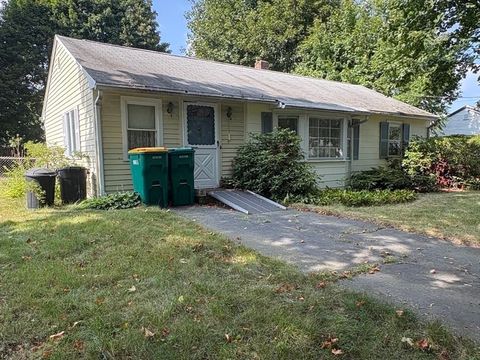
$399,939
3
bds
|
1
ba
|
1,194
sqft
|
built
1900
49 Coburn St, Lowell, MA 01850
$-281
Cash flow
-3.7%
Cash-on-Cash Return
4.8%
Cap rate
0.7%
Rent to Value Ratio
751 out of 1,178 properties for sale in Middlesex County
Limited Results Shown
Create a free account, or log in to reveal all property listings and enjoy the complete experience.

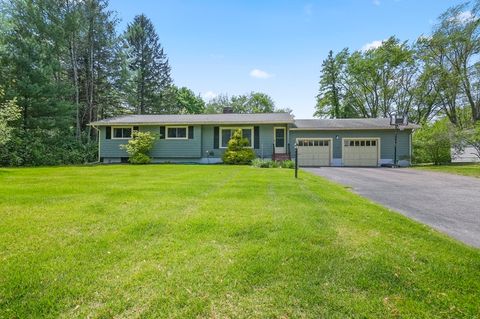
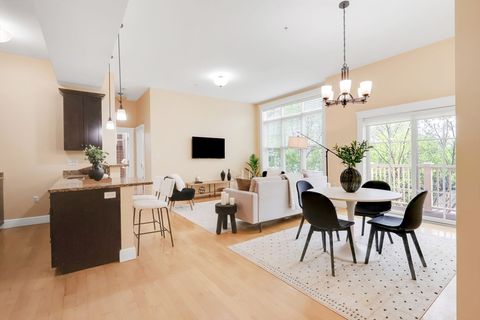
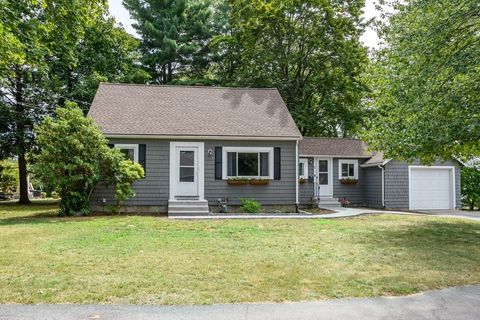
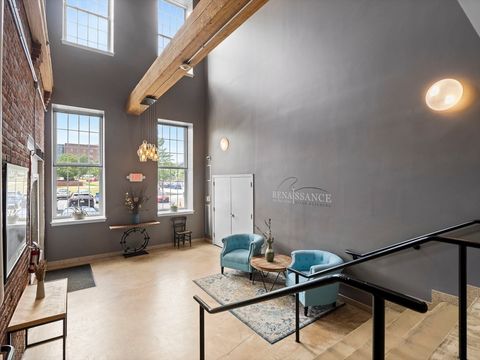
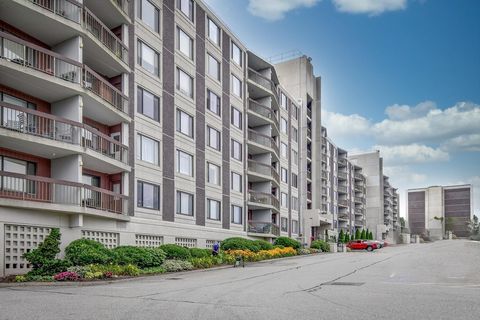
Active
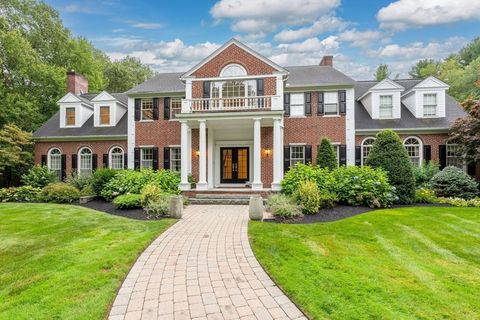
$839,569
4
bds
|
3
ba
|
3,032
sqft
|
built
2022
100 Salem Rd, Dracut, MA 01826
$-1,531
Cash flow
-9.5%
Cash-on-Cash Return
3.5%
Cap rate
0.5%
Rent to Value Ratio

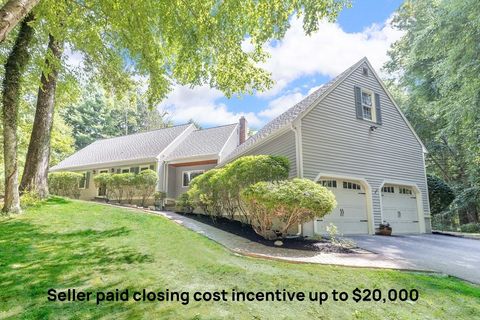
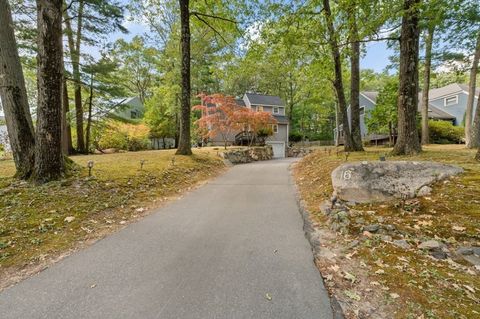
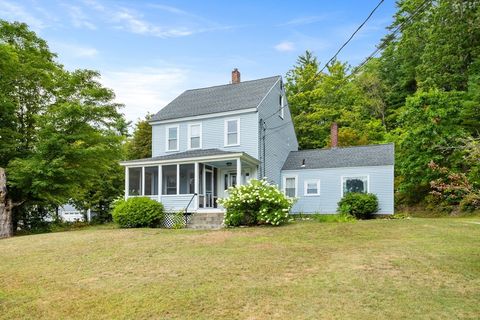
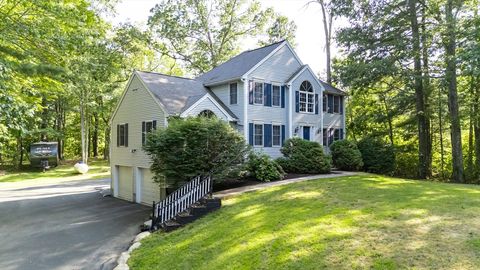
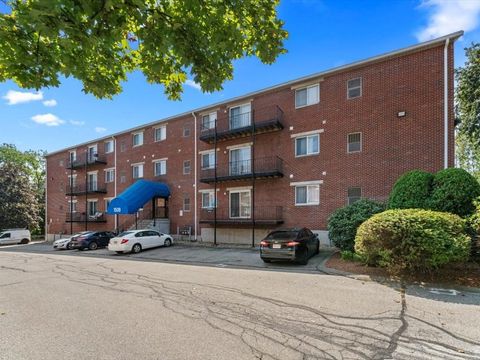
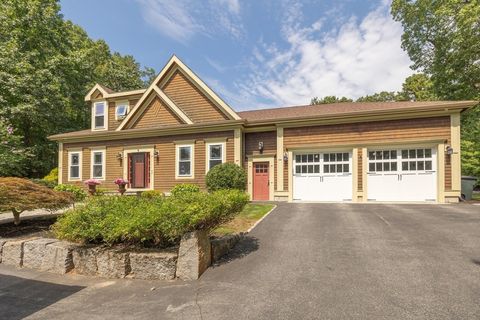
Active
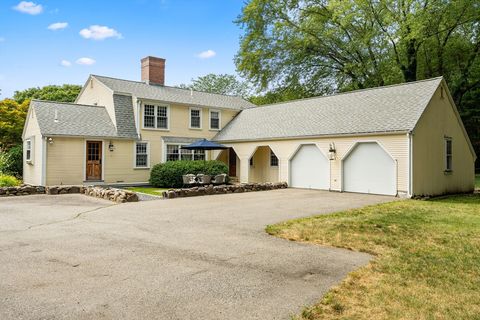
$789,000
4
bds
|
4
ba
|
2,559
sqft
|
built
1983
769 Edgell Rd, Framingham, MA 01701
$-1,340
Cash flow
-8.9%
Cash-on-Cash Return
3.6%
Cap rate
0.6%
Rent to Value Ratio

Active
$599,000
4
bds
|
2
ba
|
1,508
sqft
|
built
1924
3 Highland Park Ave, Hudson, MA 01749
$-598
Cash flow
-5.2%
Cash-on-Cash Return
4.5%
Cap rate
0.7%
Rent to Value Ratio
Active
$800,000
3
bds
|
2
ba
|
1,548
sqft
|
built
1955
35 Snake Brook Rd, Wayland, MA 01778
$-1,712
Cash flow
-11.2%
Cash-on-Cash Return
3.1%
Cap rate
0.5%
Rent to Value Ratio
Active
$1,150,000
4
bds
|
3
ba
|
2,739
sqft
|
built
1985
2 Towne Lyne Rd, Sherborn, MA 01770
$-3,051
Cash flow
-13.8%
Cash-on-Cash Return
2.5%
Cap rate
0.5%
Rent to Value Ratio

Active
$4,299,000
6
bds
|
9
ba
|
8,584
sqft
|
built
2015
42 Sunhill Ln, Newton, MA 02459
$-17,656
Cash flow
-21.4%
Cash-on-Cash Return
0.8%
Cap rate
0.2%
Rent to Value Ratio
Active
$469,900
2
bds
|
2
ba
|
986
sqft
|
built
1936
45 Hoover St, Dracut, MA 01826
$-791
Cash flow
-8.8%
Cash-on-Cash Return
3.7%
Cap rate
0.5%
Rent to Value Ratio
Active
$839,000
5
bds
|
4
ba
|
3,629
sqft
|
built
2002
43 Outlook Rd, North Billerica, MA 01862
$-1,580
Cash flow
-9.8%
Cash-on-Cash Return
3.4%
Cap rate
0.5%
Rent to Value Ratio
Active
$899,000
2
bds
|
2
ba
|
1,110
sqft
|
built
2011
61 Bolton St, Cambridge, MA 02140
$-2,050
Cash flow
-11.9%
Cash-on-Cash Return
2.9%
Cap rate
0.5%
Rent to Value Ratio
Active
$739,000
3
bds
|
2
ba
|
2,097
sqft
|
built
1984
16 Sherborne Cir, Ashland, MA 01721
$-1,381
Cash flow
-9.7%
Cash-on-Cash Return
3.4%
Cap rate
0.6%
Rent to Value Ratio

Active
$1,125,000
4
bds
|
3
ba
|
3,468
sqft
|
built
2004
18 Baldwin Rd, Billerica, MA 01821
$-2,340
Cash flow
-10.9%
Cash-on-Cash Return
3.2%
Cap rate
0.5%
Rent to Value Ratio
Active
$825,450
3
bds
|
3
ba
|
1,786
sqft
|
built
1878
56 Grove Ave, Wilmington, MA 01887
$-2,252
Cash flow
-14.2%
Cash-on-Cash Return
2.4%
Cap rate
0.4%
Rent to Value Ratio
Active
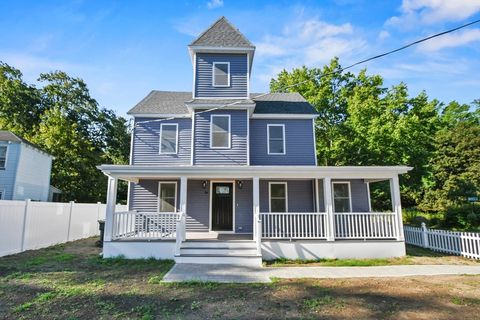
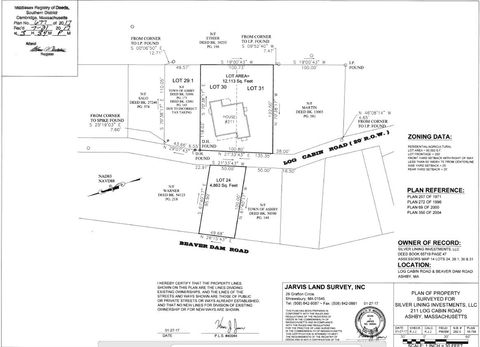
$599,000
3
bds
|
3
ba
|
3,232
sqft
|
built
2003
211 Log Cabin Rd, Ashby, MA 01431
$-832
Cash flow
-7.2%
Cash-on-Cash Return
4.0%
Cap rate
0.7%
Rent to Value Ratio
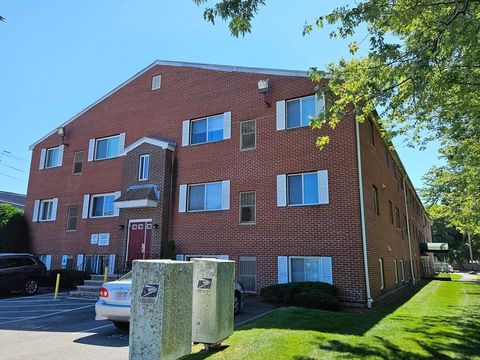
Active
$299,900
1
bds
|
1
ba
|
630
sqft
|
built
1987
35 Prospect St, Woburn, MA 01801
$-414
Cash flow
-7.2%
Cash-on-Cash Return
4.0%
Cap rate
0.7%
Rent to Value Ratio
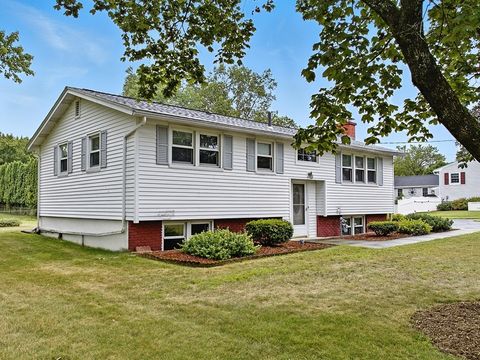
Active
$599,900
3
bds
|
1
ba
|
1,611
sqft
|
built
1963
12 Wellington Dr, Hudson, MA 01749
$-1,228
Cash flow
-10.7%
Cash-on-Cash Return
3.2%
Cap rate
0.5%
Rent to Value Ratio
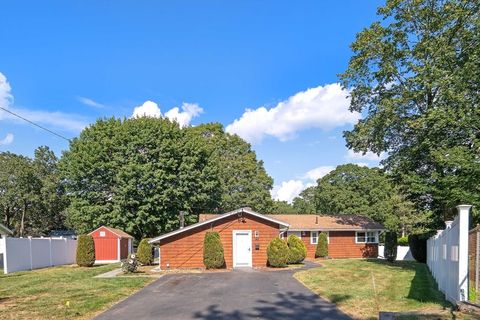
Active
$649,900
4
bds
|
2
ba
|
1,813
sqft
|
built
1930
177 Salem Rd, Tewksbury, MA 01876
$-1,596
Cash flow
-12.8%
Cash-on-Cash Return
2.7%
Cap rate
0.4%
Rent to Value Ratio
Active
$449,900
2
bds
|
1
ba
|
1,005
sqft
|
built
1947
8 Boyd Rd, Woburn, MA 01801
$-561
Cash flow
-6.5%
Cash-on-Cash Return
4.2%
Cap rate
0.6%
Rent to Value Ratio
Active
$3,199,999
6
bds
|
7
ba
|
7,289
sqft
|
built
1986
40 Grandview Rd, Chelmsford, MA 01824
$-11,160
Cash flow
-18.2%
Cash-on-Cash Return
1.5%
Cap rate
0.3%
Rent to Value Ratio
Active
$1,349,000
4
bds
|
3
ba
|
3,165
sqft
|
built
1989
84 Hopestill Brown Rd, Sudbury, MA 01776
$-4,469
Cash flow
-17.3%
Cash-on-Cash Return
1.7%
Cap rate
0.4%
Rent to Value Ratio
Active
$1,175,000
5
bds
|
3
ba
|
2,900
sqft
|
built
1955
47 Fairbank Rd, Sudbury, MA 01776
$-2,947
Cash flow
-13.1%
Cash-on-Cash Return
2.7%
Cap rate
0.5%
Rent to Value Ratio
Active
$3,000,000
4
bds
|
3
ba
|
2,148
sqft
|
built
1864
25 Maple St, Lexington, MA 02420
$-11,227
Cash flow
-19.5%
Cash-on-Cash Return
1.2%
Cap rate
0.2%
Rent to Value Ratio
Active
$839,000
4
bds
|
2
ba
|
1,452
sqft
|
built
1953
7 Ferndale Rd, Natick, MA 01760
$-1,873
Cash flow
-11.6%
Cash-on-Cash Return
3.0%
Cap rate
0.5%
Rent to Value Ratio
Active
$545,000
3
bds
|
2
ba
|
1,722
sqft
|
built
1900
20 Park Dr, Groton, MA 01450
$-1,357
Cash flow
-13.0%
Cash-on-Cash Return
2.7%
Cap rate
0.5%
Rent to Value Ratio
Active
$449,900
2
bds
|
2
ba
|
1,238
sqft
|
built
2005
527 Pawtucket Blvd, Lowell, MA 01854
$-1,184
Cash flow
-13.7%
Cash-on-Cash Return
2.5%
Cap rate
0.6%
Rent to Value Ratio
Active
$599,900
3
bds
|
2
ba
|
1,547
sqft
|
built
1957
40 Eden Rd, Framingham, MA 01702
$-830
Cash flow
-7.2%
Cash-on-Cash Return
4.0%
Cap rate
0.6%
Rent to Value Ratio
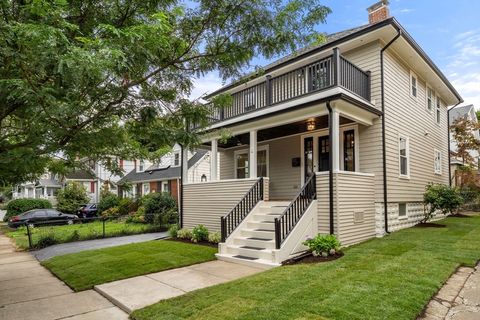
Active
$1,275,000
3
bds
|
3
ba
|
1,536
sqft
|
built
1919
221 Highland Ave, Arlington, MA 02476
$-4,615
Cash flow
-18.9%
Cash-on-Cash Return
1.3%
Cap rate
0.3%
Rent to Value Ratio
Active
$799,900
3
bds
|
3
ba
|
2,528
sqft
|
built
1999
460 Methuen Rd, Dracut, MA 01826
$-1,674
Cash flow
-10.9%
Cash-on-Cash Return
3.2%
Cap rate
0.5%
Rent to Value Ratio
Active
$879,000
4
bds
|
2
ba
|
2,100
sqft
|
built
1980
20 Barbara Cir, Woburn, MA 01801
$-1,956
Cash flow
-11.6%
Cash-on-Cash Return
3.0%
Cap rate
0.5%
Rent to Value Ratio
Active
$595,000
2
bds
|
2
ba
|
1,269
sqft
|
built
1880
59 Clinton St, Everett, MA 02149
$-1,056
Cash flow
-9.3%
Cash-on-Cash Return
3.5%
Cap rate
0.6%
Rent to Value Ratio
Active
$309,000
1
bds
|
1
ba
|
1,013
sqft
|
built
1890
35 Riverwalk Way, Lowell, MA 01854
$-378
Cash flow
-6.4%
Cash-on-Cash Return
4.2%
Cap rate
0.6%
Rent to Value Ratio
Active
$315,000
2
bds
|
2
ba
|
1,019
sqft
|
built
1986
1508 Gorham St, Lowell, MA 01852
$-714
Cash flow
-11.8%
Cash-on-Cash Return
3.0%
Cap rate
0.7%
Rent to Value Ratio
Active
$1,099,900
6
bds
|
4
ba
|
3,486
sqft
|
built
1880
15-17 Barrett St, Malden, MA 02148
$-3,830
Cash flow
-18.2%
Cash-on-Cash Return
1.5%
Cap rate
0.3%
Rent to Value Ratio
Active
$329,000
2
bds
|
1
ba
|
959
sqft
|
built
1948
3 Nashua Rd, Pepperell, MA 01463
$-538
Cash flow
-8.5%
Cash-on-Cash Return
3.7%
Cap rate
0.6%
Rent to Value Ratio

Active
$499,800
2
bds
|
2
ba
|
1,010
sqft
|
built
1981
159 Main St, Stoneham, MA 02180
$-1,380
Cash flow
-14.4%
Cash-on-Cash Return
2.4%
Cap rate
0.6%
Rent to Value Ratio
Active
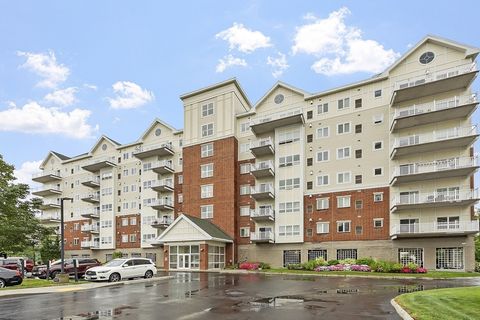
$319,900
1
bds
|
1
ba
|
918
sqft
|
built
1966
1500 Worcester Rd, Framingham, MA 01702
$-764
Cash flow
-12.5%
Cash-on-Cash Return
2.8%
Cap rate
0.7%
Rent to Value Ratio
Active
$1,575,000
5
bds
|
4
ba
|
4,578
sqft
|
built
2014
9 Washington Ave, Woburn, MA 01801
$-2,357
Cash flow
-7.8%
Cash-on-Cash Return
3.9%
Cap rate
0.6%
Rent to Value Ratio
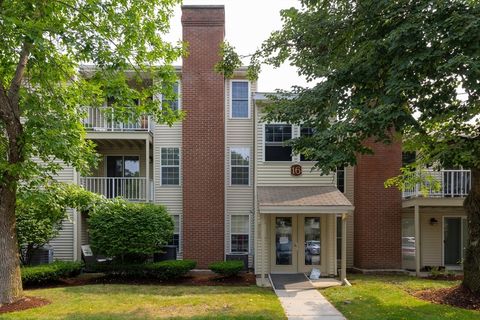
Active
$345,000
1
bds
|
1
ba
|
600
sqft
|
built
1983
16 Walden Dr, Natick, MA 01760
$-889
Cash flow
-13.4%
Cash-on-Cash Return
2.6%
Cap rate
0.6%
Rent to Value Ratio
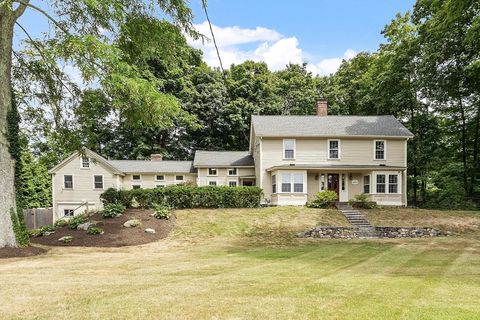
Active
$879,000
3
bds
|
3
ba
|
2,324
sqft
|
built
1880
268 Old Sudbury Rd, Sudbury, MA 01776
$-1,792
Cash flow
-10.6%
Cash-on-Cash Return
3.2%
Cap rate
0.6%
Rent to Value Ratio