Essex County Investment Properties for Sale
Browse homes for sale and investment properties in Essex County. Refine your search by price, property type, or more.
Best cash flowing properties in Essex County
Active
$272,146
2
bds
|
2
ba
|
1,130
sqft
|
built
2004
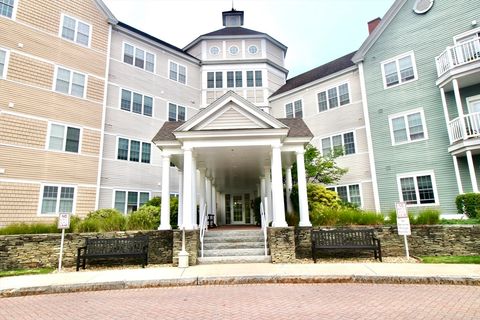
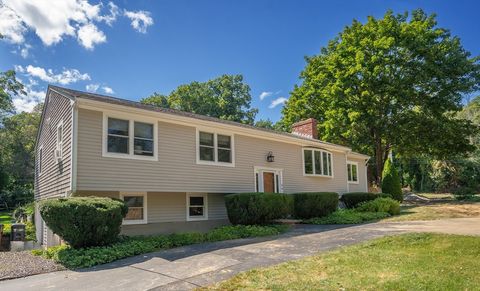
6 Woodman Way, Newburyport, MA 01950
$86
Cash flow
1.6%
Cash-on-Cash Return
6.1%
Cap rate
1.0%
Rent to Value Ratio
Active
$424,900
4
bds
|
2
ba
|
1,067
sqft
|
built
1900
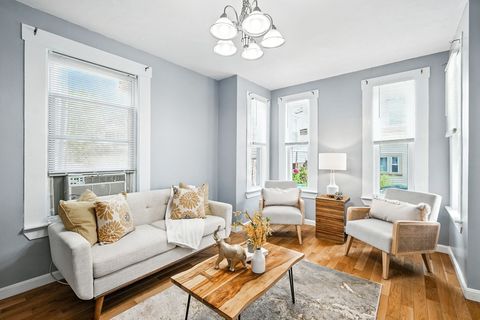
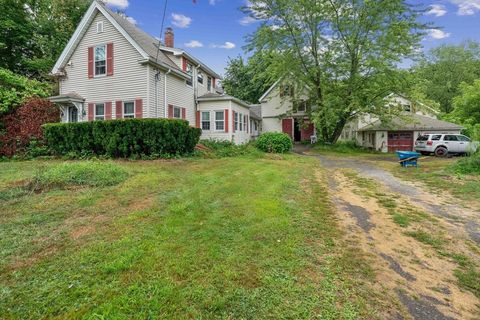
6 Williams Pl, Lynn, MA 01902
$4
Cash flow
0.0%
Cash-on-Cash Return
5.7%
Cap rate
0.8%
Rent to Value Ratio
402 out of 578 properties for sale in Essex County
Limited Results Shown
Create a free account, or log in to reveal all property listings and enjoy the complete experience.
Active
$599,900
3
bds
|
2
ba
|
1,288
sqft
|
built
1941
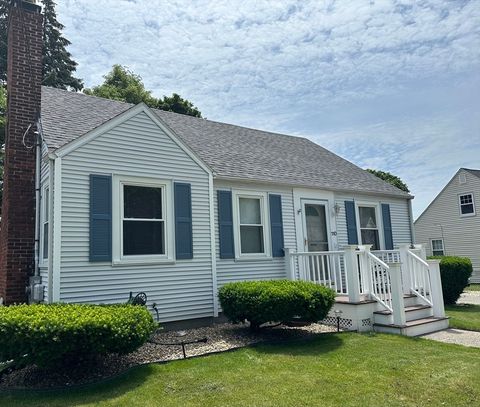
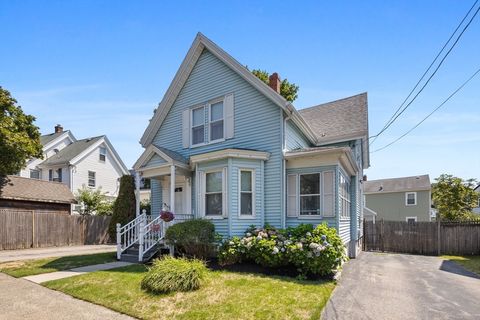
110 Holyoke St, Lynn, MA 01905
$-1,135
Cash flow
-9.9%
Cash-on-Cash Return
3.4%
Cap rate
0.5%
Rent to Value Ratio

Active
$819,000
5
bds
|
3
ba
|
2,817
sqft
|
built
1928
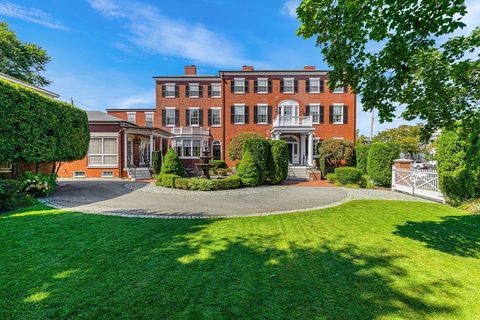
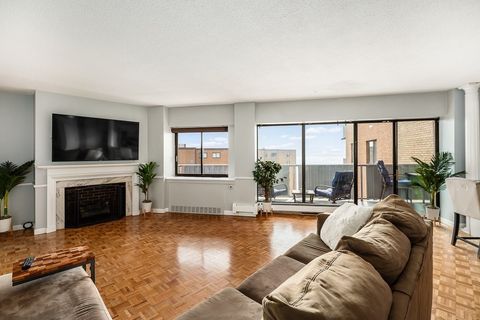
42 Basset St, Lynn, MA 01902
$-1,020
Cash flow
-6.5%
Cash-on-Cash Return
4.2%
Cap rate
0.6%
Rent to Value Ratio

Active
$2,650,000
5
bds
|
4
ba
|
2,736
sqft
|
built
1900
4 Ballast Ln, Marblehead, MA 01945
$-9,322
Cash flow
-18.4%
Cash-on-Cash Return
1.5%
Cap rate
0.2%
Rent to Value Ratio
Active
$2,600,000
5
bds
|
7
ba
|
6,897
sqft
|
built
1811
26 Winter St, Salem, MA 01970
$-13,096
Cash flow
-26.3%
Cash-on-Cash Return
-0.4%
Cap rate
0.1%
Rent to Value Ratio
Active
$619,900
4
bds
|
2
ba
|
1,818
sqft
|
built
1970
29 Glenwood Dr, Lawrence, MA 01843
$-834
Cash flow
-7.0%
Cash-on-Cash Return
4.1%
Cap rate
0.6%
Rent to Value Ratio
Active
$440,000
2
bds
|
2
ba
|
1,143
sqft
|
built
1973
1006 Paradise Rd, Swampscott, MA 01907
$-935
Cash flow
-11.1%
Cash-on-Cash Return
3.1%
Cap rate
0.7%
Rent to Value Ratio
Active
$475,000
3
bds
|
2
ba
|
1,693
sqft
|
built
1998
1 Riverview Blvd, Methuen, MA 01844
$-589
Cash flow
-6.5%
Cash-on-Cash Return
4.2%
Cap rate
0.6%
Rent to Value Ratio
Active
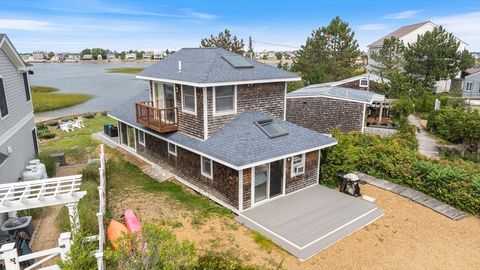
$749,900
2
bds
|
1
ba
|
1,078
sqft
|
built
1983
178 N End Blvd, Salisbury, MA 01952
$-2,535
Cash flow
-17.6%
Cash-on-Cash Return
1.6%
Cap rate
0.4%
Rent to Value Ratio
Active
$364,900
2
bds
|
2
ba
|
929
sqft
|
built
1986
21 Crescent St, Lawrence, MA 01841
$-624
Cash flow
-8.9%
Cash-on-Cash Return
3.6%
Cap rate
0.6%
Rent to Value Ratio
Active
$420,000
2
bds
|
2
ba
|
1,188
sqft
|
built
1988
200 Locust St, Lynn, MA 01904
$-1,006
Cash flow
-12.5%
Cash-on-Cash Return
2.8%
Cap rate
0.6%
Rent to Value Ratio
Active
$329,900
2
bds
|
1
ba
|
884
sqft
|
built
1980
440 North Ave, Haverhill, MA 01830
$-820
Cash flow
-13.0%
Cash-on-Cash Return
2.7%
Cap rate
0.6%
Rent to Value Ratio
Active
$675,000
4
bds
|
2
ba
|
2,080
sqft
|
built
1964
18 Appleby Rd, Salem, MA 01970
$-919
Cash flow
-7.1%
Cash-on-Cash Return
4.0%
Cap rate
0.6%
Rent to Value Ratio
Active
$745,000
3
bds
|
2
ba
|
1,920
sqft
|
built
1967
18 River Rd, Merrimac, MA 01860
$-1,518
Cash flow
-10.6%
Cash-on-Cash Return
3.2%
Cap rate
0.5%
Rent to Value Ratio
Active
$675,000
2
bds
|
2
ba
|
1,460
sqft
|
built
1840
563 N Broadway, Haverhill, MA 01832
$-1,459
Cash flow
-11.3%
Cash-on-Cash Return
3.1%
Cap rate
0.5%
Rent to Value Ratio
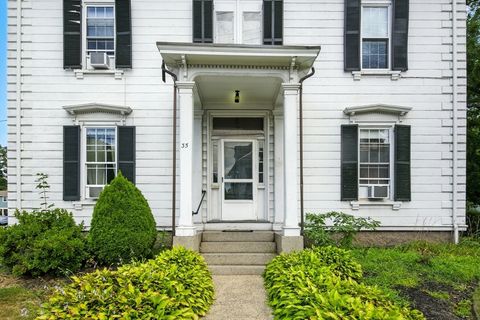
Active
$649,999
3
bds
|
2
ba
|
1,264
sqft
|
built
1900
33 Verona St, Lynn, MA 01904
$-1,023
Cash flow
-8.2%
Cash-on-Cash Return
3.8%
Cap rate
0.6%
Rent to Value Ratio
Active
$475,000
3
bds
|
2
ba
|
1,369
sqft
|
built
1965
300 Lynn Shore Dr, Lynn, MA 01902
$-1,369
Cash flow
-15.0%
Cash-on-Cash Return
2.2%
Cap rate
0.7%
Rent to Value Ratio
Active
$599,900
2
bds
|
2
ba
|
2,139
sqft
|
built
1986
150 Lynnway, Lynn, MA 01902
$-2,393
Cash flow
-20.8%
Cash-on-Cash Return
0.9%
Cap rate
0.5%
Rent to Value Ratio
Active
$1,849,900
6
bds
|
6
ba
|
4,060
sqft
|
built
1992
2 Nollet Dr, Andover, MA 01810
$-6,295
Cash flow
-17.8%
Cash-on-Cash Return
1.6%
Cap rate
0.3%
Rent to Value Ratio

Active
$1,490,000
5
bds
|
5
ba
|
2,693
sqft
|
built
1720
164 Water St, Newburyport, MA 01950
$-4,826
Cash flow
-16.9%
Cash-on-Cash Return
1.8%
Cap rate
0.3%
Rent to Value Ratio
Active
$669,900
4
bds
|
1
ba
|
1,222
sqft
|
built
1955
31 Spring View Dr, Lynn, MA 01904
$-1,203
Cash flow
-9.4%
Cash-on-Cash Return
3.5%
Cap rate
0.5%
Rent to Value Ratio
Active
$1,299,900
3
bds
|
2
ba
|
2,048
sqft
|
built
1850
65 Bromfield St, Newburyport, MA 01950
$-3,856
Cash flow
-15.5%
Cash-on-Cash Return
2.1%
Cap rate
0.4%
Rent to Value Ratio
Active
$999,000
7
bds
|
3
ba
|
3,802
sqft
|
built
1900
447 Boston St, Lynn, MA 01905
$-3,149
Cash flow
-16.4%
Cash-on-Cash Return
1.9%
Cap rate
0.4%
Rent to Value Ratio
Active
$694,500
5
bds
|
3
ba
|
2,304
sqft
|
built
1880
15 Beacon St, Danvers, MA 01923
$-1,040
Cash flow
-7.8%
Cash-on-Cash Return
3.9%
Cap rate
0.6%
Rent to Value Ratio
Active
$549,800
2
bds
|
2
ba
|
2,702
sqft
|
built
1950
64 Durso Ave, Lawrence, MA 01843
$-241
Cash flow
-2.3%
Cash-on-Cash Return
5.2%
Cap rate
0.7%
Rent to Value Ratio
Active
$549,900
2
bds
|
2
ba
|
1,393
sqft
|
built
1989
11 Church St, Salem, MA 01970
$-1,825
Cash flow
-17.3%
Cash-on-Cash Return
1.7%
Cap rate
0.6%
Rent to Value Ratio
Active
$565,000
2
bds
|
2
ba
|
1,500
sqft
|
built
1960
43 Bickford St, Lynn, MA 01904
$-932
Cash flow
-8.6%
Cash-on-Cash Return
3.7%
Cap rate
0.6%
Rent to Value Ratio
Active
$1,395,000
4
bds
|
4
ba
|
3,315
sqft
|
built
1980
4 Wildmeadow Rd, Boxford, MA 01921
$-3,820
Cash flow
-14.3%
Cash-on-Cash Return
2.4%
Cap rate
0.4%
Rent to Value Ratio
Active
$534,900
2
bds
|
1
ba
|
800
sqft
|
built
1912
131 Derby St, Salem, MA 01970
$-1,301
Cash flow
-12.7%
Cash-on-Cash Return
2.8%
Cap rate
0.5%
Rent to Value Ratio
Active
$625,000
3
bds
|
1
ba
|
1,579
sqft
|
built
1903
32 Haviland Ave, Lynn, MA 01902
$-1,056
Cash flow
-8.8%
Cash-on-Cash Return
3.7%
Cap rate
0.6%
Rent to Value Ratio
Active
$459,000
2
bds
|
1
ba
|
750
sqft
|
built
1920
11 Overlook Ave, Gloucester, MA 01930
$-614
Cash flow
-7.0%
Cash-on-Cash Return
4.1%
Cap rate
0.6%
Rent to Value Ratio
Active
$1,199,000
2
bds
|
1
ba
|
992
sqft
|
built
1948
163 Old Point Rd, Newburyport, MA 01950
$-4,337
Cash flow
-18.9%
Cash-on-Cash Return
1.3%
Cap rate
0.2%
Rent to Value Ratio
Active
$575,000
2
bds
|
3
ba
|
1,801
sqft
|
built
2001
201 Central St, Georgetown, MA 01833
$-1,192
Cash flow
-10.8%
Cash-on-Cash Return
3.2%
Cap rate
0.6%
Rent to Value Ratio
Active
$869,900
3
bds
|
3
ba
|
2,956
sqft
|
built
1987
156 Newbury Rd, Rowley, MA 01969
$-1,523
Cash flow
-9.1%
Cash-on-Cash Return
3.6%
Cap rate
0.6%
Rent to Value Ratio
Active
$425,000
3
bds
|
2
ba
|
1,300
sqft
|
built
1967
75 Edgelawn Ave, North Andover, MA 01845
$-811
Cash flow
-10.0%
Cash-on-Cash Return
3.4%
Cap rate
0.7%
Rent to Value Ratio
Active
$350,000
2
bds
|
1
ba
|
855
sqft
|
built
1880
35 Locust St, Danvers, MA 01923
$-704
Cash flow
-10.5%
Cash-on-Cash Return
3.3%
Cap rate
0.7%
Rent to Value Ratio
Active
$549,000
3
bds
|
2
ba
|
1,323
sqft
|
built
1900
81 Middlesex St, Haverhill, MA 01835
$-816
Cash flow
-7.8%
Cash-on-Cash Return
3.9%
Cap rate
0.6%
Rent to Value Ratio

Active
$659,900
2
bds
|
1
ba
|
1,595
sqft
|
built
1940
3 Norman Rd, Saugus, MA 01906
$-1,220
Cash flow
-9.6%
Cash-on-Cash Return
3.5%
Cap rate
0.5%
Rent to Value Ratio
Active
$699,888
4
bds
|
3
ba
|
2,375
sqft
|
built
1969
15 Scenna Rd, Beverly, MA 01915
$-1,157
Cash flow
-8.6%
Cash-on-Cash Return
3.7%
Cap rate
0.6%
Rent to Value Ratio