Norfolk County Investment Properties for Sale
Browse homes for sale and investment properties in Norfolk County. Refine your search by price, property type, or more.
Best cash flowing properties in Norfolk County
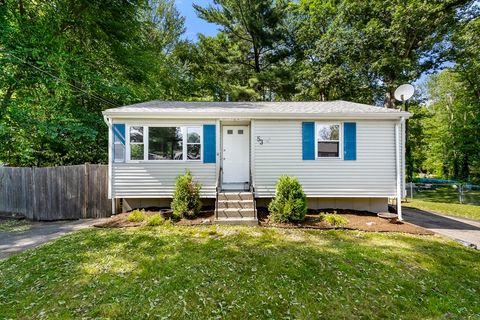
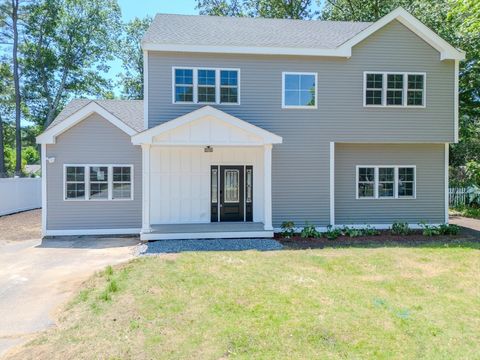
Active
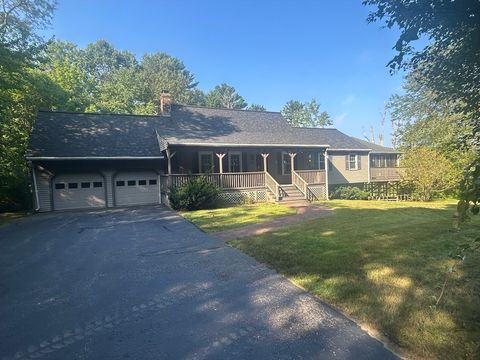
$445,000
3
bds
|
1
ba
|
1,232
sqft
|
built
1800
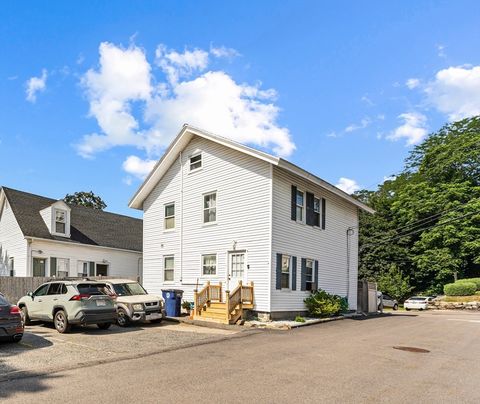
9 Sanford St, Medway, MA 02053
$-287
Cash flow
-3.4%
Cash-on-Cash Return
4.9%
Cap rate
0.7%
Rent to Value Ratio
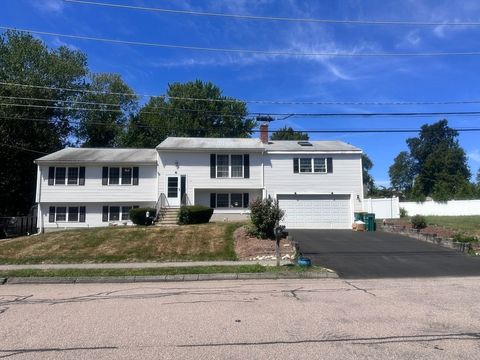
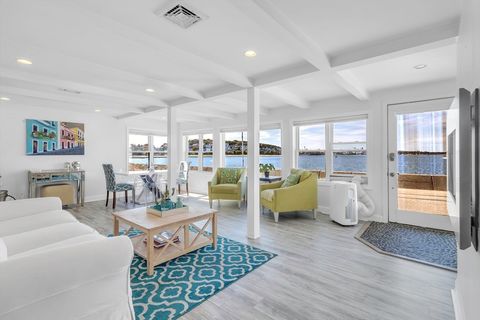
Active
$385,000
3
bds
|
1
ba
|
912
sqft
|
built
1958
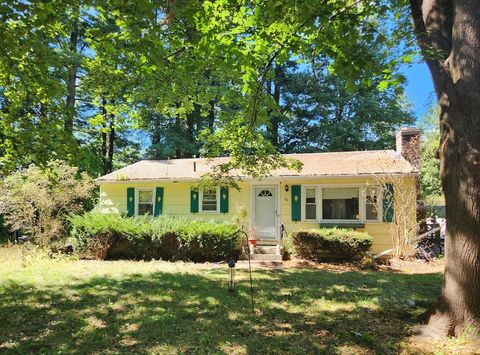
24 Vernon Rd, Medway, MA 02053
$-317
Cash flow
-4.3%
Cash-on-Cash Return
4.7%
Cap rate
0.8%
Rent to Value Ratio
247 out of 902 properties for sale in Norfolk County
Limited Results Shown
Create a free account, or log in to reveal all property listings and enjoy the complete experience.
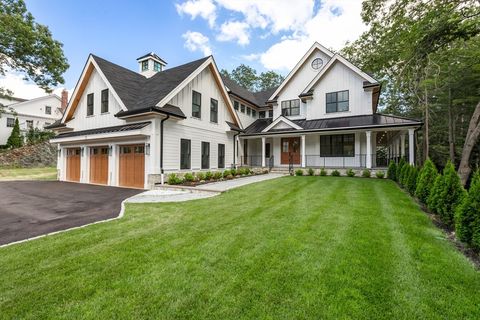
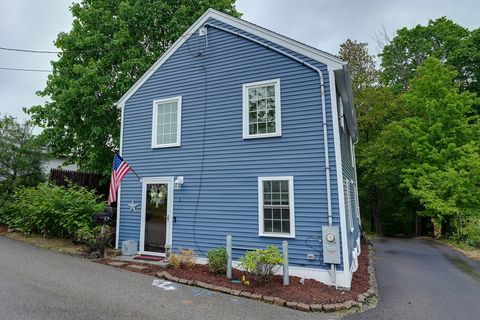
Active
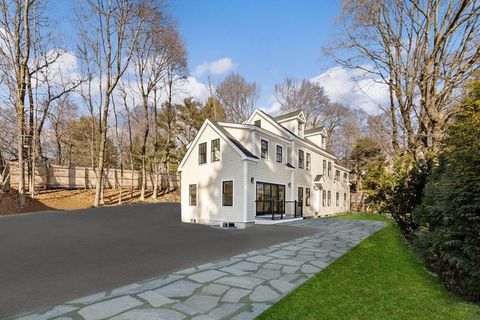
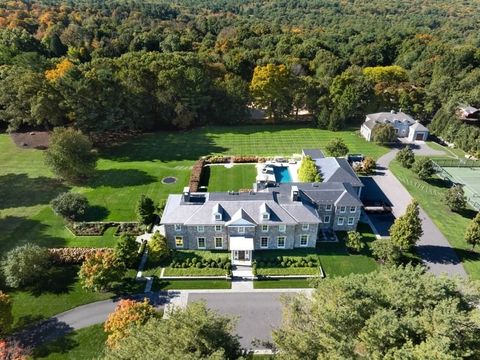
$4,495,000
6
bds
|
7
ba
|
7,867
sqft
|
built
2025
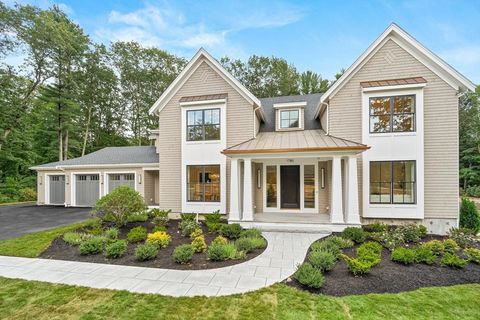
1780 Central Ave, Needham, MA 02492
$-101,086
Cash flow
-117.3%
Cash-on-Cash Return
-21.3%
Cap rate
0.1%
Rent to Value Ratio
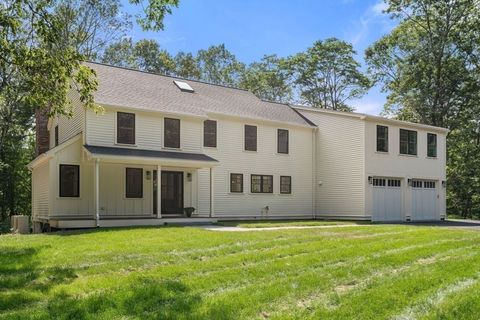
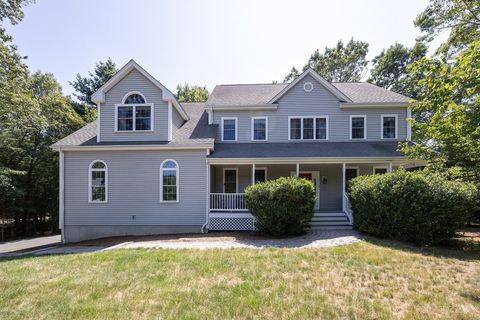
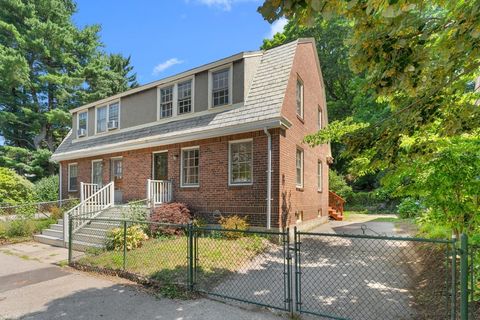
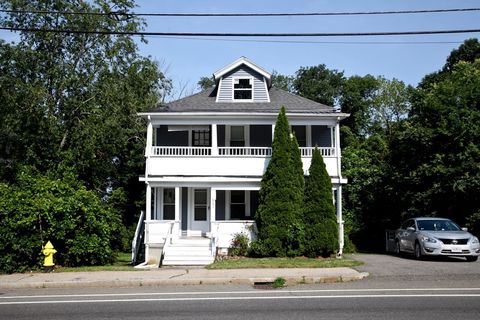
Active
$749,900
4
bds
|
2
ba
|
2,562
sqft
|
built
1870
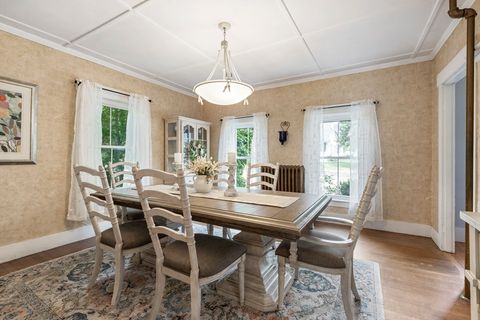
329 Village St, Medway, MA 02053
$-1,441
Cash flow
-10.0%
Cash-on-Cash Return
3.4%
Cap rate
0.5%
Rent to Value Ratio
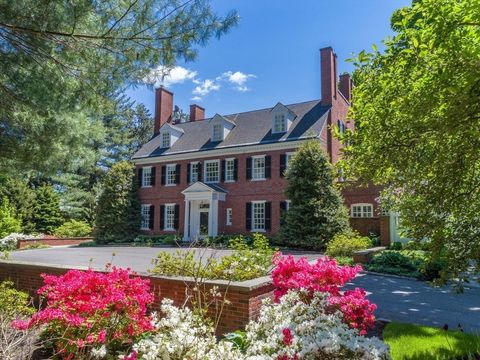
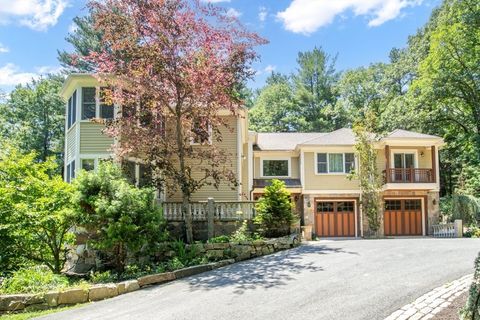
Active
$1,999,000
5
bds
|
5
ba
|
4,580
sqft
|
built
2024
25 Shaw Rd, Wellesley, MA 02481
$-6,783
Cash flow
-17.7%
Cash-on-Cash Return
1.6%
Cap rate
0.3%
Rent to Value Ratio
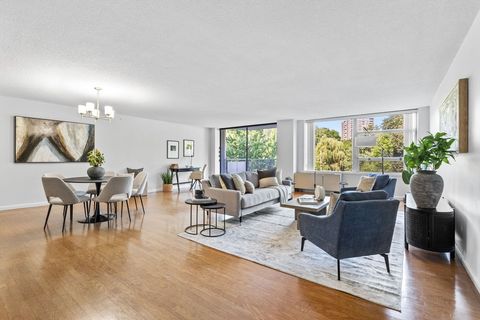
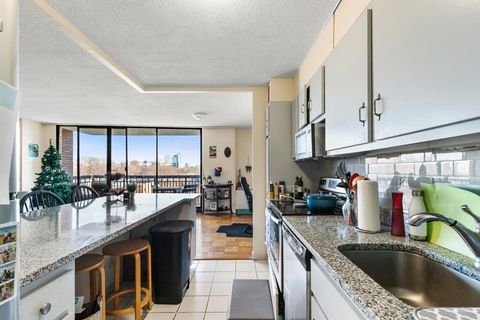
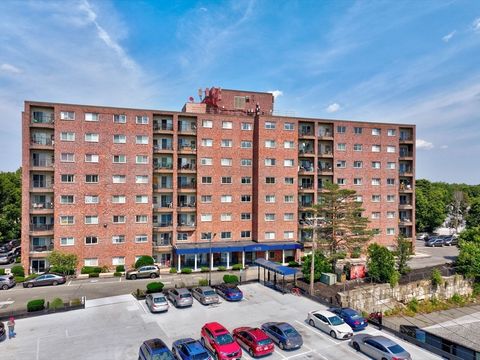
Active
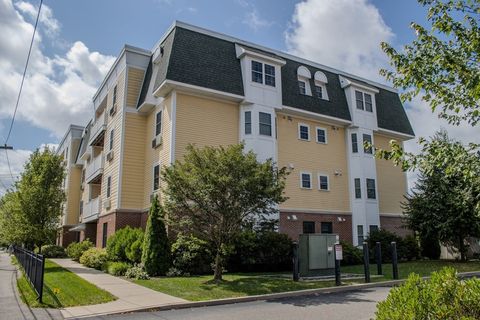
$618,000
2
bds
|
2
ba
|
1,325
sqft
|
built
2015
39 Fayette St, Quincy, MA 02171
$-1,666
Cash flow
-14.1%
Cash-on-Cash Return
2.4%
Cap rate
0.5%
Rent to Value Ratio
Active
$2,295,000
5
bds
|
5
ba
|
4,655
sqft
|
built
1985
7 Garden Rd, Wellesley, MA 02481
$-7,706
Cash flow
-17.5%
Cash-on-Cash Return
1.6%
Cap rate
0.3%
Rent to Value Ratio
Active
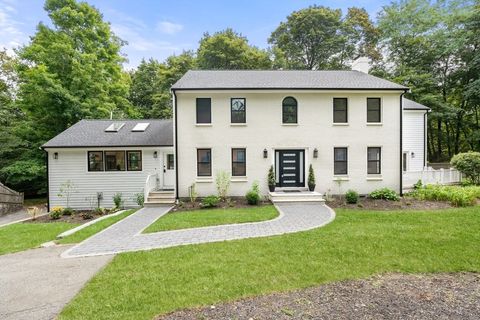
$1,050,000
4
bds
|
3
ba
|
3,117
sqft
|
built
1959
40 Neal St, Walpole, MA 02081
$-2,580
Cash flow
-12.8%
Cash-on-Cash Return
2.7%
Cap rate
0.4%
Rent to Value Ratio
Active
$2,325,000
4
bds
|
4
ba
|
5,018
sqft
|
built
1983
14 Ruel Dr, Dover, MA 02030
$-7,659
Cash flow
-17.2%
Cash-on-Cash Return
1.7%
Cap rate
0.3%
Rent to Value Ratio
Active
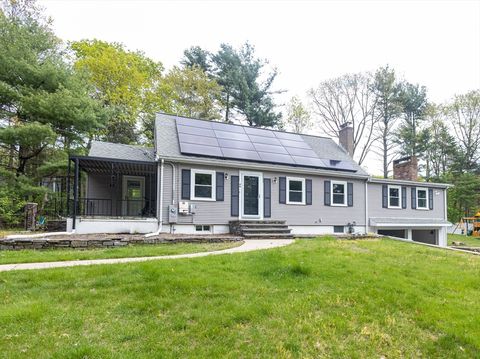
$965,000
4
bds
|
4
ba
|
2,669
sqft
|
built
1977
35 Pilgrim Dr, Norwood, MA 02062
$-2,241
Cash flow
-12.1%
Cash-on-Cash Return
2.9%
Cap rate
0.5%
Rent to Value Ratio
Active
$5,879,995
6
bds
|
8
ba
|
9,494
sqft
|
built
2024
33 Royalston Rd, Wellesley, MA 02481
$-23,059
Cash flow
-20.5%
Cash-on-Cash Return
1.0%
Cap rate
0.2%
Rent to Value Ratio
Active
$489,900
2
bds
|
2
ba
|
912
sqft
|
built
1983
53 S Shore Rd, Holbrook, MA 02343
$-770
Cash flow
-8.2%
Cash-on-Cash Return
3.8%
Cap rate
0.6%
Rent to Value Ratio
Active
$750,000
3
bds
|
2
ba
|
2,728
sqft
|
built
1966
85 Fisher St, Medway, MA 02053
$-1,499
Cash flow
-10.4%
Cash-on-Cash Return
3.3%
Cap rate
0.5%
Rent to Value Ratio
Active
$15,000,000
5
bds
|
8
ba
|
11,315
sqft
|
built
1915
610 Harland St, Milton, MA 02186
$-73,743
Cash flow
-25.6%
Cash-on-Cash Return
-0.2%
Cap rate
0.0%
Rent to Value Ratio
Active
$1,095,000
2
bds
|
2
ba
|
1,598
sqft
|
built
1956
80 Park St, Brookline, MA 02446
$-3,595
Cash flow
-17.1%
Cash-on-Cash Return
1.7%
Cap rate
0.5%
Rent to Value Ratio
Active
$1,250,000
4
bds
|
4
ba
|
3,629
sqft
|
built
2006
6 Freedom Trl, Medway, MA 02053
$-3,177
Cash flow
-13.3%
Cash-on-Cash Return
2.6%
Cap rate
0.4%
Rent to Value Ratio
Active
$665,000
1
bds
|
2
ba
|
950
sqft
|
built
1975
50 Longwood Ave, Brookline, MA 02446
$-2,378
Cash flow
-18.7%
Cash-on-Cash Return
1.4%
Cap rate
0.5%
Rent to Value Ratio
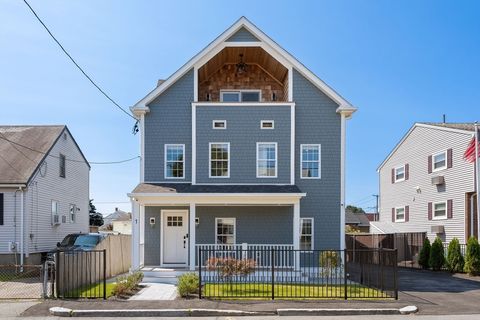
Active
$1,095,000
4
bds
|
3
ba
|
2,950
sqft
|
built
2025
1 Wall St, Quincy, MA 02169
$-3,684
Cash flow
-17.6%
Cash-on-Cash Return
1.6%
Cap rate
0.3%
Rent to Value Ratio
Active
$799,900
5
bds
|
3
ba
|
2,622
sqft
|
built
1957
37 Maple St, Medway, MA 02053
$-1,410
Cash flow
-9.2%
Cash-on-Cash Return
3.6%
Cap rate
0.6%
Rent to Value Ratio
Active
$699,900
3
bds
|
3
ba
|
1,604
sqft
|
built
2016
2 Mitchell Ln, Weymouth, MA 02190
$-1,883
Cash flow
-14.0%
Cash-on-Cash Return
2.5%
Cap rate
0.5%
Rent to Value Ratio
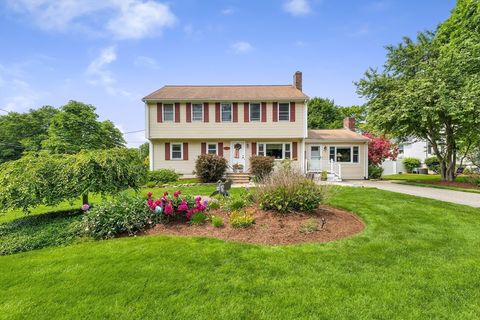
Active
$499,000
2
bds
|
2
ba
|
1,350
sqft
|
built
1968
1204 Greendale Ave, Needham, MA 02492
$-1,102
Cash flow
-11.5%
Cash-on-Cash Return
3.0%
Cap rate
0.7%
Rent to Value Ratio
Active
$1,484,000
7
bds
|
5
ba
|
2,802
sqft
|
built
1918
69 Suomi Rd, Quincy, MA 02169
$-4,810
Cash flow
-16.9%
Cash-on-Cash Return
1.8%
Cap rate
0.3%
Rent to Value Ratio
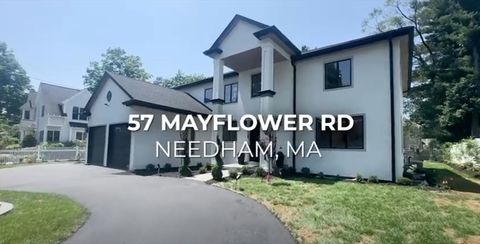
Active
$2,755,000
7
bds
|
5
ba
|
6,400
sqft
|
built
2025
57 Mayflower Rd, Needham, MA 02492
$-10,638
Cash flow
-20.1%
Cash-on-Cash Return
1.0%
Cap rate
0.2%
Rent to Value Ratio
Active
$799,000
3
bds
|
2
ba
|
1,454
sqft
|
built
1880
68 Prospect St, Canton, MA 02021
$-1,608
Cash flow
-10.5%
Cash-on-Cash Return
3.3%
Cap rate
0.5%
Rent to Value Ratio
Active
$2,999,000
6
bds
|
6
ba
|
6,482
sqft
|
built
2025
59 Henderson St, Needham, MA 02492
$-11,851
Cash flow
-20.6%
Cash-on-Cash Return
0.9%
Cap rate
0.2%
Rent to Value Ratio
Active
$1,279,900
4
bds
|
4
ba
|
5,600
sqft
|
built
2001
9 Tulip Way, Medway, MA 02053
$-2,867
Cash flow
-11.7%
Cash-on-Cash Return
3.0%
Cap rate
0.5%
Rent to Value Ratio
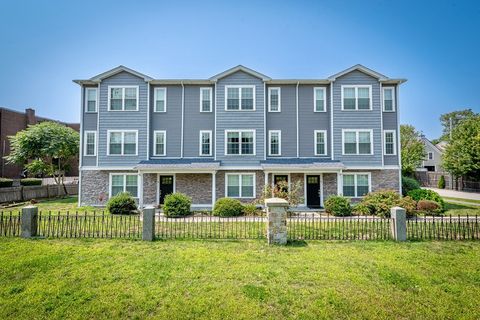
Active
$1,399,900
8
bds
|
4
ba
|
4,420
sqft
|
built
1906
175 West St, Braintree, MA 02184
$-5,053
Cash flow
-18.8%
Cash-on-Cash Return
1.3%
Cap rate
0.3%
Rent to Value Ratio
Active
$679,000
3
bds
|
2
ba
|
1,244
sqft
|
built
1905
108 Needham St, Dedham, MA 02026
$-1,087
Cash flow
-8.4%
Cash-on-Cash Return
3.8%
Cap rate
0.6%
Rent to Value Ratio
Active
$1,550,000
2
bds
|
2
ba
|
2,180
sqft
|
built
1925
24 Dean Rd, Brookline, MA 02445
$-5,165
Cash flow
-17.4%
Cash-on-Cash Return
1.7%
Cap rate
0.4%
Rent to Value Ratio
Active
$819,000
3
bds
|
3
ba
|
2,188
sqft
|
built
1978
4 Bullard Cir, Medway, MA 02053
$-1,705
Cash flow
-10.9%
Cash-on-Cash Return
3.2%
Cap rate
0.5%
Rent to Value Ratio
Active
$649,900
3
bds
|
2
ba
|
1,690
sqft
|
built
1950
163 Lake St, Weymouth, MA 02189
$-1,333
Cash flow
-10.7%
Cash-on-Cash Return
3.2%
Cap rate
0.5%
Rent to Value Ratio
Active
$1,258,000
3
bds
|
2
ba
|
1,521
sqft
|
built
1890
6 Oakland Cir, Wellesley, MA 02481
$-3,420
Cash flow
-14.2%
Cash-on-Cash Return
2.4%
Cap rate
0.4%
Rent to Value Ratio
Active
$399,000
2
bds
|
2
ba
|
865
sqft
|
built
1988
230 Willard St, Quincy, MA 02169
$-1,144
Cash flow
-15.0%
Cash-on-Cash Return
2.2%
Cap rate
0.6%
Rent to Value Ratio
Active
$924,000
3
bds
|
1
ba
|
1,000
sqft
|
built
1921
71 Highland Rd, Brookline, MA 02445
$-2,233
Cash flow
-12.6%
Cash-on-Cash Return
2.8%
Cap rate
0.5%
Rent to Value Ratio
Active
$12,995,000
6
bds
|
6
ba
|
7,502
sqft
|
built
1929
71 Sears Rd, Brookline, MA 02445
$-62,401
Cash flow
-25.1%
Cash-on-Cash Return
-0.1%
Cap rate
0.1%
Rent to Value Ratio
Active
$499,900
3
bds
|
3
ba
|
1,400
sqft
|
built
1880
1 John St, Medway, MA 02053
$-523
Cash flow
-5.5%
Cash-on-Cash Return
4.4%
Cap rate
0.7%
Rent to Value Ratio
Active
$998,000
3
bds
|
3
ba
|
3,080
sqft
|
built
2025
28 Berkshire Ave, Sharon, MA 02067
$-3,332
Cash flow
-17.4%
Cash-on-Cash Return
1.7%
Cap rate
0.3%
Rent to Value Ratio
Active
$950,000
3
bds
|
2
ba
|
1,488
sqft
|
built
1918
87 Fort Point Rd, Weymouth, MA 02191
$-1,944
Cash flow
-10.7%
Cash-on-Cash Return
3.2%
Cap rate
0.5%
Rent to Value Ratio
Active
$1,350,000
8
bds
|
3
ba
|
2,285
sqft
|
built
1930
801 Granite St, Braintree, MA 02184
$-5,032
Cash flow
-19.4%
Cash-on-Cash Return
1.2%
Cap rate
0.2%
Rent to Value Ratio
Active
$3,199,000
4
bds
|
5
ba
|
5,299
sqft
|
built
1987
39 Westbrook Ln, Westwood, MA 02090
$-13,021
Cash flow
-21.2%
Cash-on-Cash Return
0.8%
Cap rate
0.2%
Rent to Value Ratio