$1,250,000
Investment Summary
- Monthly Cash Flow
- -$3,925
- Cap Rate
- 1.9%
- Cash-on-Cash Return
- -16.4%
- Debt Coverage Ratio
- 0.34
- Internal Rate of Return (5 years)
- -11.8%
Cash Flow
Net Operating Income (NOI) minus mortgage payments.
Calculation:
NOI - Mortgage Payments
Cap Rate (Market Value)
Capitalization Rate is a rate of return that compares the yearly Net Operating Income (NOI) to the market value.
Calculation:
NOI / Market Value
Cash-on-Cash Return (CoC)
Annual Cash Flow / Cash Invested
Calculation:
Annual cash flow divided by initial cash invested.
Debt Coverage Ratio (DCR)
Net Operating Income (NOI) divided by total debt payments.
Calculation:
NOI / Total Debt Payments
Internal Rate of Return (IRR)
A metric for assessing profitability over time. IRR is the discount rate at which the net present value (NPV) of all future cash flows (positive and negative) from an investment equals zero — including both periodic cash flow (such as rent) and a projected sale at the end of the holding period. It represents the expected annualized return, accounting for income, expenses, and the recovery of capital through a future sale.
Property Description
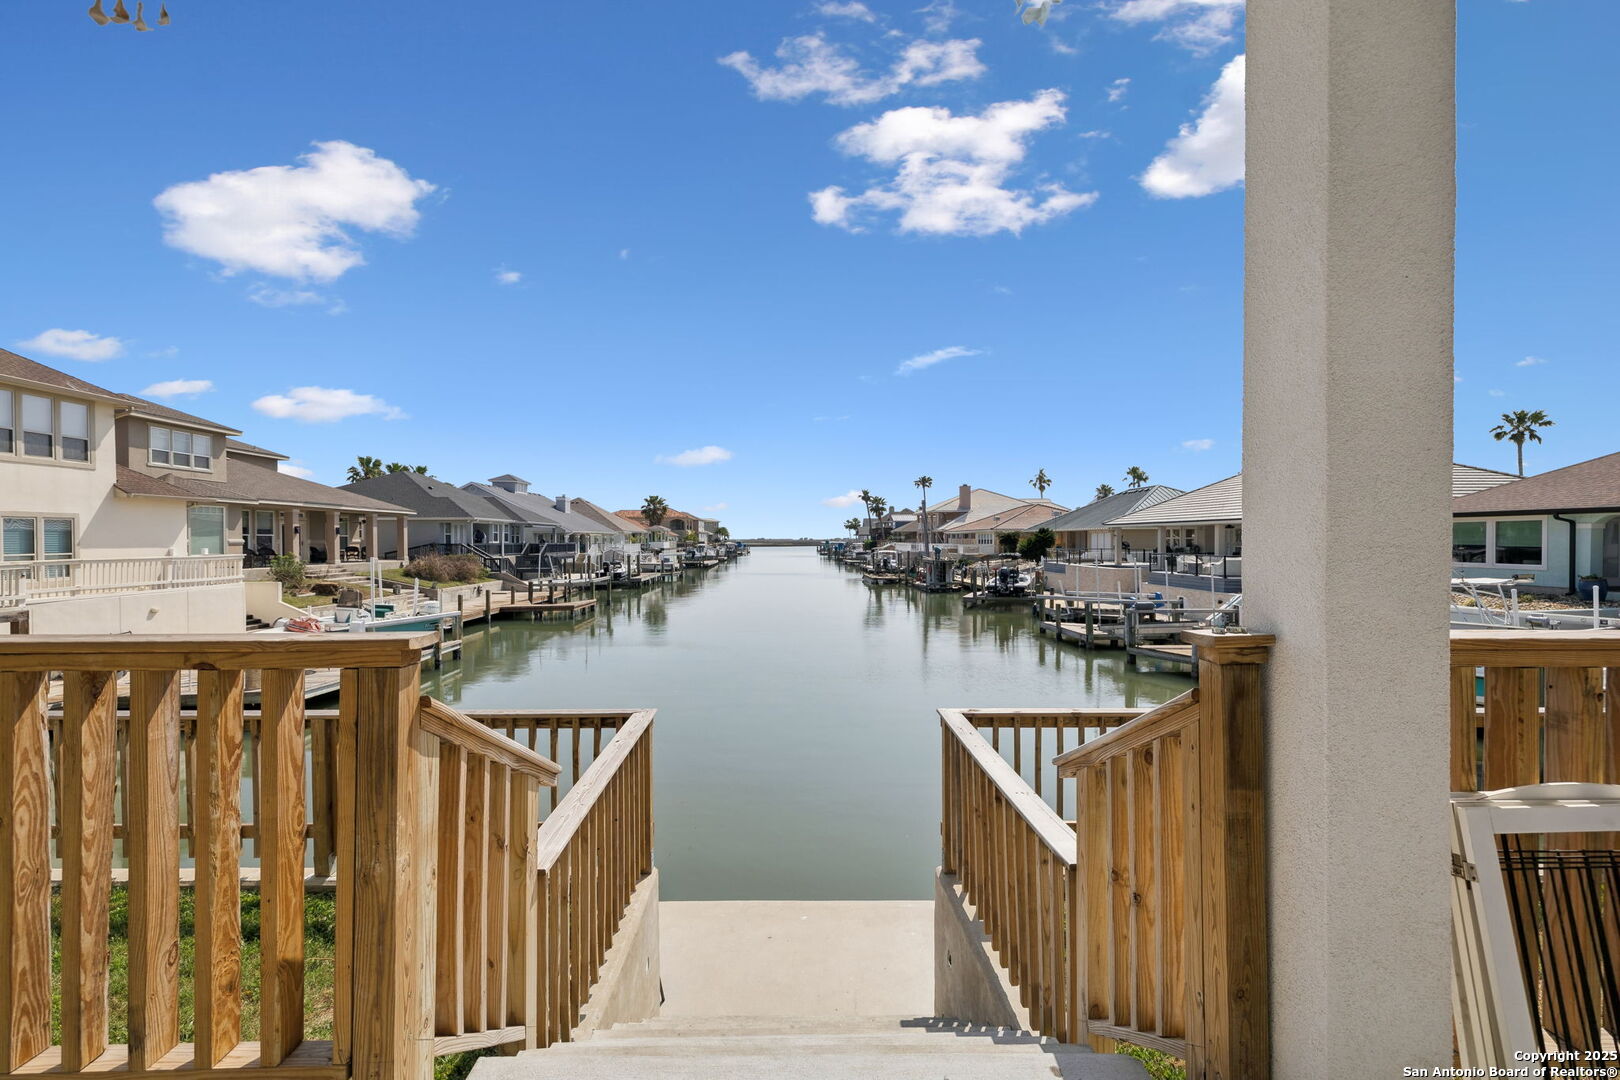
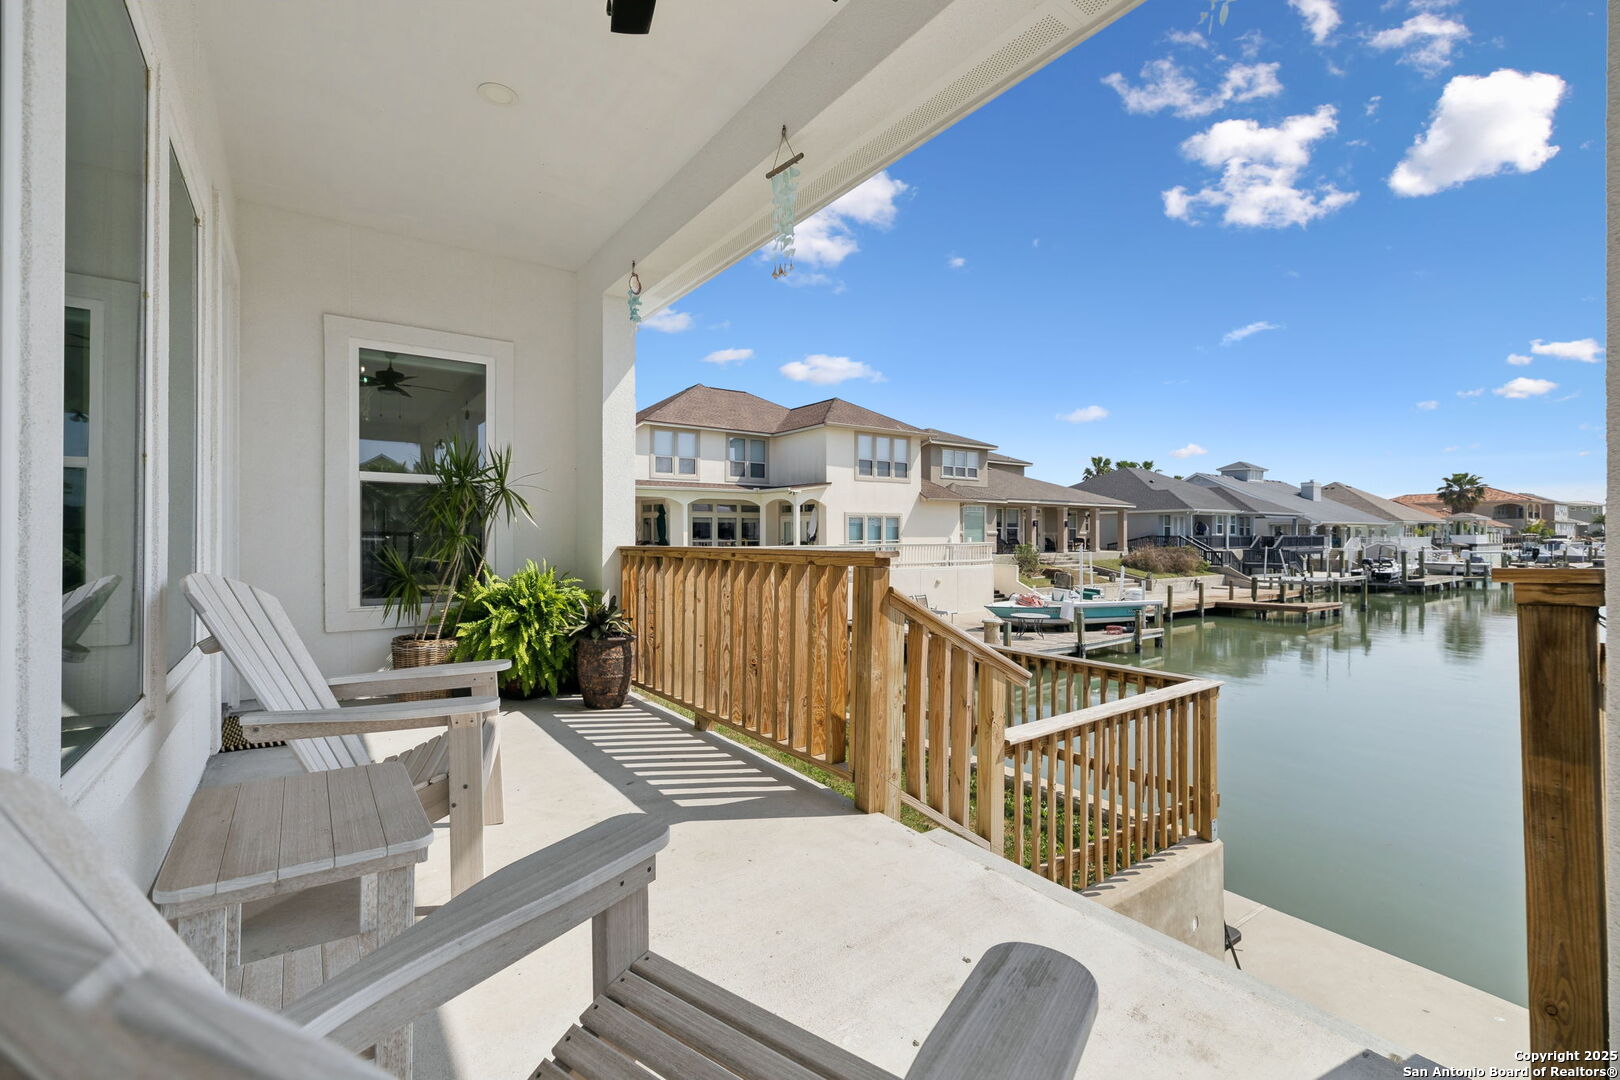
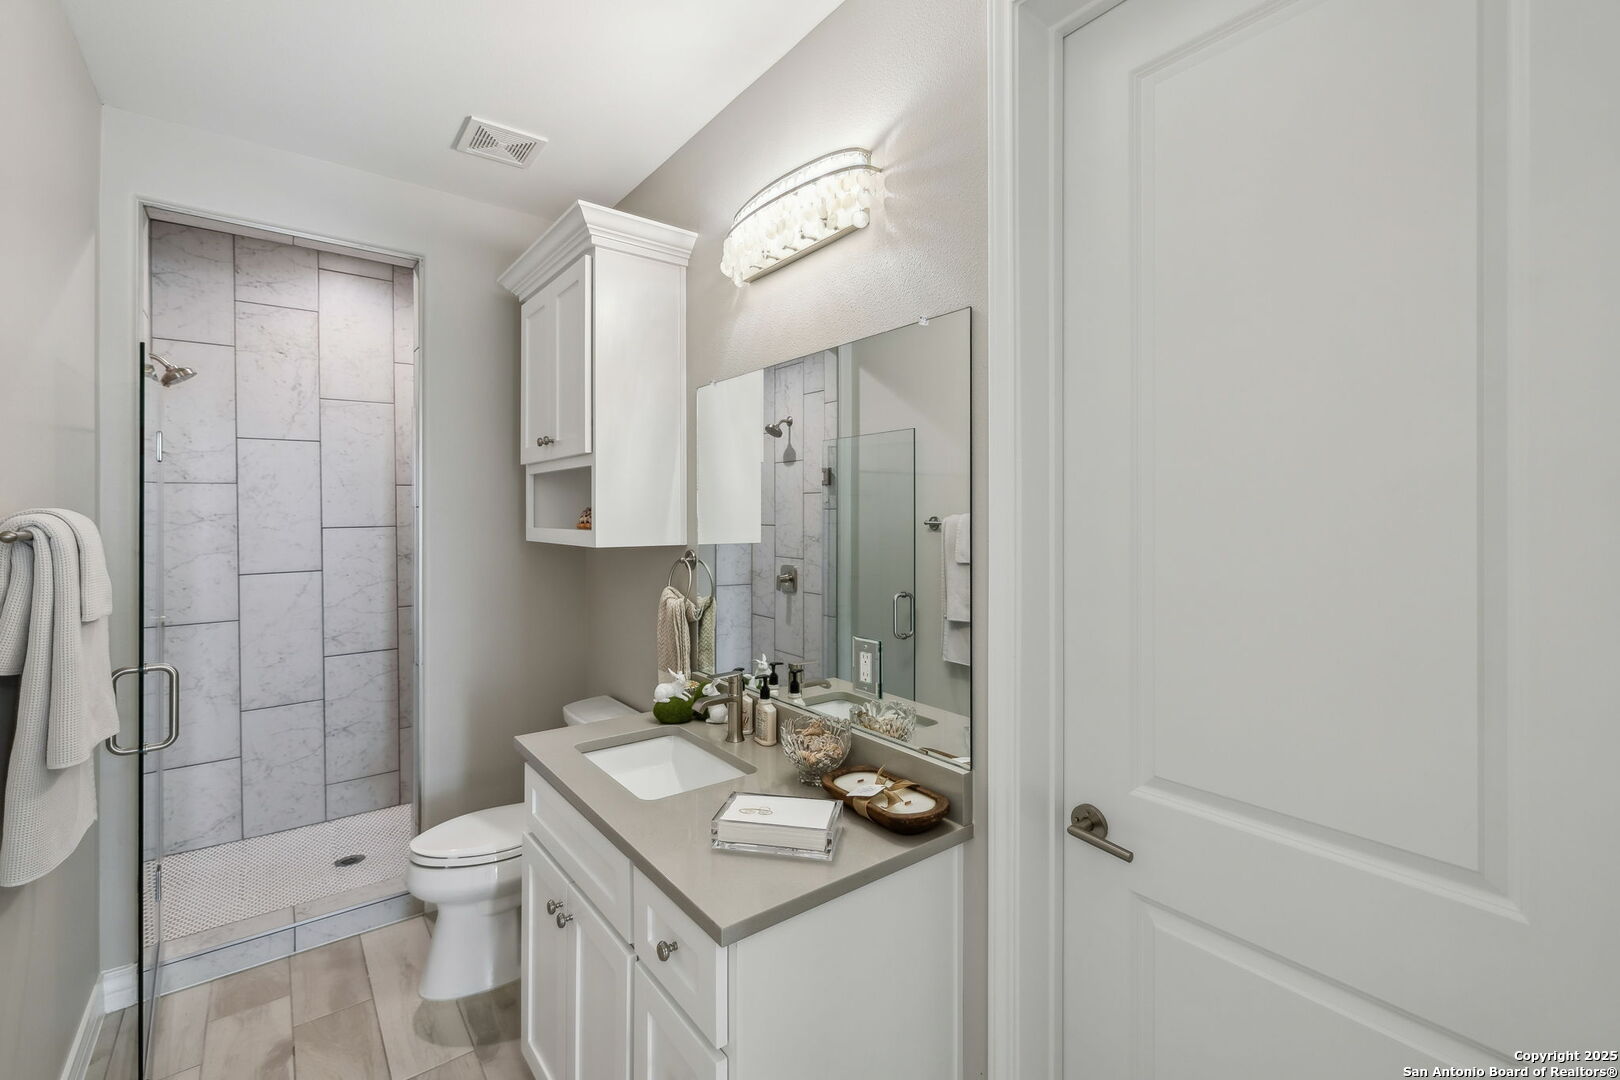
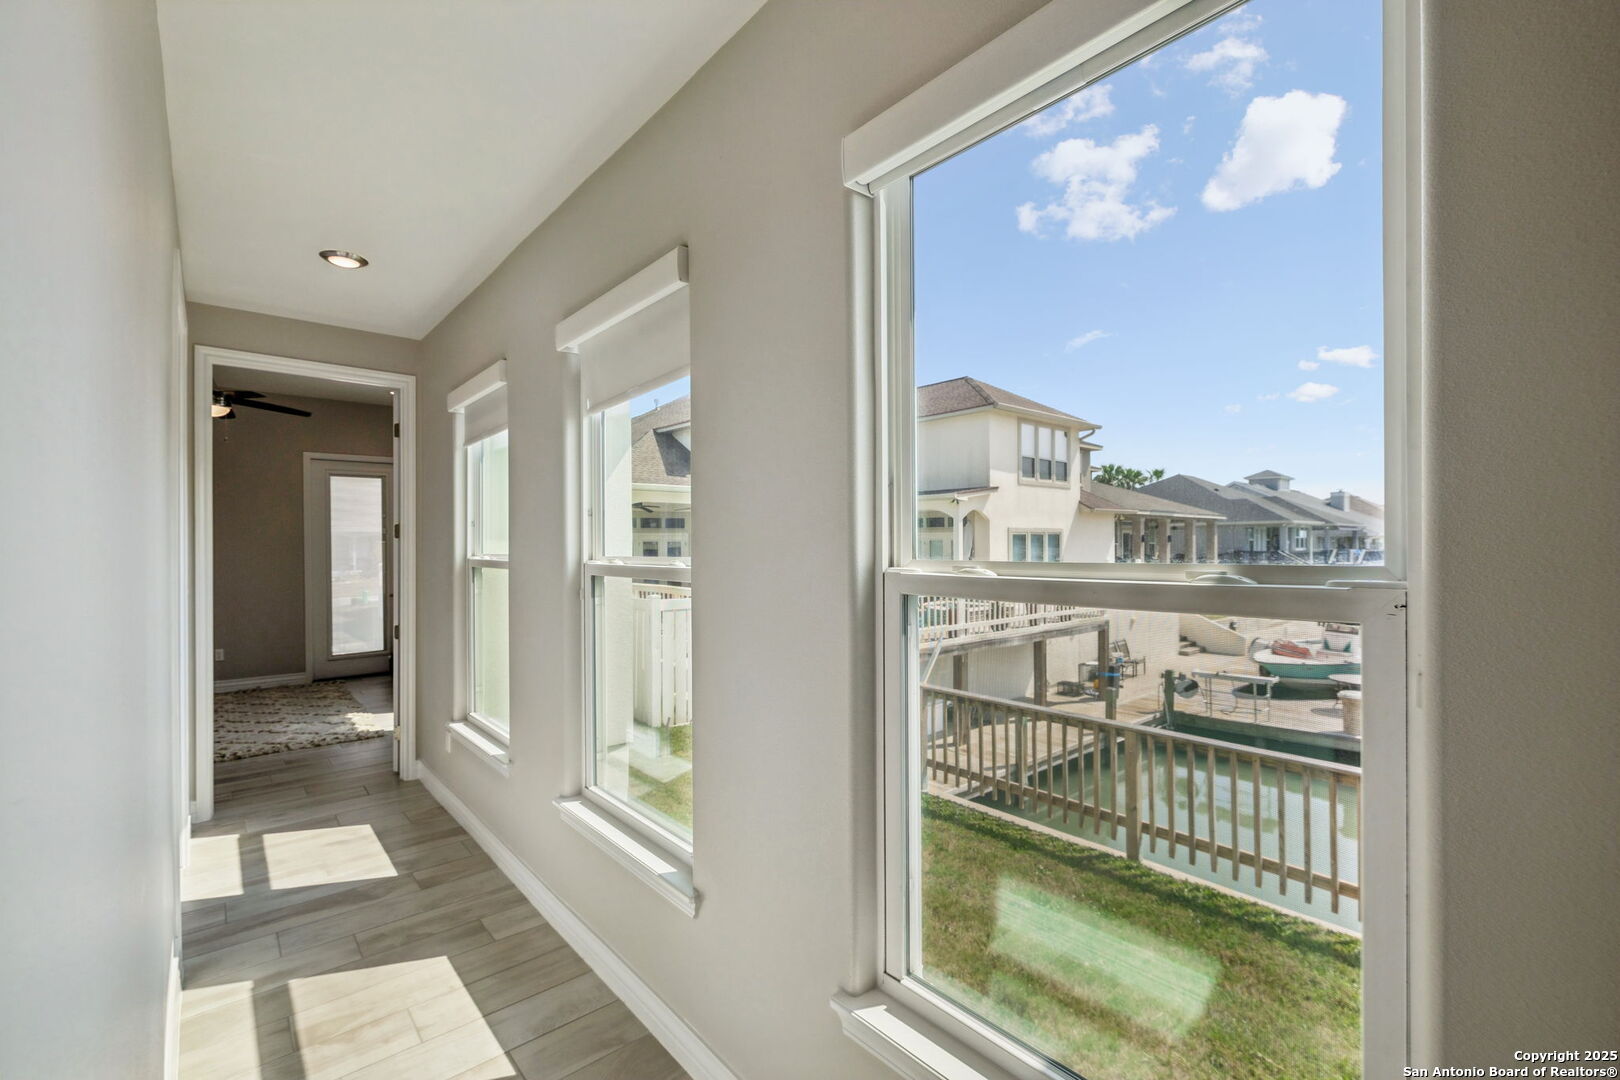
Forget everything you thought you knew about Texas coastal living-this is what happens when architectural vision meets unfiltered waterfront access. 108 Bay Harbor isn't just another canal-front property. It's a 2,920-square-foot statement of intent, positioned in the exclusive gated enclave where Redfish Bay becomes your private playground and every sunset feels like it was staged specifically for your back patio. The location is the luxury: Aransas Pass remains the Texas coast's best-kept secret-tucked between the charm of Rockport and the energy of Port Aransas, yet blissfully removed from the tourist chaos. Direct canal access means your boat slip leads straight to Redfish Bay, the Gulf, and barrier island beaches most people can only reach by car and ferry. This is waterfront living for those who actually use the water. Step inside and understand the difference: Soaring vaulted ceilings with statement wood beams. Floor-to-ceiling impact windows that don't just frame the southern-facing canal views-they make them the focal point of your daily life. Natural light floods every corner of this open-concept masterpiece, creating that rare combination of drama and livability that most waterfront homes promise but few deliver. The kitchen commands the room: Chef-inspired with gas cooktop, double ovens, and a showstopping granite island designed for both serious cooking and casual gathering. But here's what sets it apart-it's positioned to capture those water views, so even meal prep feels like a vacation. Your private sanctuary awaits: The owner's suite is strategically separated for maximum privacy, featuring tranquil canal views and a spa-caliber ensuite. Freestanding soaking tub. Oversized walk-in rain shower. Generous closet that can actually handle a luxury wardrobe. This is where the day starts and ends right. Space that adapts to your life: A private flex room with dedicated bath functions as guest suite, home office, or creative studio. Two additional bedrooms anchor the opposite wing. An expansive media/game room that's truly multipurpose. And that covered back patio? Already plumbed with gas lines for your grill, outdoor kitchen, and everything else you'll want once you realize how much time you'll spend outside. Lightly lived-in means move-in perfect: This home has barely been touched. You're getting that new-construction feel without the construction timeline, in a community where waterfront inventory rarely surfaces. Whether this becomes your coastal forever home, your executive retreat, or your smartest investment along Texas' most desirable waterfront corridor, 108 Bay Harbor represents something increasingly rare: uncompromised location, thoughtful design, and immediate water access-all without the Port Aransas price tag or Rockport crowds. The boat's waiting. The bay is calling. The only question is-what took you so long?
Build Your Team
Quickly find investor-friendly professionals who can help you succeed in real estate investing at any stage of the investing journey.


Agents
Match with investor-friendly agents who can help you find, analyze, and close your next deal


Lenders
Get the best funding…find investor-friendly lenders who specialize in your deal strategy


Property Managers
Transition to passive investing. Find a trusted property management partnership that lasts.


Tax Pros & Accountants
Taxes and financial reporting made easy—find experts to create tax savings strategies, file taxes, and more
Location
Property Details
Parking
- Description: Concrete, FrontEntry, Garage
- Details: Garage Door Opener, Attached
- Garage Spaces: 3
- Spaces Total: 0
Bedroom Information
- # of Bedrooms: 4
Bathroom Information
- # of Baths (Full): 3
- # of Baths (Partial): 1
- # of Baths (Total): 3.0
Interior Features
- # of Stories: 1
- Fireplace: Yes
Exterior Features
- Foundation: Slab
- Roof Material: Composition
- Pool: Yes
HOA
- Has HOA: Yes
- Association: BAY HARBOR CHANNEL OWNERS ASSOCIATION
- HOA Fee: $1,275/annually
Land Information
- Land Use: Residential
- Land Use Subtype: Single Family Residential
Lot Information
- Parcel ID: 134700120020000
- Lot Size: 0 sqft
Property Information
- Property Type: Single Family Residence
- Style: One Story, Contemporary
- Year Built: 2022
Tax Information
- Annual Tax: $27,009
Utilities
- Heating: Propane, Central
- Cooling: Ceiling Fan(s), Central Air
Location
- County: San Patricio
Listing Details
Investment Summary
- Monthly Cash Flow
- -$3,925
- Cap Rate
- 1.9%
- Cash-on-Cash Return
- -16.4%
- Debt Coverage Ratio
- 0.34
- Internal Rate of Return (5 years)
- -11.8%
Cash Flow
Net Operating Income (NOI) minus mortgage payments.
Calculation:
NOI - Mortgage Payments
Cap Rate (Market Value)
Capitalization Rate is a rate of return that compares the yearly Net Operating Income (NOI) to the market value.
Calculation:
NOI / Market Value
Cash-on-Cash Return (CoC)
Annual Cash Flow / Cash Invested
Calculation:
Annual cash flow divided by initial cash invested.
Debt Coverage Ratio (DCR)
Net Operating Income (NOI) divided by total debt payments.
Calculation:
NOI / Total Debt Payments
Internal Rate of Return (IRR)
A metric for assessing profitability over time. IRR is the discount rate at which the net present value (NPV) of all future cash flows (positive and negative) from an investment equals zero — including both periodic cash flow (such as rent) and a projected sale at the end of the holding period. It represents the expected annualized return, accounting for income, expenses, and the recovery of capital through a future sale.
Purchase Details
Purchase PriceThe price paid for the property. Purchase price:
| $1,250,000 |
|---|---|
Amount FinancedThe amount of the purchase financed through a loan. Amount financed:
| -$1,000,000 |
Down paymentThe initial payment made towards the purchase. Down payment:
| $250,000 |
Closing CostsFees and expenses associated with purchasing a property, typically ranging from 2% to 5% of the home’s purchase price, paid at the end of a home purchase to cover services like lending, title transfer, and taxes. Closing costs:
| $37,500 |
Rehab CostsCosts incurred to repair or improve the property, including: roof, flooring, exterior siding, kitchen, exterior paint, bathrooms, etc. Rehab costs:
| $0 |
Initial Cash InvestedThe total initial cash invested in the property. Calculation:Down payment + Buying costs + Rehab costs Initial cash invested:
| $287,500 |
Square Feet (SQFT)The total square footage of the property. Square feet:
| 2,920 |
Cost Per Square FootCost per square foot of the property. Calculation:Purchase Price / Square Feet Cost per square foot:
| $428 |
Monthly Rent Per Square FootMonthly rent divided by the number of square feet. This ratio helps investors compare rental income efficiency across properties, markets, and unit sizes Calculation:Monthly Rent / Square Feet Monthly rent per square foot:
| $2.16 |
Financing Details
Loan AmountThe total sum of money borrowed from a lender to finance a property purchase. Calculation:Purchase Price - Down Payment
Loan amount:
| $1,000,000 |
|---|---|
Loan to Value Ratio (LTV)Loan amount divided by the market value of the property. Calculation:Loan Amount / Market Value
Loan to value ratio:
| 80.0% |
Loan TypeThe type of loan (e.g., fixed, adjustable).
Loan type:
| Amortizing |
TermThe loan repayment period in years.
Term:
| 30 years |
Interest RateThe percentage a lender charges on the borrowed amount of a loan, determining the cost of borrowing money.
Interest rate:
| 5.875% |
Principal & Interest (PI)The principal is the portion of the loan payment that reduces the loan balance. The interest is the lender's charge for borrowing money. Calculation:(P * r * (1 + r) ** n) / ((1 + r) ** n - 1) Where:
P = Loan amount (principal)
Principal & interest:
| $5,915 |
Property TaxesAnnual taxes levied by local governments on real estate properties. These taxes fund public services like schools, roads, and emergency services.
Property tax:
| $2,251 |
InsuranceThe costs for insurance coverage to protect against financial losses due to risks like fire, natural disasters, theft, liability, or tenant-related damages. Calculation:Assumes 7% of gross rental income, unless insurance rates are specified.
Insurance:
| $441 |
Private Mortgage Insurance (PMI)A fee that borrowers pay when they take out a conventional loan with a loan-to-value (LTV) ratio above 80%.
Private mortgage insurance (PMI):
| $0 |
Monthly PaymentThe fixed amount a borrower pays each month to repay a loan. It typically includes principal and interest (P&I) and may also cover property taxes, insurance, HOA fees, and PMI if escrowed. Monthly payment:
| $8,607 |
Operating Income
| % Rent | Monthly | Yearly | |
|---|---|---|---|
Gross RentThe total rental income received from tenants before deducting any expenses. Includes base rent, late fees, pet fees, parking fees, and other recurring charges.
Gross rent:
| $6,300 | $75,600 | |
Vacancy LossExpected loss of rent due to vacancies.
Vacancy loss:
(6%)
| 6% | -$378 | -$4,536 |
Operating IncomeGross rental income minus vacancy loss. Calculation:Gross rent - Vacancy loss
Operating income:
| $5,922 | $71,064 |
Operating Expenses
| % Rent | Monthly | Yearly | |
|---|---|---|---|
Property TaxesAnnual taxes levied by local governments on real estate properties. These taxes fund public services like schools, roads, and emergency services. | 36% | -$2,251 | -$27,009 |
InsuranceThe costs for insurance coverage to protect against financial losses due to risks like fire, natural disasters, theft, liability, or tenant-related damages. Calculation:Assumes 7% of gross rental income, unless insurance rates are specified. | 7% | -$441 | -$5,292 |
Property ManagementThe costs associated with hiring a property manager to handle the day-to-day operations of a rental property. Includes management fees, leasing fes, eviction fees, etc. Calculation:Assumes 8% of gross rental income. | 8% | -$504 | -$6,048 |
Repairs & MaintenanceOngoing costs for routine upkeep and minor fixes needed to keep a property in good working condition. Calculation:Assumes 5% of gross rental income. Varies by property age and condition. | 5% | -$315 | -$3,780 |
Capital ExpensesLarge, infrequent costs for major improvements or replacements, like a new roof, HVAC system, or appliances. Calculation:Assumes 5% of gross rental income. Varies by property age. | 5% | -$315 | -$3,780 |
HOA FeesRegular dues paid to a Homeowners Association for community maintenance, amenities, and management. Similar fees include: Condo Association Fees, Co-op Maintenance Fees, etc. | 2% | -$106 | -$1,272 |
Operating ExpensesRecurring costs required to maintain and manage a rental property, including property taxes, insurance, maintenance, repairs, utilities (if paid by the owner), property management fees, and other day-to-day expenses. Calculation:Insurance + Property Taxes + Property Management + Repairs & Maintenance + Capital Expenditures + HOA Fees | 62% | -$3,932 | -$47,181 |
Cash Flow
| Monthly | Yearly | |
|---|---|---|
Net Operating Income (NOI)The income generated from a property after deducting all operating expenses but before deducting mortgage payments, taxes, and capital expenditures. Calculation:Gross Operating Income - Operating Expenses
Net operating income:
| $1,990 | $23,880 |
Mortgage PaymentThe fixed amount a borrower pays each month to repay a loan. It typically includes principal and interest (P&I) and may also cover property taxes, insurance, HOA fees, and PMI if escrowed. | -$5,915 | -$70,980 |
Cash FlowNet Operating Income (NOI) minus mortgage payments. Calculation:NOI - Mortgage Payments | -$3,925 | -$47,100 |