$8,899,000
Investment Summary
- Monthly Cash Flow
- -$44,474
- Cap Rate
- 0.1%
- Cash-on-Cash Return
- -26.1%
- Debt Coverage Ratio
- 0.02
- Internal Rate of Return (5 years)
- -21.1%
Cash Flow
Net Operating Income (NOI) minus mortgage payments.
Calculation:
NOI - Mortgage Payments
Cap Rate (Market Value)
Capitalization Rate is a rate of return that compares the yearly Net Operating Income (NOI) to the market value.
Calculation:
NOI / Market Value
Cash-on-Cash Return (CoC)
Annual Cash Flow / Cash Invested
Calculation:
Annual cash flow divided by initial cash invested.
Debt Coverage Ratio (DCR)
Net Operating Income (NOI) divided by total debt payments.
Calculation:
NOI / Total Debt Payments
Internal Rate of Return (IRR)
A metric for assessing profitability over time. IRR is the discount rate at which the net present value (NPV) of all future cash flows (positive and negative) from an investment equals zero — including both periodic cash flow (such as rent) and a projected sale at the end of the holding period. It represents the expected annualized return, accounting for income, expenses, and the recovery of capital through a future sale.
Property Description
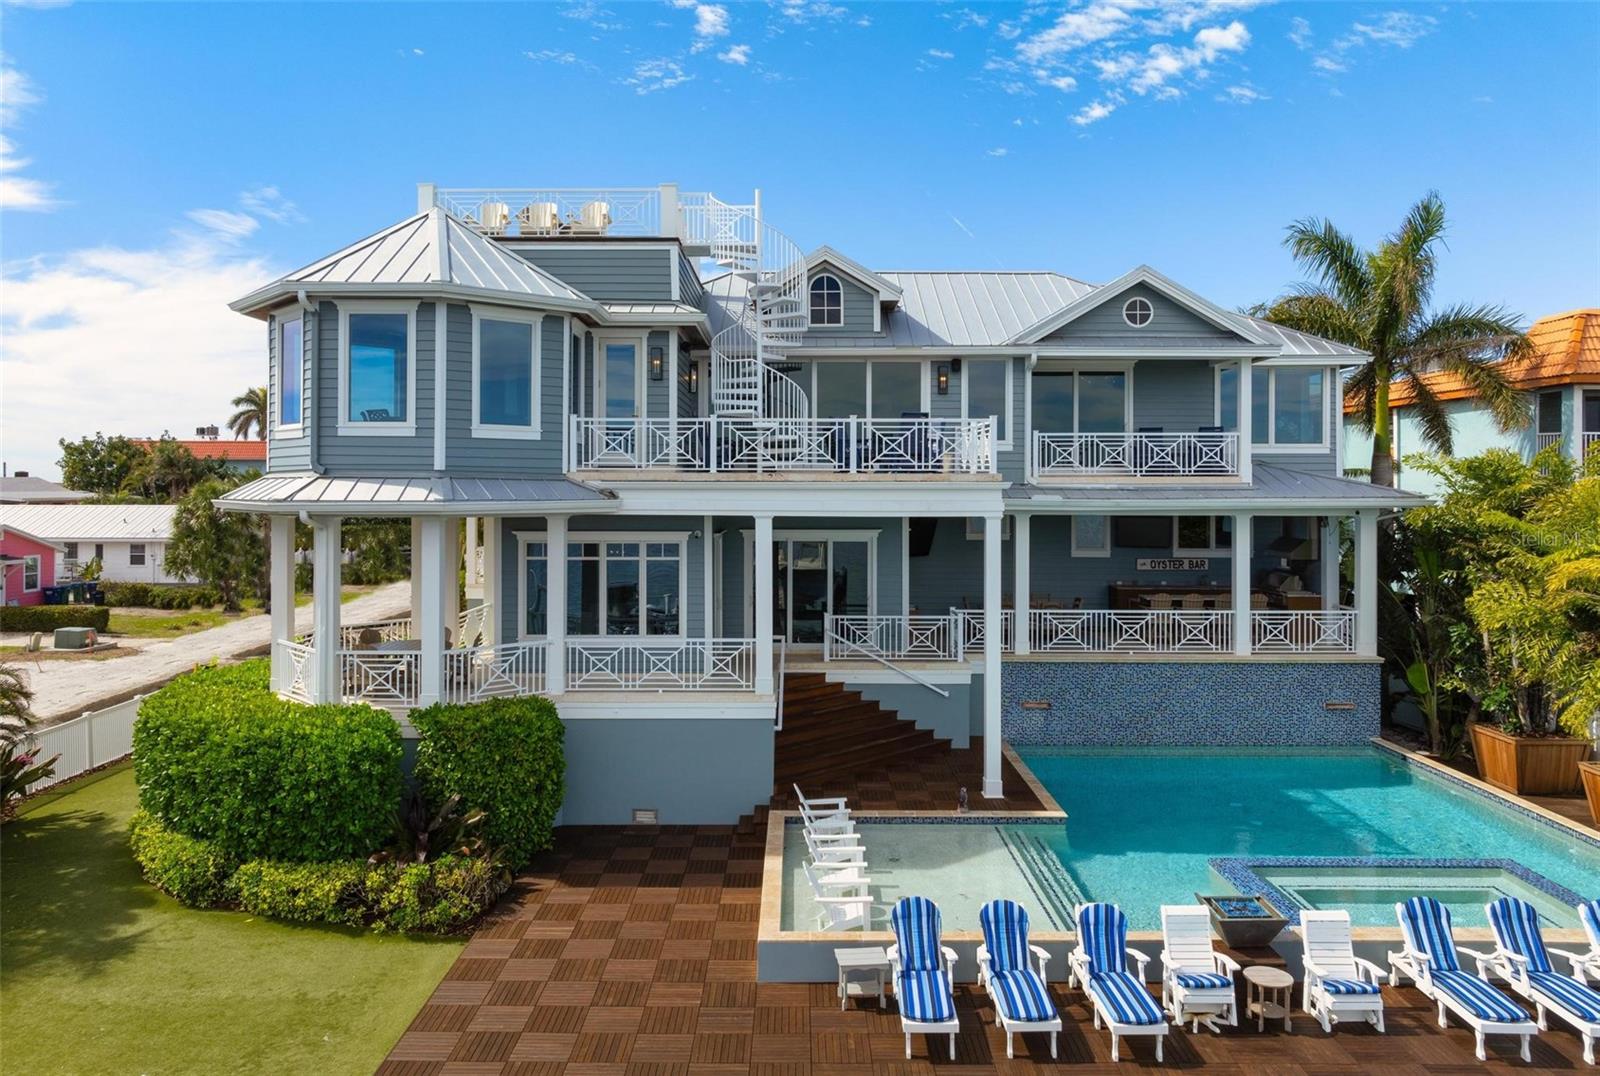
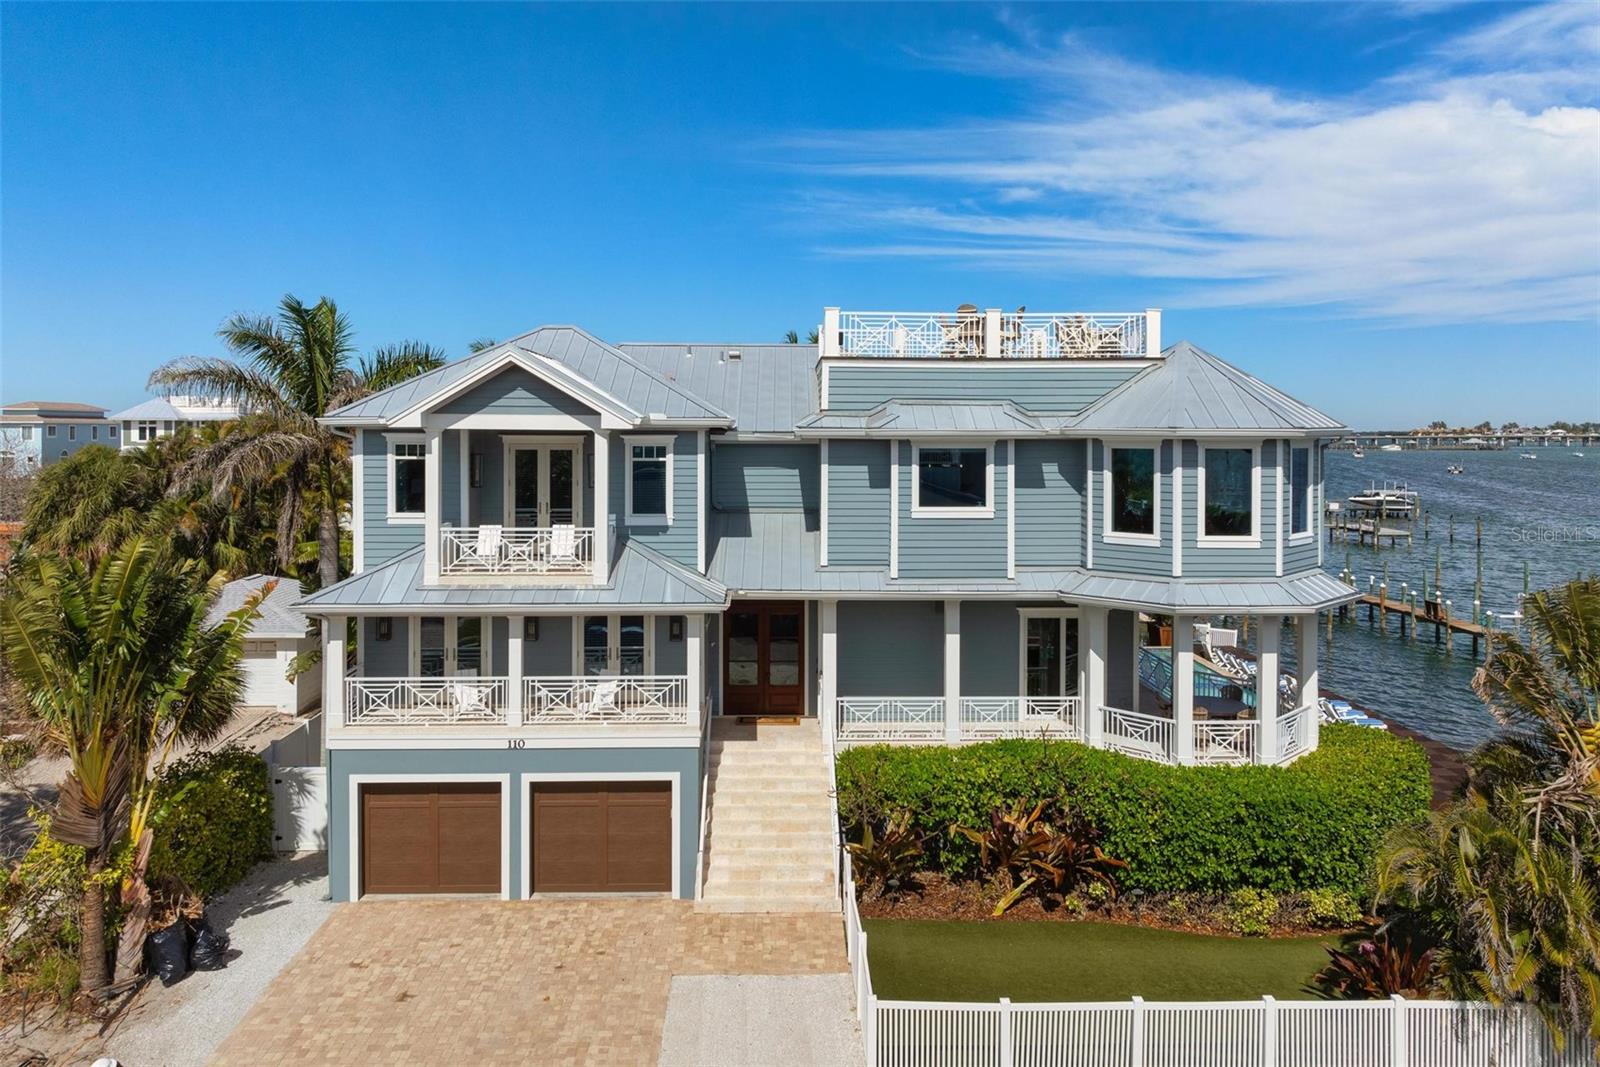
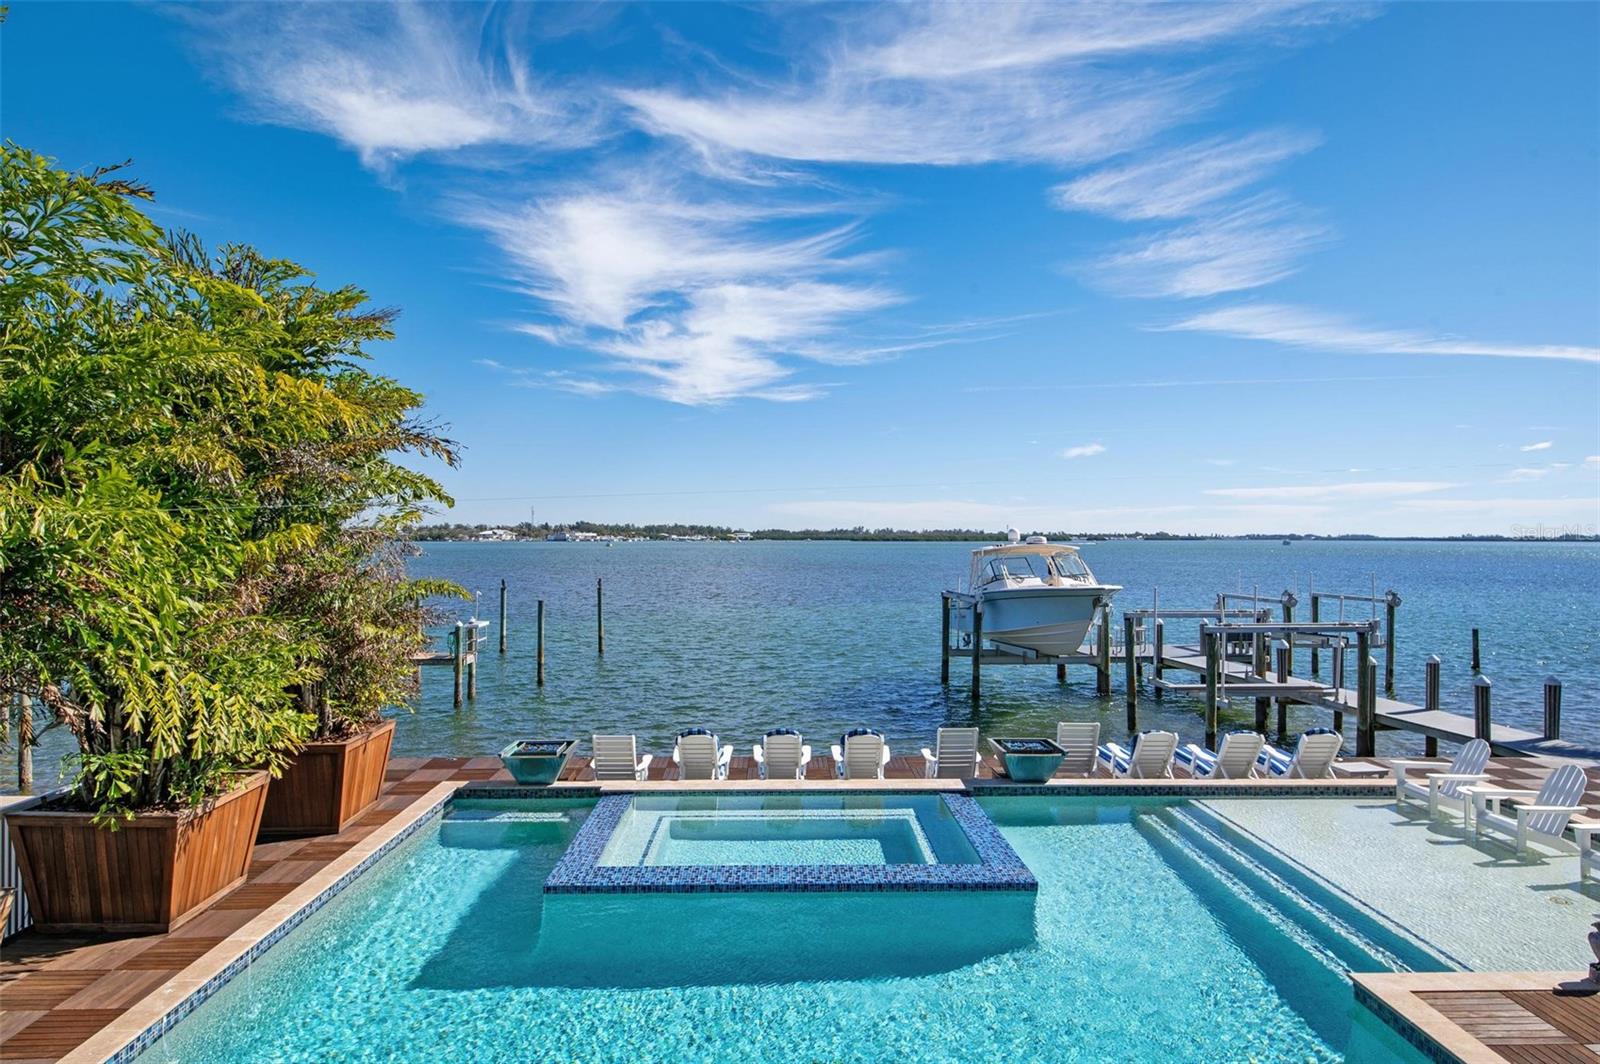
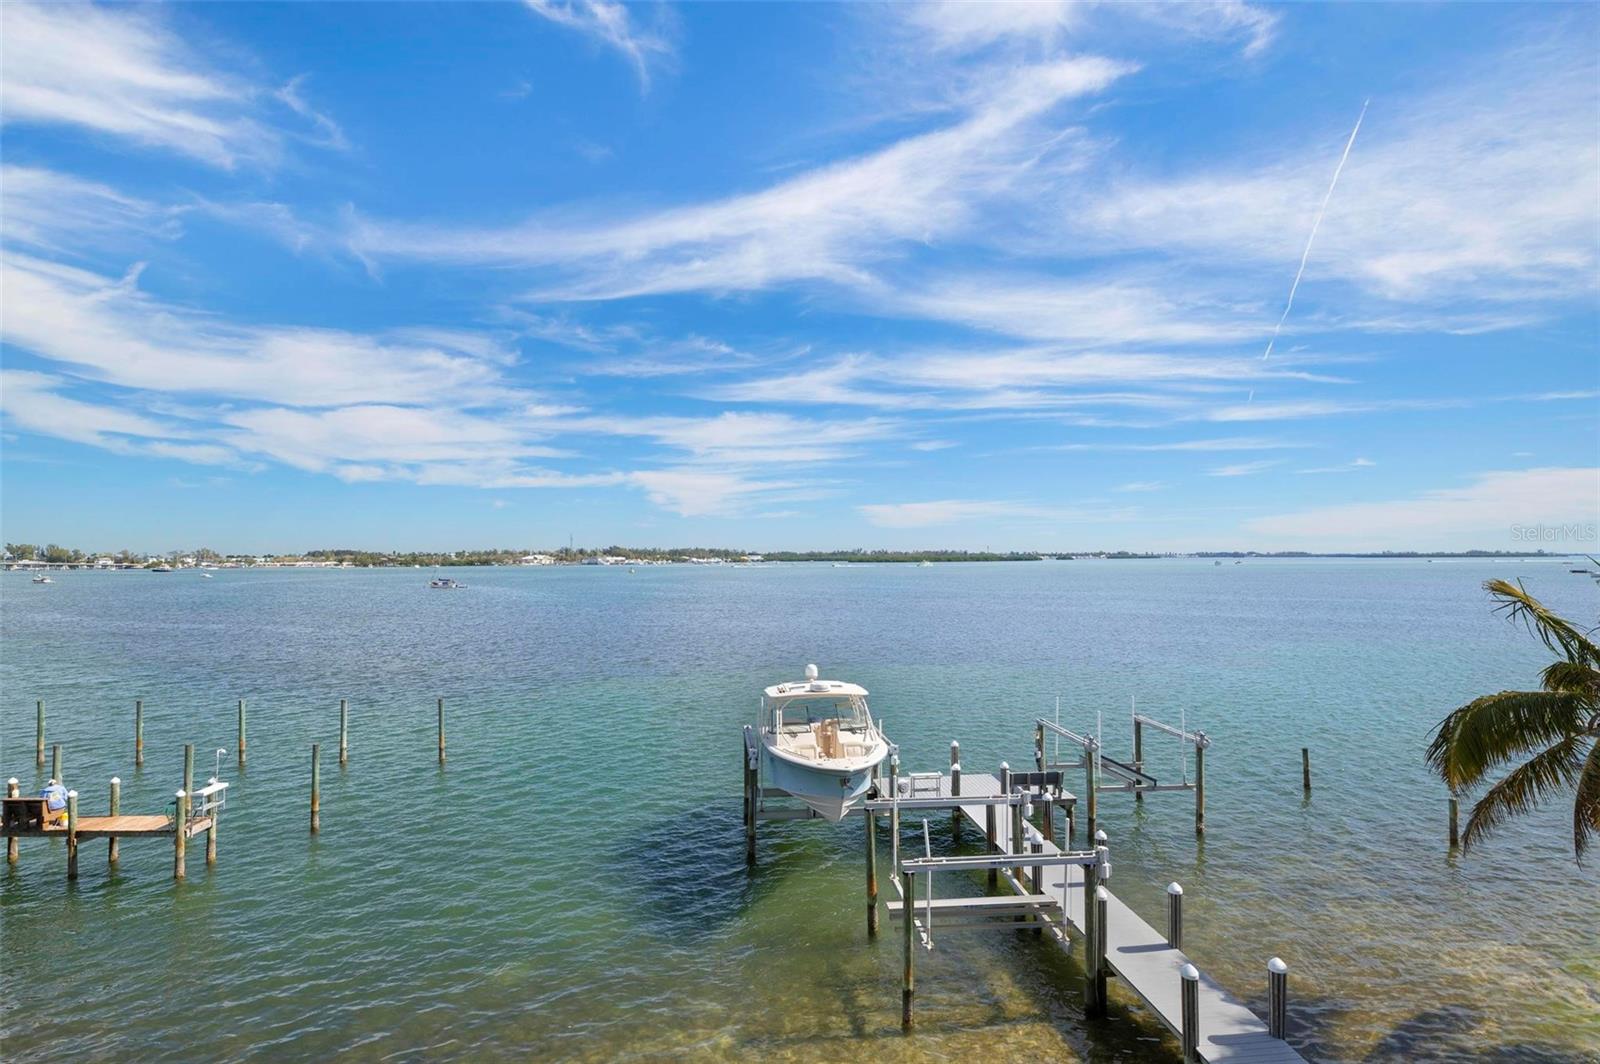
BEACH TO BAY VIEWS AND DIRECT BAYFRONT LIVING- Welcome to Mandalay Bay on Anna Maria Island! The savvy investor has the opportunity to maximize earnings with short-term rentals allowed. This home features a total of 8,747 square feet under roof and spectacular 360-degree views from the gulf of Mexico to the intracoastal waters! Relish the island lifestyle in this bayfront home, three houses to the beach and a short stroll to the azure waters of the gulf of Mexico! This high-end turnkey furnished home offers seven-bedrooms, five well-appointed bathrooms and two half baths. This property shares a rich variety of options for the discerning buyer. The family-oriented buyer can realize their dream of securing a bayfront family retreat while building a legacy for generational wealth or enjoy the income as a vacation rental property. A home built with artful design and decorated features such as stylish upscale finishes. The walls of glass doors showcase breathtaking views of the intracoastal waterfront. Fabulous glass doors from the main living area and almost every bedroom open to spacious balconies for entertaining and relaxing. With nearly 6,000 square feet of living space, the home includes a stylish primary bedroom with an en-suite luxurious bath and a soaking tub, and a walk-in shower/steam room. The home also features two full kitchens featuring beautiful cabinetry, marble countertops and high-end appliances, including gas ranges. This home includes a wonderful theater and game room including a pool table. Outdoors, enjoy the many amenities with a full outdoor kitchen, bar and dining table in the covered porch, a large heated pool, waterfall and spa including poolside seating areas for soaking in the breathtaking scenery. This property is complete with a dock, two boat lifts (20,000 and 7,500 lbs.) and a jet ski lift. Head up to the roof top deck with 360-degree views from beach to bay with plenty of seating. All just a short stroll to the beach, where you can glimpse the sunsets and mesmerizing changing colors at night. This home offers buyers the opportunity to own a fabulous one of kind bayfront estate that is a popular vacation rental. The home had $500,000 in new upgrades to the home, including 5 central heat and air units, new counter tops, new flooring, new garage doors, new tile around the pool, all new paint and wallpaper, light fixtures, furnishings, new washer and dryer and a beautiful home theater and game room for everyone to enjoy! Situated near the sugary sands of Anna Maria Island with the beautiful character of timeless architecture, this is a true bayfront oasis. Don’t miss an amazing opportunity to make this serene island sanctuary your own. Call for your private showing today!
Build Your Team
Quickly find investor-friendly professionals who can help you succeed in real estate investing at any stage of the investing journey.


Agents
Match with investor-friendly agents who can help you find, analyze, and close your next deal


Lenders
Get the best funding…find investor-friendly lenders who specialize in your deal strategy


Property Managers
Transition to passive investing. Find a trusted property management partnership that lasts.


Tax Pros & Accountants
Taxes and financial reporting made easy—find experts to create tax savings strategies, file taxes, and more
Location
Property Details
Parking
- Description: Attached Garage
- Details: Driveway, Garage Door Opener, Attached
- Garage Spaces: 2
- Spaces Total: 0
Bedroom Information
- # of Bedrooms: 7
Bathroom Information
- # of Baths (Full): 5
- # of Baths (Partial): 2
- # of Baths (Total): 7.0
Interior Features
- # of Rooms: 14
- # of Stories: 2
Exterior Features
- Exterior Walls Materials: Fiber cement siding (Hardi-board/Hardi-plank
- Roof Type: Gable or Hip
- Roof Material: Metal
- Pool: Yes
Land Information
- Land Use: Residential
- Land Use Subtype: Single Family Residential
Lot Information
- Parcel ID: 77511.00004
- Lot Size: 7802 sqft
Property Information
- Property Type: Single Family Residence
- Style: Elevated
- Year Built: 2015
Tax Information
- Annual Tax: $58,706
Utilities
- Water & Sewer: Public
- Heating: Central
- Cooling: Central Air
Location
- County: Manatee
Listing Details
Investment Summary
- Monthly Cash Flow
- -$44,474
- Cap Rate
- 0.1%
- Cash-on-Cash Return
- -26.1%
- Debt Coverage Ratio
- 0.02
- Internal Rate of Return (5 years)
- -21.1%
Cash Flow
Net Operating Income (NOI) minus mortgage payments.
Calculation:
NOI - Mortgage Payments
Cap Rate (Market Value)
Capitalization Rate is a rate of return that compares the yearly Net Operating Income (NOI) to the market value.
Calculation:
NOI / Market Value
Cash-on-Cash Return (CoC)
Annual Cash Flow / Cash Invested
Calculation:
Annual cash flow divided by initial cash invested.
Debt Coverage Ratio (DCR)
Net Operating Income (NOI) divided by total debt payments.
Calculation:
NOI / Total Debt Payments
Internal Rate of Return (IRR)
A metric for assessing profitability over time. IRR is the discount rate at which the net present value (NPV) of all future cash flows (positive and negative) from an investment equals zero — including both periodic cash flow (such as rent) and a projected sale at the end of the holding period. It represents the expected annualized return, accounting for income, expenses, and the recovery of capital through a future sale.
Purchase Details
Purchase PriceThe price paid for the property. Purchase price:
| $8,899,000 |
|---|---|
Amount FinancedThe amount of the purchase financed through a loan. Amount financed:
| -$7,119,200 |
Down paymentThe initial payment made towards the purchase. Down payment:
| $1,779,800 |
Closing CostsFees and expenses associated with purchasing a property, typically ranging from 2% to 5% of the home’s purchase price, paid at the end of a home purchase to cover services like lending, title transfer, and taxes. Closing costs:
| $266,970 |
Rehab CostsCosts incurred to repair or improve the property, including: roof, flooring, exterior siding, kitchen, exterior paint, bathrooms, etc. Rehab costs:
| $0 |
Initial Cash InvestedThe total initial cash invested in the property. Calculation:Down payment + Buying costs + Rehab costs Initial cash invested:
| $2,046,770 |
Square Feet (SQFT)The total square footage of the property. Square feet:
| 6,000 |
Cost Per Square FootCost per square foot of the property. Calculation:Purchase Price / Square Feet Cost per square foot:
| $1,483 |
Monthly Rent Per Square FootMonthly rent divided by the number of square feet. This ratio helps investors compare rental income efficiency across properties, markets, and unit sizes Calculation:Monthly Rent / Square Feet Monthly rent per square foot:
| $1.45 |
Financing Details
Loan AmountThe total sum of money borrowed from a lender to finance a property purchase. Calculation:Purchase Price - Down Payment
Loan amount:
| $7,119,200 |
|---|---|
Loan to Value Ratio (LTV)Loan amount divided by the market value of the property. Calculation:Loan Amount / Market Value
Loan to value ratio:
| 80.0% |
Loan TypeThe type of loan (e.g., fixed, adjustable).
Loan type:
| Amortizing |
TermThe loan repayment period in years.
Term:
| 30 years |
Interest RateThe percentage a lender charges on the borrowed amount of a loan, determining the cost of borrowing money.
Interest rate:
| 6.625% |
Principal & Interest (PI)The principal is the portion of the loan payment that reduces the loan balance. The interest is the lender's charge for borrowing money. Calculation:(P * r * (1 + r) ** n) / ((1 + r) ** n - 1) Where:
P = Loan amount (principal)
Principal & interest:
| $45,585 |
Property TaxesAnnual taxes levied by local governments on real estate properties. These taxes fund public services like schools, roads, and emergency services.
Property tax:
| $4,892 |
InsuranceThe costs for insurance coverage to protect against financial losses due to risks like fire, natural disasters, theft, liability, or tenant-related damages. Calculation:Assumes 7% of gross rental income, unless insurance rates are specified.
Insurance:
| $609 |
Private Mortgage Insurance (PMI)A fee that borrowers pay when they take out a conventional loan with a loan-to-value (LTV) ratio above 80%.
Private mortgage insurance (PMI):
| $0 |
Monthly PaymentThe fixed amount a borrower pays each month to repay a loan. It typically includes principal and interest (P&I) and may also cover property taxes, insurance, HOA fees, and PMI if escrowed. Monthly payment:
| $51,086 |
Operating Income
| % Rent | Monthly | Yearly | |
|---|---|---|---|
Gross RentThe total rental income received from tenants before deducting any expenses. Includes base rent, late fees, pet fees, parking fees, and other recurring charges.
Gross rent:
| $8,700 | $104,400 | |
Vacancy LossExpected loss of rent due to vacancies.
Vacancy loss:
(6%)
| 6% | -$522 | -$6,264 |
Operating IncomeGross rental income minus vacancy loss. Calculation:Gross rent - Vacancy loss
Operating income:
| $8,178 | $98,136 |
Operating Expenses
| % Rent | Monthly | Yearly | |
|---|---|---|---|
Property TaxesAnnual taxes levied by local governments on real estate properties. These taxes fund public services like schools, roads, and emergency services. | 56% | -$4,892 | -$58,706 |
InsuranceThe costs for insurance coverage to protect against financial losses due to risks like fire, natural disasters, theft, liability, or tenant-related damages. Calculation:Assumes 7% of gross rental income, unless insurance rates are specified. | 7% | -$609 | -$7,308 |
Property ManagementThe costs associated with hiring a property manager to handle the day-to-day operations of a rental property. Includes management fees, leasing fes, eviction fees, etc. Calculation:Assumes 8% of gross rental income. | 8% | -$696 | -$8,352 |
Repairs & MaintenanceOngoing costs for routine upkeep and minor fixes needed to keep a property in good working condition. Calculation:Assumes 5% of gross rental income. Varies by property age and condition. | 5% | -$435 | -$5,220 |
Capital ExpensesLarge, infrequent costs for major improvements or replacements, like a new roof, HVAC system, or appliances. Calculation:Assumes 5% of gross rental income. Varies by property age. | 5% | -$435 | -$5,220 |
HOA FeesRegular dues paid to a Homeowners Association for community maintenance, amenities, and management. Similar fees include: Condo Association Fees, Co-op Maintenance Fees, etc. | n/a | n/a | n/a |
Operating ExpensesRecurring costs required to maintain and manage a rental property, including property taxes, insurance, maintenance, repairs, utilities (if paid by the owner), property management fees, and other day-to-day expenses. Calculation:Insurance + Property Taxes + Property Management + Repairs & Maintenance + Capital Expenditures + HOA Fees | 81% | -$7,067 | -$84,806 |
Cash Flow
| Monthly | Yearly | |
|---|---|---|
Net Operating Income (NOI)The income generated from a property after deducting all operating expenses but before deducting mortgage payments, taxes, and capital expenditures. Calculation:Gross Operating Income - Operating Expenses
Net operating income:
| $1,111 | $13,332 |
Mortgage PaymentThe fixed amount a borrower pays each month to repay a loan. It typically includes principal and interest (P&I) and may also cover property taxes, insurance, HOA fees, and PMI if escrowed. | -$45,585 | -$547,020 |
Cash FlowNet Operating Income (NOI) minus mortgage payments. Calculation:NOI - Mortgage Payments | -$44,474 | -$533,688 |