$770,000
Investment Summary
- Monthly Cash Flow
- -$1,800
- Cap Rate
- 3.3%
- Cash-on-Cash Return
- -12.2%
- Debt Coverage Ratio
- 0.54
- Internal Rate of Return (5 years)
- -7.8%
Cash Flow
Net Operating Income (NOI) minus mortgage payments.
Calculation:
NOI - Mortgage Payments
Cap Rate (Market Value)
Capitalization Rate is a rate of return that compares the yearly Net Operating Income (NOI) to the market value.
Calculation:
NOI / Market Value
Cash-on-Cash Return (CoC)
Annual Cash Flow / Cash Invested
Calculation:
Annual cash flow divided by initial cash invested.
Debt Coverage Ratio (DCR)
Net Operating Income (NOI) divided by total debt payments.
Calculation:
NOI / Total Debt Payments
Internal Rate of Return (IRR)
A metric for assessing profitability over time. IRR is the discount rate at which the net present value (NPV) of all future cash flows (positive and negative) from an investment equals zero — including both periodic cash flow (such as rent) and a projected sale at the end of the holding period. It represents the expected annualized return, accounting for income, expenses, and the recovery of capital through a future sale.
Property Description
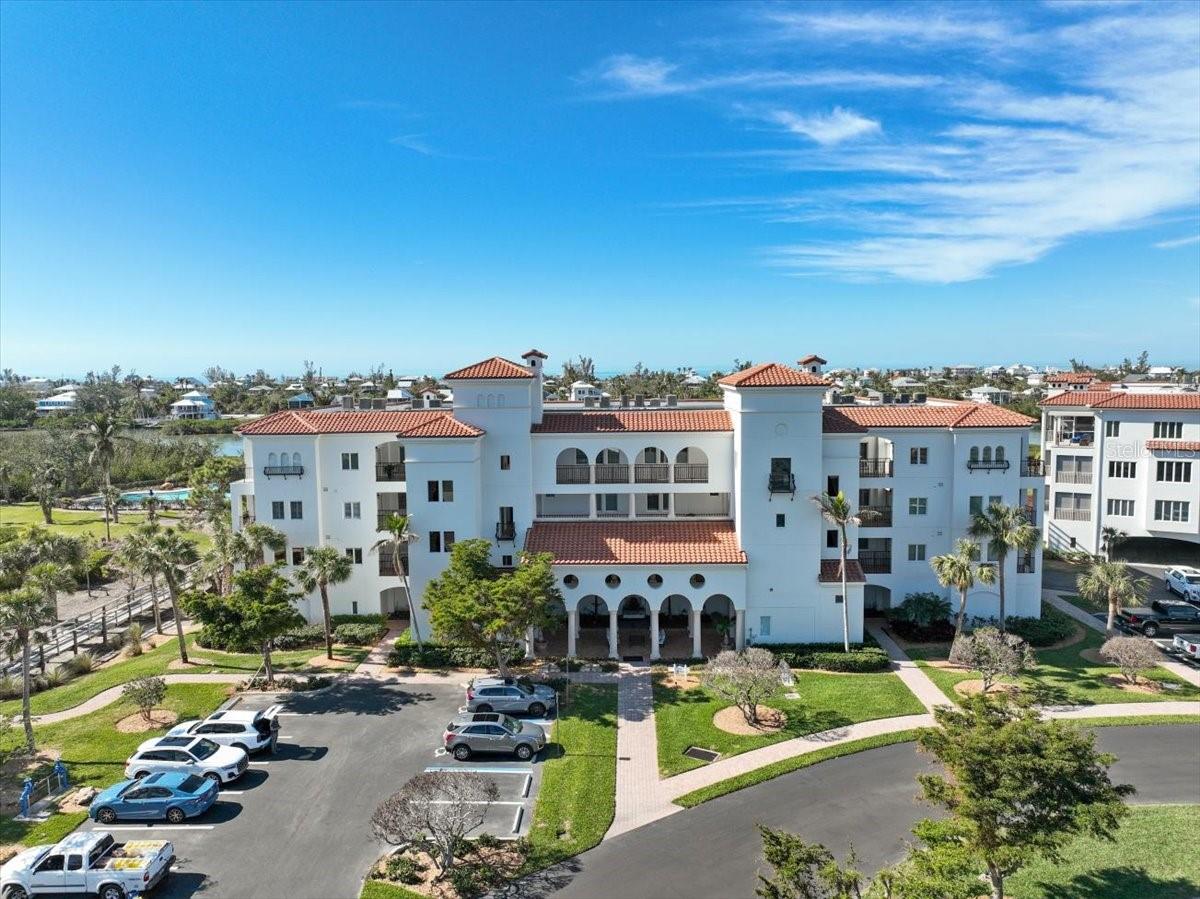
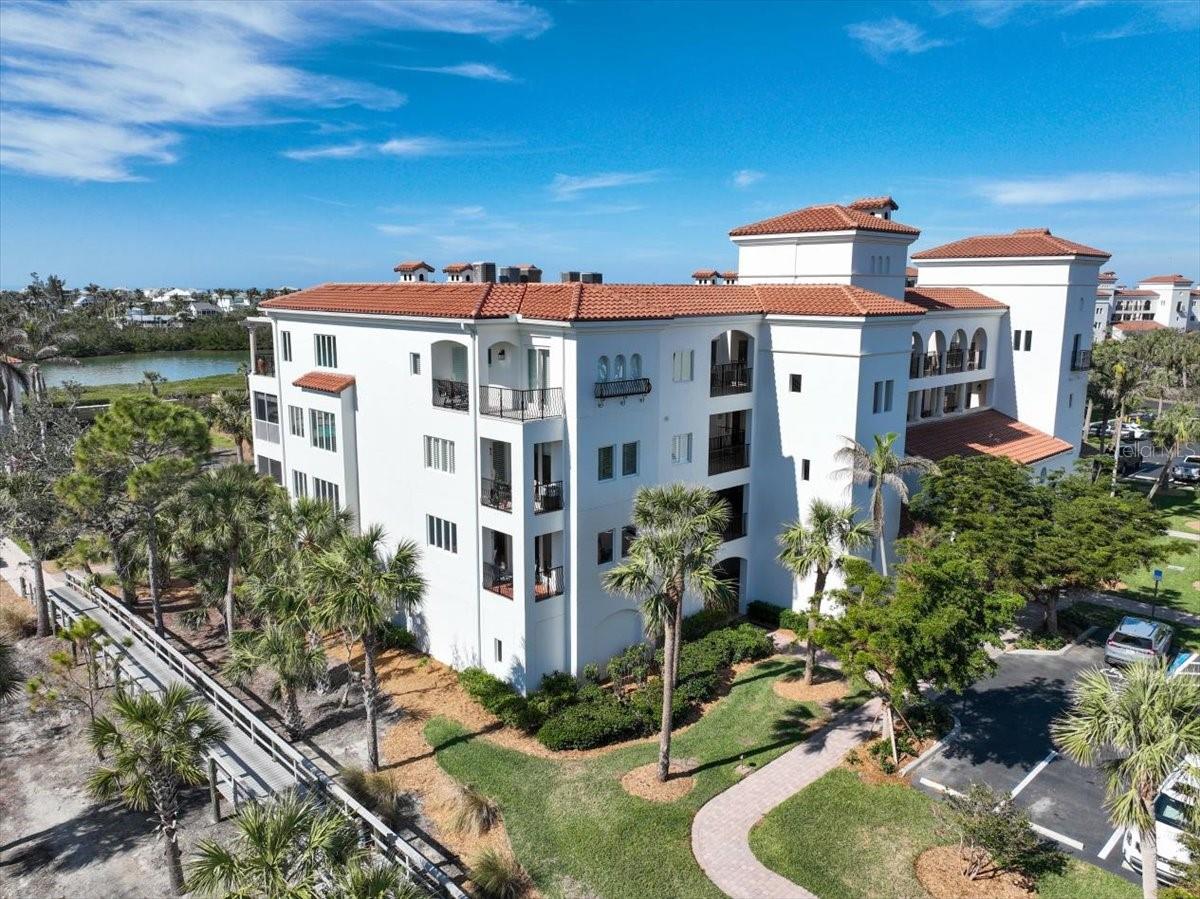
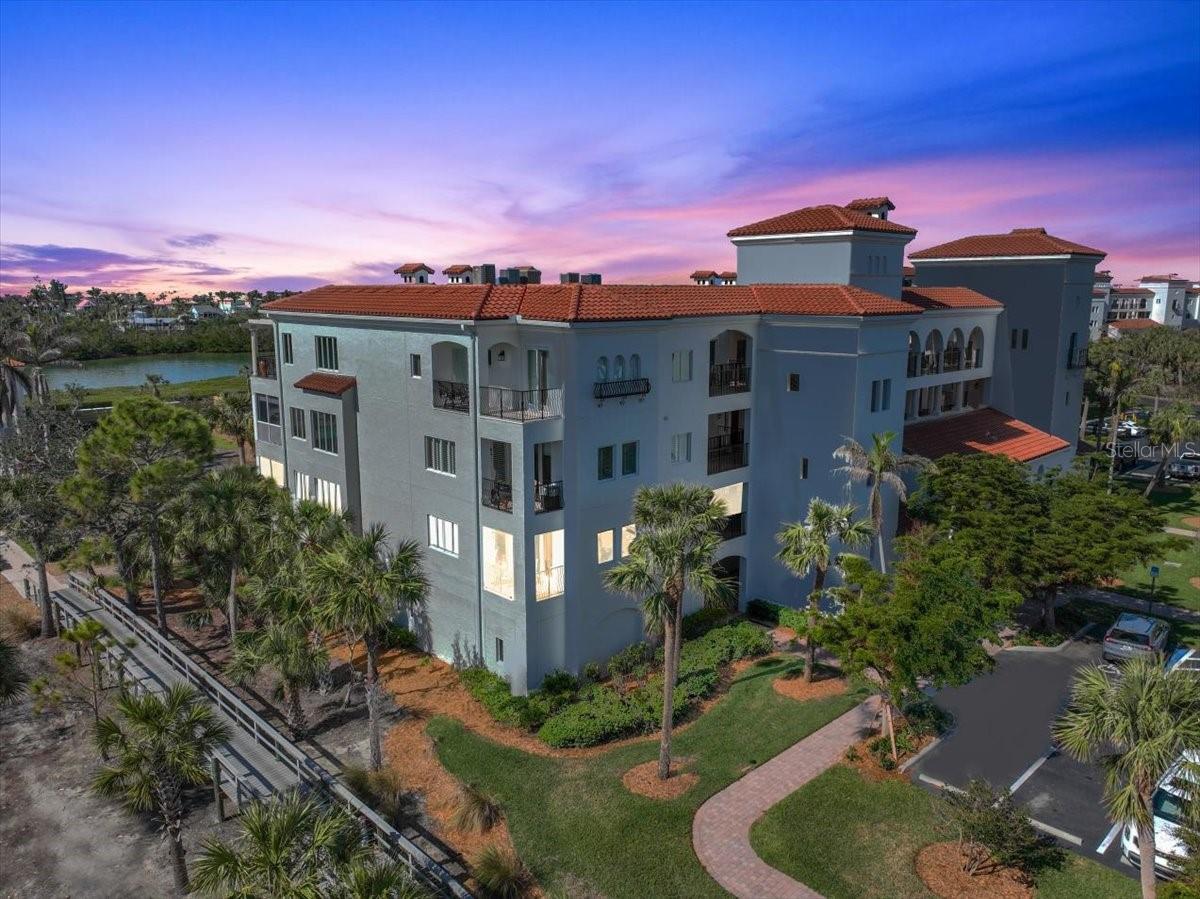
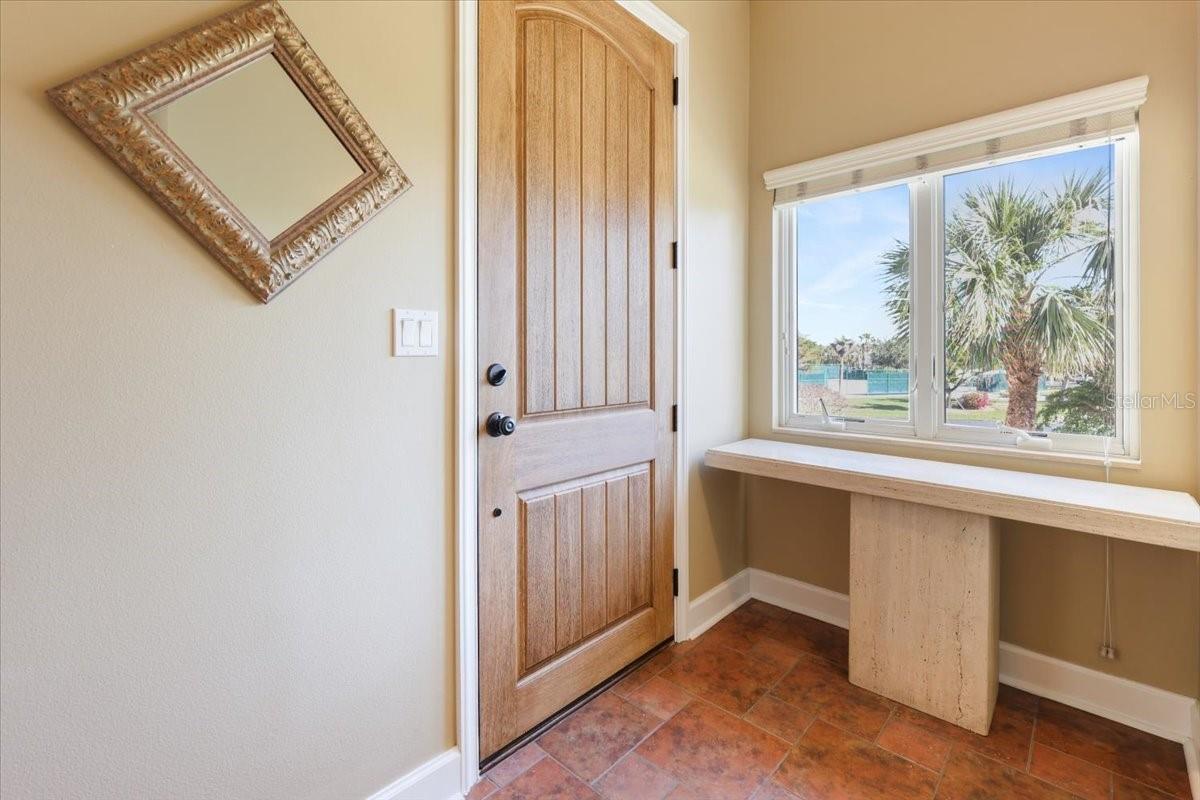
Discover the ultimate in luxury living at Hacienda Del Mar, a premier resort-style condominium community located directly on the Intracoastal Waterway, just across from Palm Island and the Gulf of Mexico. This exclusive community is designed for those who seek an unparalleled blend of elegance, convenience, and natural beauty. Connected to Nature and Recreation Hacienda Del Mar is surrounded by a network of parks and recreational opportunities, connected by sidewalks and walking/bike trails. Enjoy easy access to: Cape Haze Pioneer Trail & Park Don Pedro Island State Park Wildflower Lemon Bay Conservancy Preserve Walking Trails Amberjack Environmental Park Boca Grande Island Rail Trail & Beaches All of these destinations are within approximately three miles, offering endless opportunities for outdoor adventures and serene escapes. World-Class Amenities This waterfront community is rich in amenities that elevate everyday living: Fishing Pier and Community Dock: Perfect for easy pick-up and drop-off or casting a line. Two Swimming Pools: Cooled and heated, complete with a pool house ideal for entertaining. Dog Park: A dedicated space for your furry friends to play. Fitness Center and Clubhouse: Designed to keep you active and connected. Covered Parking: Offering convenience and protection. Lush Grounds: Beautifully maintained landscaping with mature trees, vibrant flowers, and serene walking paths teeming with wildlife. Rare Three-Bedroom End Unit This highly sought-after three-bedroom end unit combines modern elegance with over 2,000 square feet of air-conditioned living space. Designed to maximize natural light and showcase breathtaking Intracoastal views, this home redefines luxury condo living. Key Features of the Residence Spacious Layout: The open floor plan includes three bedrooms and 2.5 bathrooms, offering ample space for entertaining and hosting guests. The design feels airy and inviting, reminiscent of a single-family home. Master Suite: The luxurious master bedroom opens to the rear lanai, providing stunning Intracoastal views. The suite features a large walk-in closet and an oversized bathroom with a soaking tub, walk-in shower, dual vanities, and hurricane impact-resistant windows and doors. Additional Bedrooms: Bedroom two, currently used as a home office, and bedroom three share a private balcony and a convenient Jack-and-Jill bathroom. Chef’s Kitchen: Equipped with solid wood cabinets, granite countertops, and stainless steel appliances, the kitchen also offers scenic views, making meal prep a delight. Expansive Rear Balcony: Measuring approximately 15’ x 30’, the rear balcony is perfect for outdoor Florida living. Multiple seating areas allow you to enjoy sunsets, and the outdoor kitchen adds convenience for hosting and entertaining. Experience the Hacienda Del Mar Lifestyle Every detail at Hacienda Del Mar is thoughtfully designed to create a relaxed yet elegant lifestyle. Don’t miss this rare opportunity to own a stunning three-bedroom end unit in this highly coveted waterfront community. Embrace the best of Florida living today.
Build Your Team
Quickly find investor-friendly professionals who can help you succeed in real estate investing at any stage of the investing journey.


Agents
Match with investor-friendly agents who can help you find, analyze, and close your next deal


Lenders
Get the best funding…find investor-friendly lenders who specialize in your deal strategy


Property Managers
Transition to passive investing. Find a trusted property management partnership that lasts.


Tax Pros & Accountants
Taxes and financial reporting made easy—find experts to create tax savings strategies, file taxes, and more
Location
Property Details
Parking
- Description: Garage
- Details: Attached
- Garage Spaces: 1
- Spaces Total: 0
Bedroom Information
- # of Bedrooms: 3
Bathroom Information
- # of Baths (Full): 2
- # of Baths (Partial): 1
- # of Baths (Total): 3.0
Interior Features
- # of Rooms: 5
- # of Stories: 4
Exterior Features
- Foundation: Pillar/Post/Pier
- Roof Material: Other
HOA
- Has HOA: Yes
- Association: no
- HOA Fee: $4,259/quarterly
Land Information
- Land Use: Residential
- Land Use Subtype: Condominium Unit
Lot Information
- Parcel ID: 412033676017
- Lot Size: 2390 sqft
Property Information
- Property Type: Condominium
- Year Built: 2006
Tax Information
- Annual Tax: $5,261
Utilities
- Water & Sewer: Public
- Heating: Central
- Cooling: Central Air
Location
- County: Charlotte
Listing Details
Investment Summary
- Monthly Cash Flow
- -$1,800
- Cap Rate
- 3.3%
- Cash-on-Cash Return
- -12.2%
- Debt Coverage Ratio
- 0.54
- Internal Rate of Return (5 years)
- -7.8%
Cash Flow
Net Operating Income (NOI) minus mortgage payments.
Calculation:
NOI - Mortgage Payments
Cap Rate (Market Value)
Capitalization Rate is a rate of return that compares the yearly Net Operating Income (NOI) to the market value.
Calculation:
NOI / Market Value
Cash-on-Cash Return (CoC)
Annual Cash Flow / Cash Invested
Calculation:
Annual cash flow divided by initial cash invested.
Debt Coverage Ratio (DCR)
Net Operating Income (NOI) divided by total debt payments.
Calculation:
NOI / Total Debt Payments
Internal Rate of Return (IRR)
A metric for assessing profitability over time. IRR is the discount rate at which the net present value (NPV) of all future cash flows (positive and negative) from an investment equals zero — including both periodic cash flow (such as rent) and a projected sale at the end of the holding period. It represents the expected annualized return, accounting for income, expenses, and the recovery of capital through a future sale.
Purchase Details
Purchase PriceThe price paid for the property. Purchase price:
| $770,000 |
|---|---|
Amount FinancedThe amount of the purchase financed through a loan. Amount financed:
| -$616,000 |
Down paymentThe initial payment made towards the purchase. Down payment:
| $154,000 |
Closing CostsFees and expenses associated with purchasing a property, typically ranging from 2% to 5% of the home’s purchase price, paid at the end of a home purchase to cover services like lending, title transfer, and taxes. Closing costs:
| $23,100 |
Rehab CostsCosts incurred to repair or improve the property, including: roof, flooring, exterior siding, kitchen, exterior paint, bathrooms, etc. Rehab costs:
| $0 |
Initial Cash InvestedThe total initial cash invested in the property. Calculation:Down payment + Buying costs + Rehab costs Initial cash invested:
| $177,100 |
Square Feet (SQFT)The total square footage of the property. Square feet:
| 2,013 |
Cost Per Square FootCost per square foot of the property. Calculation:Purchase Price / Square Feet Cost per square foot:
| $383 |
Monthly Rent Per Square FootMonthly rent divided by the number of square feet. This ratio helps investors compare rental income efficiency across properties, markets, and unit sizes Calculation:Monthly Rent / Square Feet Monthly rent per square foot:
| $2.88 |
Financing Details
Loan AmountThe total sum of money borrowed from a lender to finance a property purchase. Calculation:Purchase Price - Down Payment
Loan amount:
| $616,000 |
|---|---|
Loan to Value Ratio (LTV)Loan amount divided by the market value of the property. Calculation:Loan Amount / Market Value
Loan to value ratio:
| 80.0% |
Loan TypeThe type of loan (e.g., fixed, adjustable).
Loan type:
| Amortizing |
TermThe loan repayment period in years.
Term:
| 30 years |
Interest RateThe percentage a lender charges on the borrowed amount of a loan, determining the cost of borrowing money.
Interest rate:
| 6.625% |
Principal & Interest (PI)The principal is the portion of the loan payment that reduces the loan balance. The interest is the lender's charge for borrowing money. Calculation:(P * r * (1 + r) ** n) / ((1 + r) ** n - 1) Where:
P = Loan amount (principal)
Principal & interest:
| $3,944 |
Property TaxesAnnual taxes levied by local governments on real estate properties. These taxes fund public services like schools, roads, and emergency services.
Property tax:
| $438 |
InsuranceThe costs for insurance coverage to protect against financial losses due to risks like fire, natural disasters, theft, liability, or tenant-related damages. Calculation:Assumes 7% of gross rental income, unless insurance rates are specified.
Insurance:
| $406 |
Private Mortgage Insurance (PMI)A fee that borrowers pay when they take out a conventional loan with a loan-to-value (LTV) ratio above 80%.
Private mortgage insurance (PMI):
| $0 |
Monthly PaymentThe fixed amount a borrower pays each month to repay a loan. It typically includes principal and interest (P&I) and may also cover property taxes, insurance, HOA fees, and PMI if escrowed. Monthly payment:
| $4,788 |
Operating Income
| % Rent | Monthly | Yearly | |
|---|---|---|---|
Gross RentThe total rental income received from tenants before deducting any expenses. Includes base rent, late fees, pet fees, parking fees, and other recurring charges.
Gross rent:
| $5,800 | $69,600 | |
Vacancy LossExpected loss of rent due to vacancies.
Vacancy loss:
(6%)
| 6% | -$348 | -$4,176 |
Operating IncomeGross rental income minus vacancy loss. Calculation:Gross rent - Vacancy loss
Operating income:
| $5,452 | $65,424 |
Operating Expenses
| % Rent | Monthly | Yearly | |
|---|---|---|---|
Property TaxesAnnual taxes levied by local governments on real estate properties. These taxes fund public services like schools, roads, and emergency services. | 8% | -$438 | -$5,261 |
InsuranceThe costs for insurance coverage to protect against financial losses due to risks like fire, natural disasters, theft, liability, or tenant-related damages. Calculation:Assumes 7% of gross rental income, unless insurance rates are specified. | 7% | -$406 | -$4,872 |
Property ManagementThe costs associated with hiring a property manager to handle the day-to-day operations of a rental property. Includes management fees, leasing fes, eviction fees, etc. Calculation:Assumes 8% of gross rental income. | 8% | -$464 | -$5,568 |
Repairs & MaintenanceOngoing costs for routine upkeep and minor fixes needed to keep a property in good working condition. Calculation:Assumes 5% of gross rental income. Varies by property age and condition. | 5% | -$290 | -$3,480 |
Capital ExpensesLarge, infrequent costs for major improvements or replacements, like a new roof, HVAC system, or appliances. Calculation:Assumes 5% of gross rental income. Varies by property age. | 5% | -$290 | -$3,480 |
HOA FeesRegular dues paid to a Homeowners Association for community maintenance, amenities, and management. Similar fees include: Condo Association Fees, Co-op Maintenance Fees, etc. | 24% | -$1,420 | -$17,040 |
Operating ExpensesRecurring costs required to maintain and manage a rental property, including property taxes, insurance, maintenance, repairs, utilities (if paid by the owner), property management fees, and other day-to-day expenses. Calculation:Insurance + Property Taxes + Property Management + Repairs & Maintenance + Capital Expenditures + HOA Fees | 57% | -$3,308 | -$39,701 |
Cash Flow
| Monthly | Yearly | |
|---|---|---|
Net Operating Income (NOI)The income generated from a property after deducting all operating expenses but before deducting mortgage payments, taxes, and capital expenditures. Calculation:Gross Operating Income - Operating Expenses
Net operating income:
| $2,144 | $25,728 |
Mortgage PaymentThe fixed amount a borrower pays each month to repay a loan. It typically includes principal and interest (P&I) and may also cover property taxes, insurance, HOA fees, and PMI if escrowed. | -$3,944 | -$47,328 |
Cash FlowNet Operating Income (NOI) minus mortgage payments. Calculation:NOI - Mortgage Payments | $1,800 | $21,600 |