
$560,000
Investment Summary
- Monthly Cash Flow
- -$1,360
- Cap Rate
- 2.8%
- Cash-on-Cash Return
- -12.7%
- Debt Coverage Ratio
- 0.49
- Internal Rate of Return (5 years)
- -8.3%
Cash Flow
Net Operating Income (NOI) minus mortgage payments.
Calculation:
NOI - Mortgage Payments
Cap Rate (Market Value)
Capitalization Rate is a rate of return that compares the yearly Net Operating Income (NOI) to the market value.
Calculation:
NOI / Market Value
Cash-on-Cash Return (CoC)
Annual Cash Flow / Cash Invested
Calculation:
Annual cash flow divided by initial cash invested.
Debt Coverage Ratio (DCR)
Net Operating Income (NOI) divided by total debt payments.
Calculation:
NOI / Total Debt Payments
Internal Rate of Return (IRR)
A metric for assessing profitability over time. IRR is the discount rate at which the net present value (NPV) of all future cash flows (positive and negative) from an investment equals zero — including both periodic cash flow (such as rent) and a projected sale at the end of the holding period. It represents the expected annualized return, accounting for income, expenses, and the recovery of capital through a future sale.
Property Description
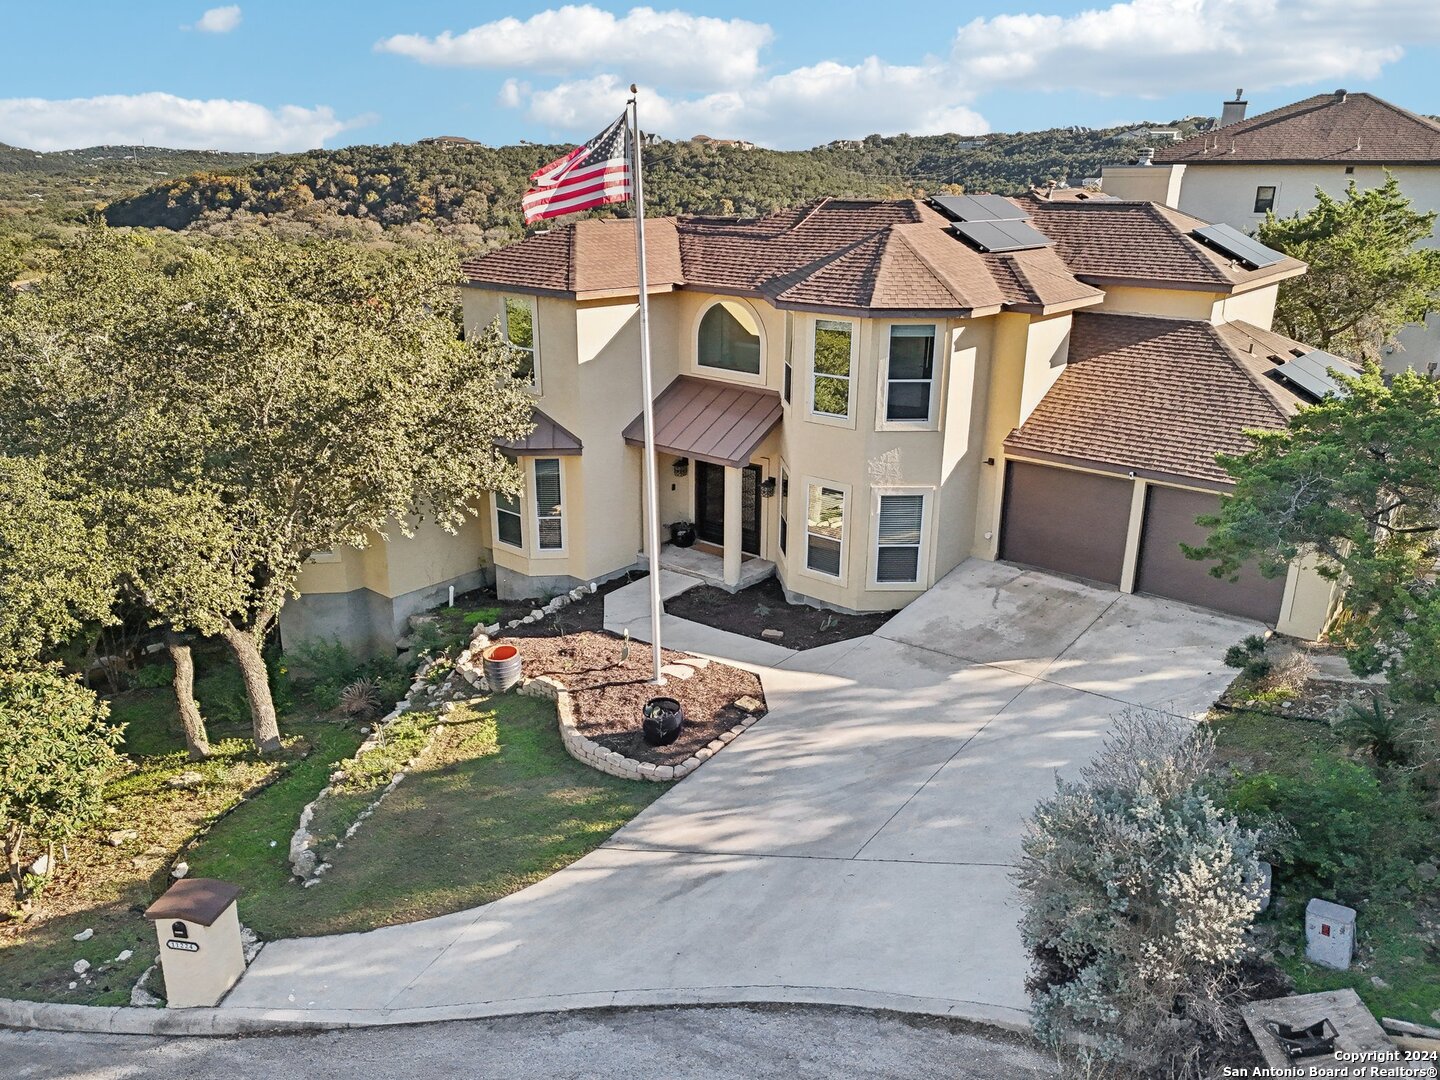
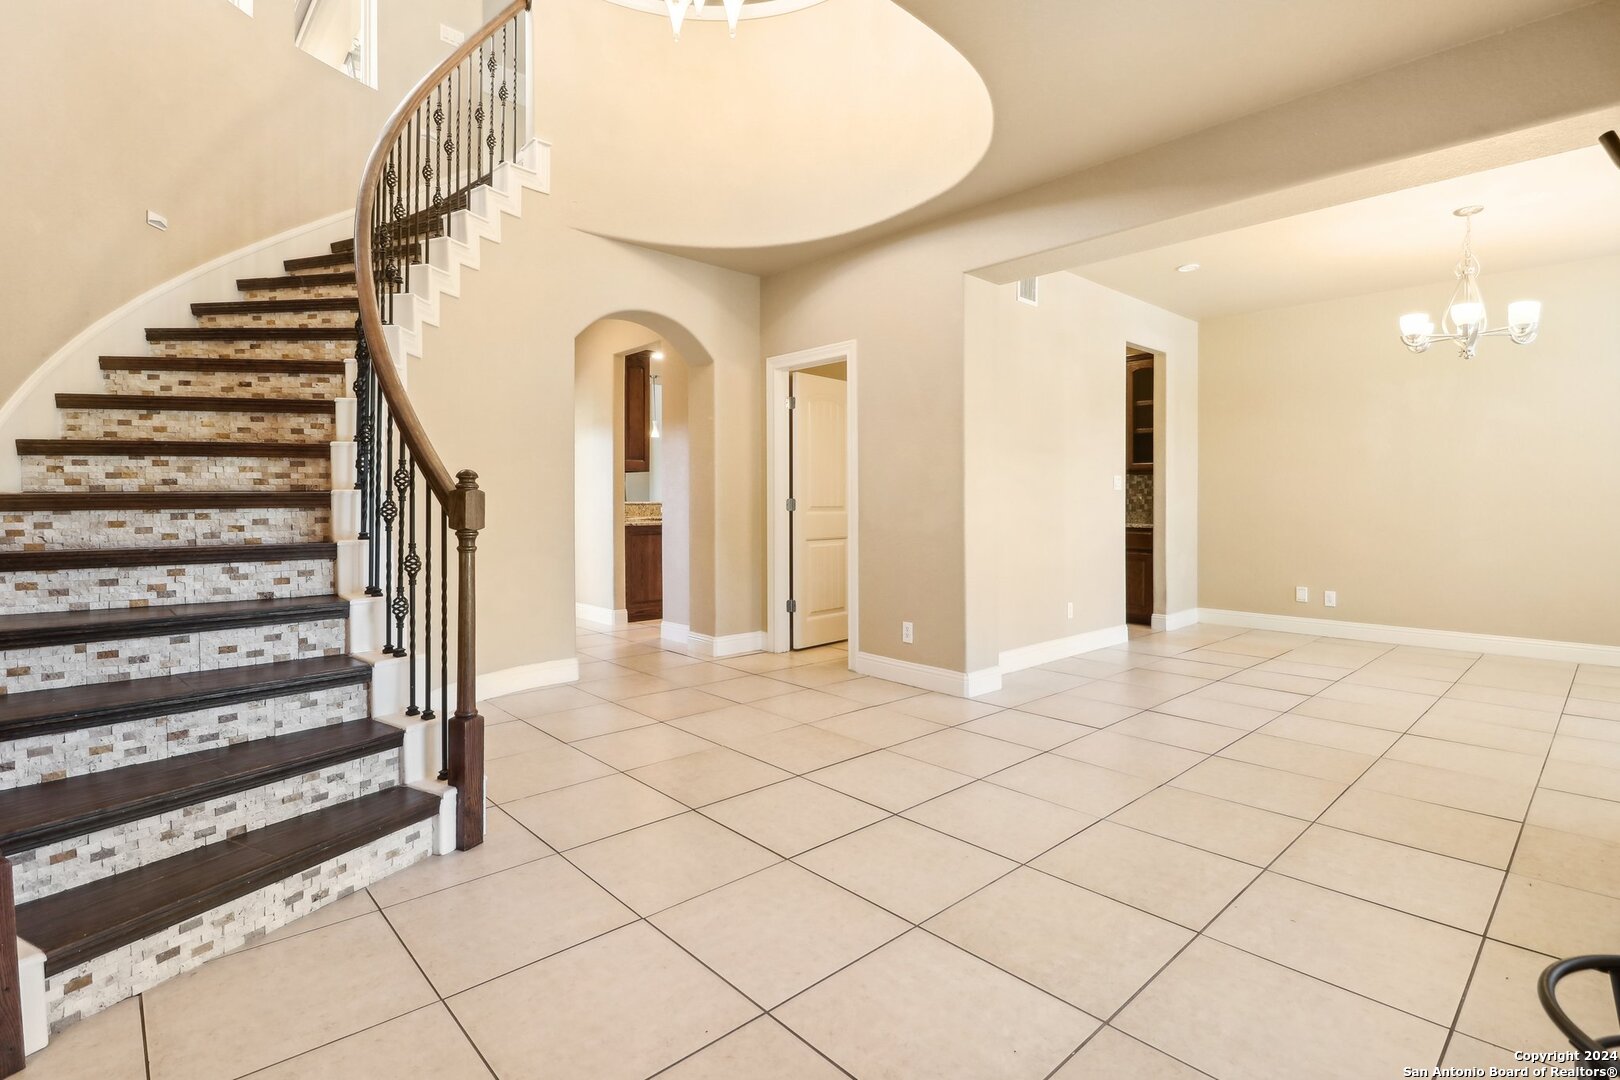
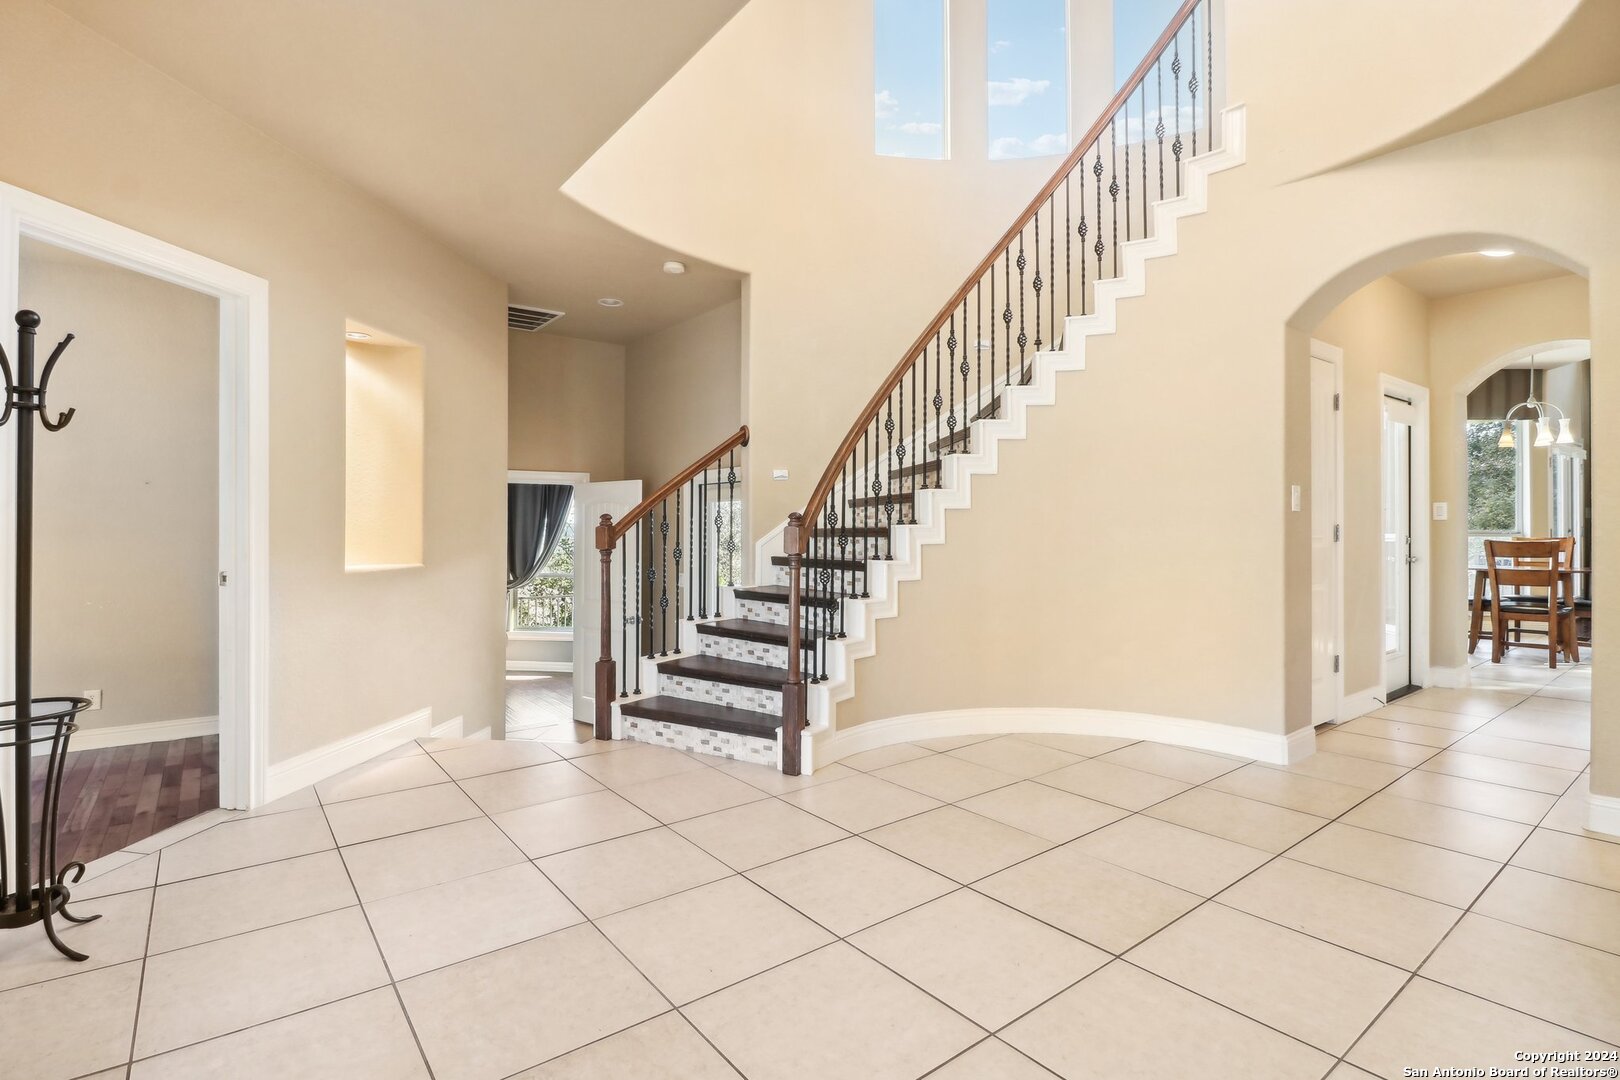
**VA Assumable 3.25% Interest Rate!** If unobstructed panoramic views of the Texas Hill Country are your style, this custom-built Ted Trautner masterpiece is exactly what you've been waiting for. Perched atop a private hilltop cul-de-sac, this home combines timeless elegance with modern functionality, offering not only incredible vistas but also a lifestyle of unmatched sophistication. As you step into the grand foyer, you're greeted by soaring 20+ foot ceilings, a stunning chandelier, and a magnificent curved staircase bathed in cascading light from the upstairs balcony. Every detail, from the moment you enter, sets the tone for a home designed to impress. This property features two dining spaces-perfect for hosting intimate dinners in the formal dining room or enjoying casual meals in the informal area. The kitchen is a chef's dream, featuring a butler's pantry and wine bar that leads to a beautifully appointed space with a gas-burning cooktop, stacked microwave and oven, and a large bar that seamlessly connects to the living room. The living room, with its grand ceilings and expansive windows, flows effortlessly into the outdoor spaces, ensuring that every corner of the home takes full advantage of its breathtaking surroundings. The gas fireplace is the highlight of the living room space. Just off the living room, a breezeway leads you to the primary bedroom suite, a true retreat with bay windows inviting natural light and serene backyard views. The en-suite bathroom offers dual vanities, separate walk-in closets, a spacious shower, and a jet spa tub perfect for unwinding after a long day. Heading upstairs, the curved staircase guides you with its elegant cascade of light to a spacious loft that opens onto a private deck with sweeping views of the Hill Country. Whether it's a sunrise coffee or a sunset toast, this space is designed for moments that take your breath away. The additional bedrooms are equally inviting, offering ample space and privacy, with two of the three featuring en-suite bathrooms. This home is as functional as it is luxurious, boasting features like a centralized vacuum system for effortless maintenance and thoughtful details throughout. But it doesn't stop there-this property is being sold with the option to purchase the adjacent lot next door at 11228 Cave Creek (MLS 1829503), offering endless possibilities. Dreaming of a summer oasis? Build the ultimate pool house and take entertaining to the next level. Need a detached in-law suite or private guest house? There's plenty of room to bring your vision to life. This is more than a home-it's an opportunity to live the lifestyle you've always dreamed of. And with a VA Assumable Loan at an incredible 3.25% interest rate, this is a rare chance to combine luxury living with unbeatable financing. Don't miss this Texas Hill Country treasure. You simply MUSt see what makes this home truly extraordinary!
Build Your Team
Quickly find investor-friendly professionals who can help you succeed in real estate investing at any stage of the investing journey.


Agents
Match with investor-friendly agents who can help you find, analyze, and close your next deal


Lenders
Get the best funding…find investor-friendly lenders who specialize in your deal strategy


Property Managers
Transition to passive investing. Find a trusted property management partnership that lasts.


Tax Pros & Accountants
Taxes and financial reporting made easy—find experts to create tax savings strategies, file taxes, and more
Location
Property Details
Parking
- Description: Two Car Garage
- Details: Garage Door Opener, Garage
- Garage Spaces: 2
- Spaces Total: 0
Bedroom Information
- # of Bedrooms: 4
Bathroom Information
- # of Baths (Full): 3
- # of Baths (Partial): 1
- # of Baths (Total): 4.0
Interior Features
- # of Rooms: 8
- # of Stories: 2
- Fireplace: Yes
Exterior Features
- Exterior Walls Materials: Stucco
- Foundation: Slab
- Roof Material: Composition
HOA
- Has HOA: Yes
- Association: SAN ANTONIO RANCH HOMEOWNERS ASSOCIATION
- HOA Fee: $465/annually
Land Information
- Land Use: Residential
- Land Use Subtype: Single Family Residential
Lot Information
- Parcel ID: 045561100990
- Lot Size: 0 sqft
Property Information
- Property Type: Single Family Residence
- Style: Two Story, Spanish
- Year Built: 2005
Tax Information
- Annual Tax: $13,855
Utilities
- Heating: Central, Natural Gas
- Cooling: Ceiling Fan(s), Central Air
Location
- County: Bexar
Listing Details
Investment Summary
- Monthly Cash Flow
- -$1,360
- Cap Rate
- 2.8%
- Cash-on-Cash Return
- -12.7%
- Debt Coverage Ratio
- 0.49
- Internal Rate of Return (5 years)
- -8.3%
Cash Flow
Net Operating Income (NOI) minus mortgage payments.
Calculation:
NOI - Mortgage Payments
Cap Rate (Market Value)
Capitalization Rate is a rate of return that compares the yearly Net Operating Income (NOI) to the market value.
Calculation:
NOI / Market Value
Cash-on-Cash Return (CoC)
Annual Cash Flow / Cash Invested
Calculation:
Annual cash flow divided by initial cash invested.
Debt Coverage Ratio (DCR)
Net Operating Income (NOI) divided by total debt payments.
Calculation:
NOI / Total Debt Payments
Internal Rate of Return (IRR)
A metric for assessing profitability over time. IRR is the discount rate at which the net present value (NPV) of all future cash flows (positive and negative) from an investment equals zero — including both periodic cash flow (such as rent) and a projected sale at the end of the holding period. It represents the expected annualized return, accounting for income, expenses, and the recovery of capital through a future sale.
Purchase Details
Purchase PriceThe price paid for the property. Purchase price:
| $560,000 |
|---|---|
Amount FinancedThe amount of the purchase financed through a loan. Amount financed:
| -$448,000 |
Down paymentThe initial payment made towards the purchase. Down payment:
| $112,000 |
Closing CostsFees and expenses associated with purchasing a property, typically ranging from 2% to 5% of the home’s purchase price, paid at the end of a home purchase to cover services like lending, title transfer, and taxes. Closing costs:
| $16,800 |
Rehab CostsCosts incurred to repair or improve the property, including: roof, flooring, exterior siding, kitchen, exterior paint, bathrooms, etc. Rehab costs:
| $0 |
Initial Cash InvestedThe total initial cash invested in the property. Calculation:Down payment + Buying costs + Rehab costs Initial cash invested:
| $128,800 |
Square Feet (SQFT)The total square footage of the property. Square feet:
| 3,069 |
Cost Per Square FootCost per square foot of the property. Calculation:Purchase Price / Square Feet Cost per square foot:
| $182 |
Monthly Rent Per Square FootMonthly rent divided by the number of square feet. This ratio helps investors compare rental income efficiency across properties, markets, and unit sizes Calculation:Monthly Rent / Square Feet Monthly rent per square foot:
| $1.17 |
Financing Details
Loan AmountThe total sum of money borrowed from a lender to finance a property purchase. Calculation:Purchase Price - Down Payment
Loan amount:
| $448,000 |
|---|---|
Loan to Value Ratio (LTV)Loan amount divided by the market value of the property. Calculation:Loan Amount / Market Value
Loan to value ratio:
| 80.0% |
Loan TypeThe type of loan (e.g., fixed, adjustable).
Loan type:
| Amortizing |
TermThe loan repayment period in years.
Term:
| 30 years |
Interest RateThe percentage a lender charges on the borrowed amount of a loan, determining the cost of borrowing money.
Interest rate:
| 5.875% |
Principal & Interest (PI)The principal is the portion of the loan payment that reduces the loan balance. The interest is the lender's charge for borrowing money. Calculation:(P * r * (1 + r) ** n) / ((1 + r) ** n - 1) Where:
P = Loan amount (principal)
Principal & interest:
| $2,650 |
Property TaxesAnnual taxes levied by local governments on real estate properties. These taxes fund public services like schools, roads, and emergency services.
Property tax:
| $1,155 |
InsuranceThe costs for insurance coverage to protect against financial losses due to risks like fire, natural disasters, theft, liability, or tenant-related damages. Calculation:Assumes 7% of gross rental income, unless insurance rates are specified.
Insurance:
| $252 |
Private Mortgage Insurance (PMI)A fee that borrowers pay when they take out a conventional loan with a loan-to-value (LTV) ratio above 80%.
Private mortgage insurance (PMI):
| $0 |
Monthly PaymentThe fixed amount a borrower pays each month to repay a loan. It typically includes principal and interest (P&I) and may also cover property taxes, insurance, HOA fees, and PMI if escrowed. Monthly payment:
| $4,057 |
Operating Income
| % Rent | Monthly | Yearly | |
|---|---|---|---|
Gross RentThe total rental income received from tenants before deducting any expenses. Includes base rent, late fees, pet fees, parking fees, and other recurring charges.
Gross rent:
| $3,600 | $43,200 | |
Vacancy LossExpected loss of rent due to vacancies.
Vacancy loss:
(6%)
| 6% | -$216 | -$2,592 |
Operating IncomeGross rental income minus vacancy loss. Calculation:Gross rent - Vacancy loss
Operating income:
| $3,384 | $40,608 |
Operating Expenses
| % Rent | Monthly | Yearly | |
|---|---|---|---|
Property TaxesAnnual taxes levied by local governments on real estate properties. These taxes fund public services like schools, roads, and emergency services. | 32% | -$1,155 | -$13,856 |
InsuranceThe costs for insurance coverage to protect against financial losses due to risks like fire, natural disasters, theft, liability, or tenant-related damages. Calculation:Assumes 7% of gross rental income, unless insurance rates are specified. | 7% | -$252 | -$3,024 |
Property ManagementThe costs associated with hiring a property manager to handle the day-to-day operations of a rental property. Includes management fees, leasing fes, eviction fees, etc. Calculation:Assumes 8% of gross rental income. | 8% | -$288 | -$3,456 |
Repairs & MaintenanceOngoing costs for routine upkeep and minor fixes needed to keep a property in good working condition. Calculation:Assumes 5% of gross rental income. Varies by property age and condition. | 5% | -$180 | -$2,160 |
Capital ExpensesLarge, infrequent costs for major improvements or replacements, like a new roof, HVAC system, or appliances. Calculation:Assumes 5% of gross rental income. Varies by property age. | 5% | -$180 | -$2,160 |
HOA FeesRegular dues paid to a Homeowners Association for community maintenance, amenities, and management. Similar fees include: Condo Association Fees, Co-op Maintenance Fees, etc. | 1% | -$39 | -$468 |
Operating ExpensesRecurring costs required to maintain and manage a rental property, including property taxes, insurance, maintenance, repairs, utilities (if paid by the owner), property management fees, and other day-to-day expenses. Calculation:Insurance + Property Taxes + Property Management + Repairs & Maintenance + Capital Expenditures + HOA Fees | 58% | -$2,094 | -$25,124 |
Cash Flow
| Monthly | Yearly | |
|---|---|---|
Net Operating Income (NOI)The income generated from a property after deducting all operating expenses but before deducting mortgage payments, taxes, and capital expenditures. Calculation:Gross Operating Income - Operating Expenses
Net operating income:
| $1,290 | $15,480 |
Mortgage PaymentThe fixed amount a borrower pays each month to repay a loan. It typically includes principal and interest (P&I) and may also cover property taxes, insurance, HOA fees, and PMI if escrowed. | -$2,650 | -$31,800 |
Cash FlowNet Operating Income (NOI) minus mortgage payments. Calculation:NOI - Mortgage Payments | -$1,360 | -$16,320 |