$1,250,000
Investment Summary
- Monthly Cash Flow
- -$1,383
- Cap Rate
- 4.4%
- Cash-on-Cash Return
- -5.8%
- Debt Coverage Ratio
- 0.77
- Internal Rate of Return (5 years)
- -1.6%
Cash Flow
Net Operating Income (NOI) minus mortgage payments.
Calculation:
NOI - Mortgage Payments
Cap Rate (Market Value)
Capitalization Rate is a rate of return that compares the yearly Net Operating Income (NOI) to the market value.
Calculation:
NOI / Market Value
Cash-on-Cash Return (CoC)
Annual Cash Flow / Cash Invested
Calculation:
Annual cash flow divided by initial cash invested.
Debt Coverage Ratio (DCR)
Net Operating Income (NOI) divided by total debt payments.
Calculation:
NOI / Total Debt Payments
Internal Rate of Return (IRR)
A metric for assessing profitability over time. IRR is the discount rate at which the net present value (NPV) of all future cash flows (positive and negative) from an investment equals zero — including both periodic cash flow (such as rent) and a projected sale at the end of the holding period. It represents the expected annualized return, accounting for income, expenses, and the recovery of capital through a future sale.
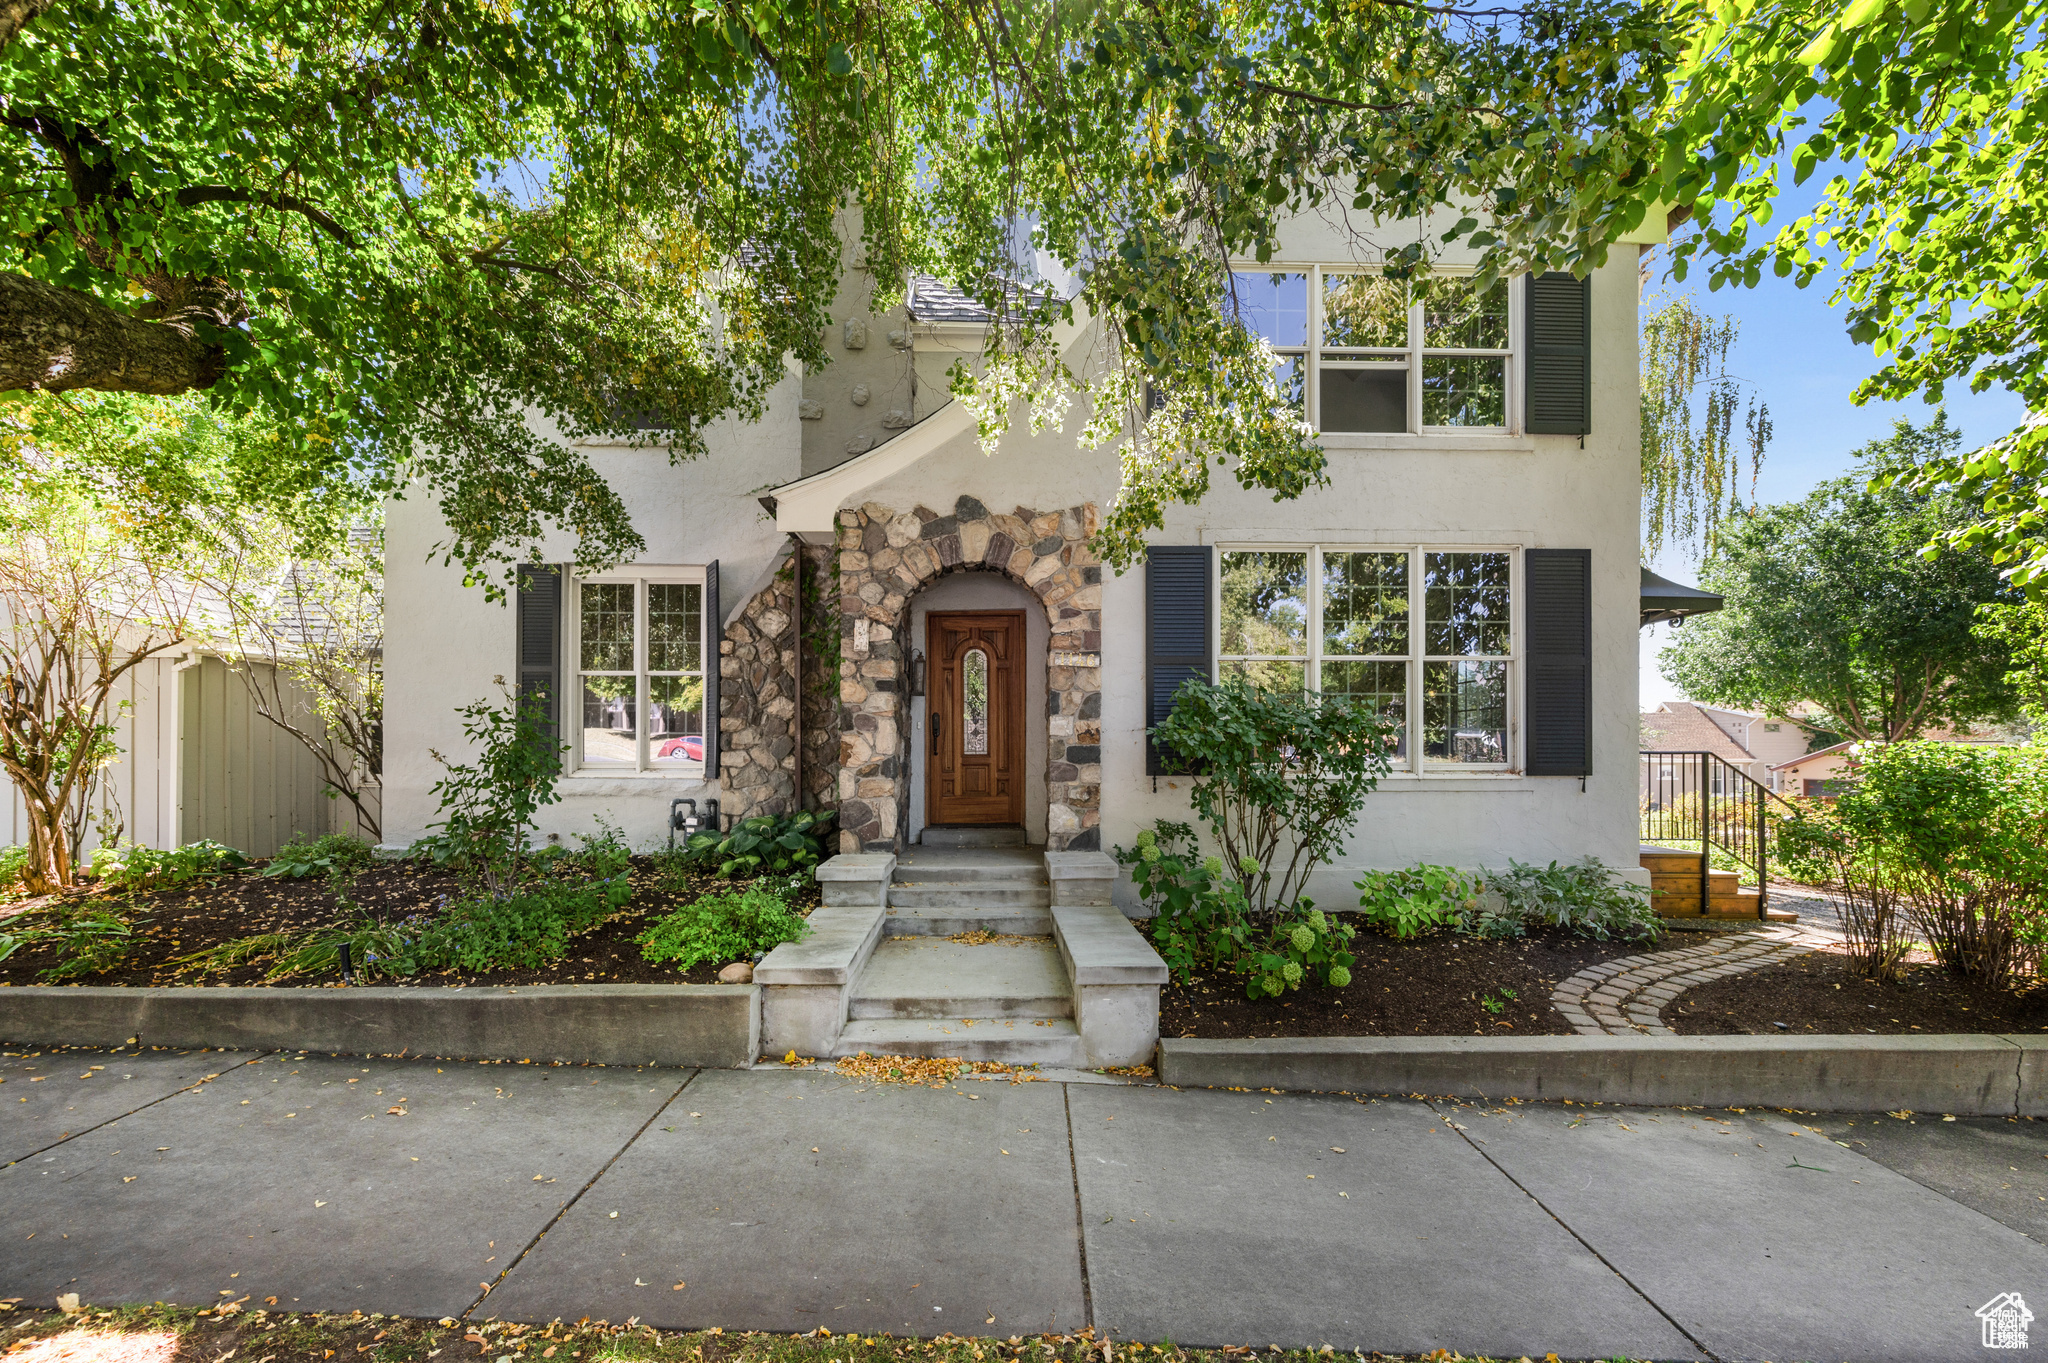
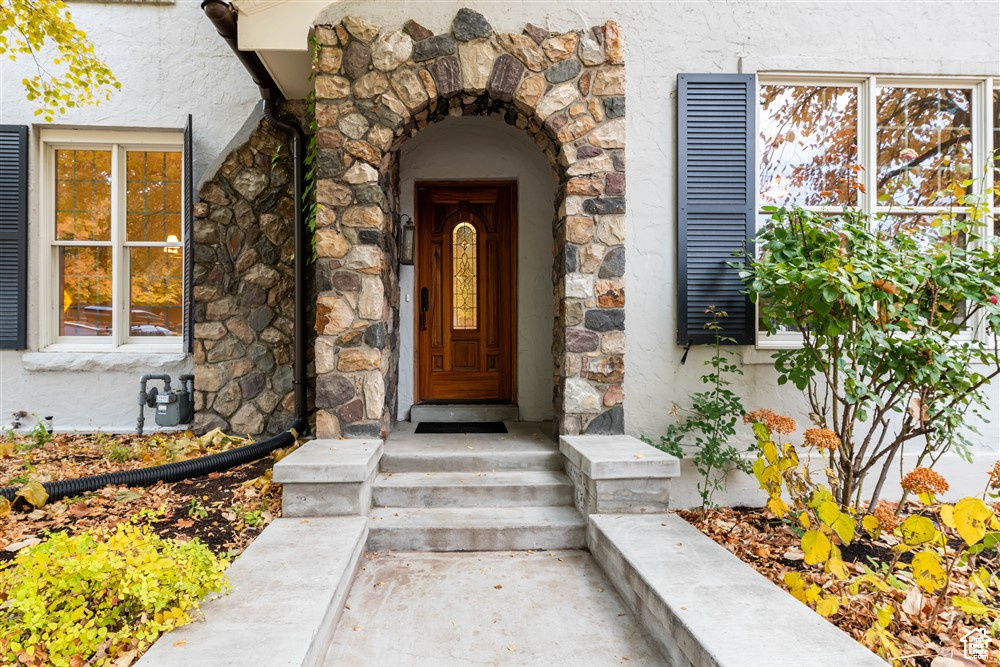
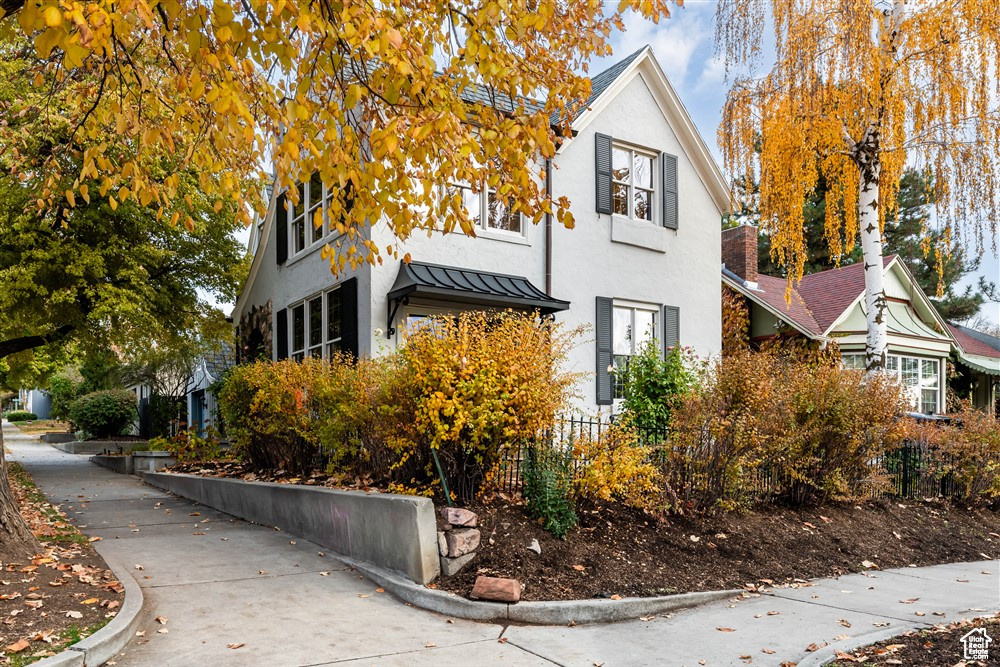
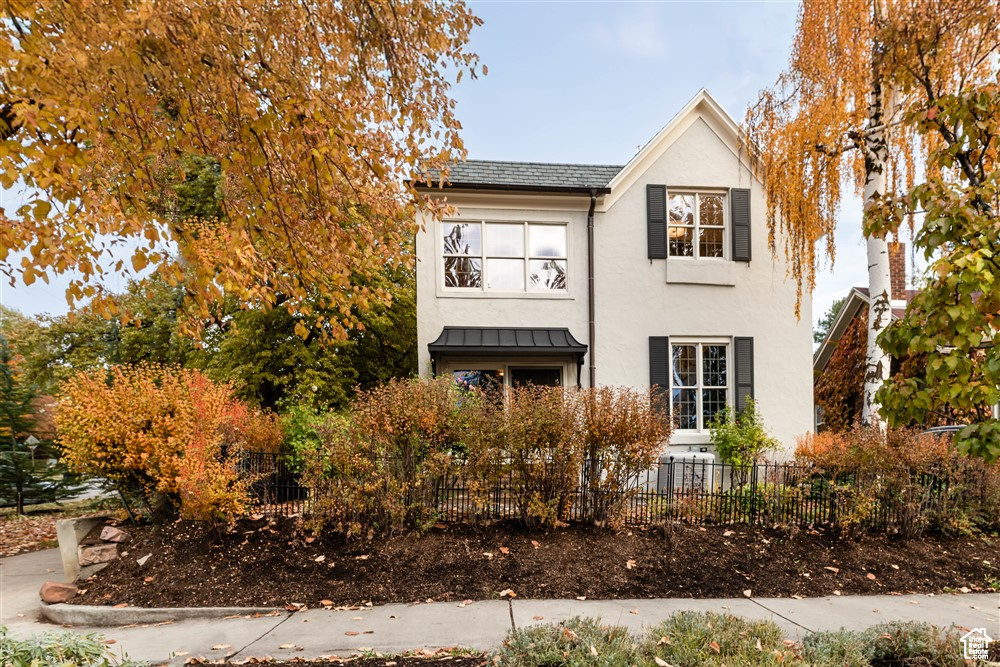
Property Description
Rare Find in Salt Lake City Stunning fully remodeled Victorian home with additional income-generating duplex on the property. Primary house rent ranges from $5000-$5500. Duplex is a separate building on the property and rents for $1700-$1800/month. Currently $1700/month. Discover a meticulously fully remodeled Victorian gem in the heart of Salt Lake City's sought-after East Bench/University area. Built in 1898, this residence seamlessly blends historic charm with modern amenities, offering a 2-rental unit total of 3,611 sq ft, 6 bedrooms, and 4 bathrooms, including a private separate duplex. Main House (2,831 sq ft, 5 beds, 3 baths). Separate duplex unit (780 sq ft, 1 bed, 1 bath, w/laundry). Step into timeless elegance featuring soaring coved ceilings, abundant natural light from premium Anderson wood windows, and newly installed oak wood floors on both the main and upper levels. The main floor living layout now boasts: A newly reimagined owner's suite with an ensuite bathroom and laundry room, offering modern comfort and convenience. Gourmet eat-in kitchen with island seating, new quartz countertops, a gas range, refrigerator, wine fridge, and a walk-in pantry. Other main-level highlights include a formal dining room, separate living room, and the owner's suite (or family room) with in-floor radiant heating, French doors opening to a garden patio, and a wood-burning outdoor fireplace. Upstairs, additional bedrooms offer generous space, while the lower level features an unfinished area with a second washer/dryer hookup, HVAC systems, oversized water heater, and ample storage/workshop space. Recent updates include new plumbing, electrical, a reinforced foundation, super-efficient HVAC systems (one for each floor), and a new roof with a transferable 50-year warranty. Also, there is a separate duplex unit #2 : 780 sq ft, 1 bed, 1 bath) Perfect for guests, extended family, or renta- 780 l income, this beautifully updated cottage includes: A spacious living room with a fireplace and vaulted ceilings. Fully equipped kitchen with new appliances and washer/dryer. A large bedroom and full bathroom. Updated systems, including on-demand water heating, new insulation, and fresh paint inside and out. The cottage also boasts its own front deck, private patio, and is currently rented for $1,700/month, providing excellent income potential. Outdoor Oasis Professionally maintained gardens and patios, shaded by mature trees, create a serene space for relaxation or entertaining. Ample parking includes 3 spaces in front of the main house and additional street parking. Prime location. Walk to the University of Utah, Trolley Square, 9th and 9th, and top-rated schools. Situated in one of Salt Lake City's most vibrant, walkable neighborhoods, this home offers unmatched convenience. Don't miss this exceptional opportunity! With pre-inspection, appraisal, and full disclosures available, this property is ready to welcome you home. Total: 3,611sq ft, 6 bedrooms, 4 bathrooms (Main House: 5 beds/3 baths, Duplex-Cottage: 1 bed/1 bath). Parking - 2 extra parking permits with the primary house and duplex.
Build Your Team
Quickly find investor-friendly professionals who can help you succeed in real estate investing at any stage of the investing journey.


Agents
Match with investor-friendly agents who can help you find, analyze, and close your next deal


Lenders
Get the best funding…find investor-friendly lenders who specialize in your deal strategy


Property Managers
Transition to passive investing. Find a trusted property management partnership that lasts.


Tax Pros & Accountants
Taxes and financial reporting made easy—find experts to create tax savings strategies, file taxes, and more
Location
Property Details
Parking
- Garage Spaces: 0
- Spaces Total: 0
Bedroom Information
- # of Bedrooms: 6
Bathroom Information
- # of Baths (Full): 2
- # of Baths (Total): 4.0
Interior Features
- # of Rooms: 11
- # of Stories: 3
- Basement: Yes
Exterior Features
- Exterior Walls Materials: Stucco
- Roof Material: Asphalt, Metal
Land Information
- Land Use: Residential Income
- Land Use Subtype: Single Family Residential
Lot Information
- Parcel ID: 1605480001
- Lot Size: 3920 sqft
Property Information
- Property Type: Duplex
- Style: Stories: 2
- Year Built: 1898
Tax Information
- Annual Tax: $4,400
Utilities
- Heating: Central, Natural Gas, Radiant Floor, Radiant
- Cooling: None
Location
- County: Salt Lake
Listing Details
Investment Summary
- Monthly Cash Flow
- -$1,383
- Cap Rate
- 4.4%
- Cash-on-Cash Return
- -5.8%
- Debt Coverage Ratio
- 0.77
- Internal Rate of Return (5 years)
- -1.6%
Cash Flow
Net Operating Income (NOI) minus mortgage payments.
Calculation:
NOI - Mortgage Payments
Cap Rate (Market Value)
Capitalization Rate is a rate of return that compares the yearly Net Operating Income (NOI) to the market value.
Calculation:
NOI / Market Value
Cash-on-Cash Return (CoC)
Annual Cash Flow / Cash Invested
Calculation:
Annual cash flow divided by initial cash invested.
Debt Coverage Ratio (DCR)
Net Operating Income (NOI) divided by total debt payments.
Calculation:
NOI / Total Debt Payments
Internal Rate of Return (IRR)
A metric for assessing profitability over time. IRR is the discount rate at which the net present value (NPV) of all future cash flows (positive and negative) from an investment equals zero — including both periodic cash flow (such as rent) and a projected sale at the end of the holding period. It represents the expected annualized return, accounting for income, expenses, and the recovery of capital through a future sale.
Purchase Details
Purchase PriceThe price paid for the property. Purchase price:
| $1,250,000 |
|---|---|
Amount FinancedThe amount of the purchase financed through a loan. Amount financed:
| -$1,000,000 |
Down paymentThe initial payment made towards the purchase. Down payment:
| $250,000 |
Closing CostsFees and expenses associated with purchasing a property, typically ranging from 2% to 5% of the home’s purchase price, paid at the end of a home purchase to cover services like lending, title transfer, and taxes. Closing costs:
| $37,500 |
Rehab CostsCosts incurred to repair or improve the property, including: roof, flooring, exterior siding, kitchen, exterior paint, bathrooms, etc. Rehab costs:
| $0 |
Initial Cash InvestedThe total initial cash invested in the property. Calculation:Down payment + Buying costs + Rehab costs Initial cash invested:
| $287,500 |
Square Feet (SQFT)The total square footage of the property. Square feet:
| 3,611 |
Cost Per Square FootCost per square foot of the property. Calculation:Purchase Price / Square Feet Cost per square foot:
| $346 |
Monthly Rent Per Square FootMonthly rent divided by the number of square feet. This ratio helps investors compare rental income efficiency across properties, markets, and unit sizes Calculation:Monthly Rent / Square Feet Monthly rent per square foot:
| $1.97 |
Financing Details
Loan AmountThe total sum of money borrowed from a lender to finance a property purchase. Calculation:Purchase Price - Down Payment
Loan amount:
| $1,000,000 |
|---|---|
Loan to Value Ratio (LTV)Loan amount divided by the market value of the property. Calculation:Loan Amount / Market Value
Loan to value ratio:
| 80.0% |
Loan TypeThe type of loan (e.g., fixed, adjustable).
Loan type:
| Amortizing |
TermThe loan repayment period in years.
Term:
| 30 years |
Interest RateThe percentage a lender charges on the borrowed amount of a loan, determining the cost of borrowing money.
Interest rate:
| 5.875% |
Principal & Interest (PI)The principal is the portion of the loan payment that reduces the loan balance. The interest is the lender's charge for borrowing money. Calculation:(P * r * (1 + r) ** n) / ((1 + r) ** n - 1) Where:
P = Loan amount (principal)
Principal & interest:
| $5,915 |
Property TaxesAnnual taxes levied by local governments on real estate properties. These taxes fund public services like schools, roads, and emergency services.
Property tax:
| $367 |
InsuranceThe costs for insurance coverage to protect against financial losses due to risks like fire, natural disasters, theft, liability, or tenant-related damages. Calculation:Assumes 7% of gross rental income, unless insurance rates are specified.
Insurance:
| $497 |
Private Mortgage Insurance (PMI)A fee that borrowers pay when they take out a conventional loan with a loan-to-value (LTV) ratio above 80%.
Private mortgage insurance (PMI):
| $0 |
Monthly PaymentThe fixed amount a borrower pays each month to repay a loan. It typically includes principal and interest (P&I) and may also cover property taxes, insurance, HOA fees, and PMI if escrowed. Monthly payment:
| $6,779 |
Operating Income
| % Rent | Monthly | Yearly | |
|---|---|---|---|
Gross RentThe total rental income received from tenants before deducting any expenses. Includes base rent, late fees, pet fees, parking fees, and other recurring charges.
Gross rent:
| $7,100 | $85,200 | |
Vacancy LossExpected loss of rent due to vacancies.
Vacancy loss:
(6%)
| 6% | -$426 | -$5,112 |
Operating IncomeGross rental income minus vacancy loss. Calculation:Gross rent - Vacancy loss
Operating income:
| $6,674 | $80,088 |
Operating Expenses
| % Rent | Monthly | Yearly | |
|---|---|---|---|
Property TaxesAnnual taxes levied by local governments on real estate properties. These taxes fund public services like schools, roads, and emergency services. | 5% | -$367 | -$4,400 |
InsuranceThe costs for insurance coverage to protect against financial losses due to risks like fire, natural disasters, theft, liability, or tenant-related damages. Calculation:Assumes 7% of gross rental income, unless insurance rates are specified. | 7% | -$497 | -$5,964 |
Property ManagementThe costs associated with hiring a property manager to handle the day-to-day operations of a rental property. Includes management fees, leasing fes, eviction fees, etc. Calculation:Assumes 8% of gross rental income. | 8% | -$568 | -$6,816 |
Repairs & MaintenanceOngoing costs for routine upkeep and minor fixes needed to keep a property in good working condition. Calculation:Assumes 5% of gross rental income. Varies by property age and condition. | 5% | -$355 | -$4,260 |
Capital ExpensesLarge, infrequent costs for major improvements or replacements, like a new roof, HVAC system, or appliances. Calculation:Assumes 5% of gross rental income. Varies by property age. | 5% | -$355 | -$4,260 |
HOA FeesRegular dues paid to a Homeowners Association for community maintenance, amenities, and management. Similar fees include: Condo Association Fees, Co-op Maintenance Fees, etc. | n/a | n/a | n/a |
Operating ExpensesRecurring costs required to maintain and manage a rental property, including property taxes, insurance, maintenance, repairs, utilities (if paid by the owner), property management fees, and other day-to-day expenses. Calculation:Insurance + Property Taxes + Property Management + Repairs & Maintenance + Capital Expenditures + HOA Fees | 30% | -$2,142 | -$25,700 |
Cash Flow
| Monthly | Yearly | |
|---|---|---|
Net Operating Income (NOI)The income generated from a property after deducting all operating expenses but before deducting mortgage payments, taxes, and capital expenditures. Calculation:Gross Operating Income - Operating Expenses
Net operating income:
| $4,532 | $54,384 |
Mortgage PaymentThe fixed amount a borrower pays each month to repay a loan. It typically includes principal and interest (P&I) and may also cover property taxes, insurance, HOA fees, and PMI if escrowed. | -$5,915 | -$70,980 |
Cash FlowNet Operating Income (NOI) minus mortgage payments. Calculation:NOI - Mortgage Payments | $1,383 | $16,596 |