Salt Lake City, UT Investment Properties for Sale
Browse homes for sale and investment properties in Salt Lake City, UT. Refine your search by price, property type, or more.
Best cash flowing properties in Salt Lake City, UT
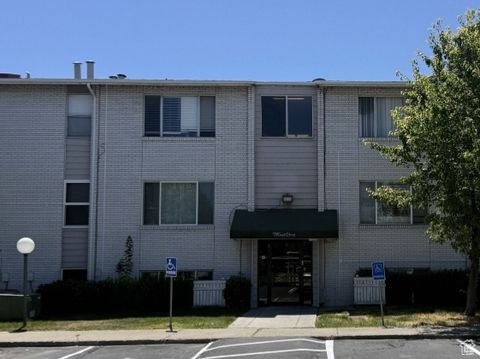
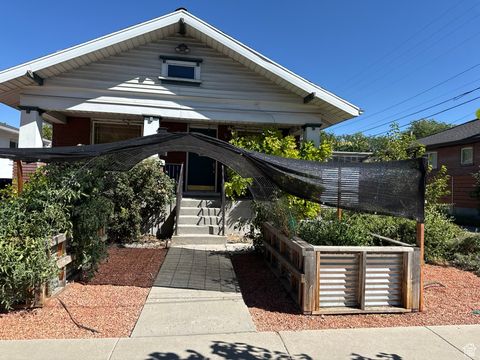
Active
$233,000
2
bds
|
1
ba
|
814
sqft
|
built
1973
1860 W 500 N, Salt Lake City, UT 84116
$-304
Cash flow
-6.8%
Cash-on-Cash Return
4.1%
Cap rate
0.6%
Rent to Value Ratio
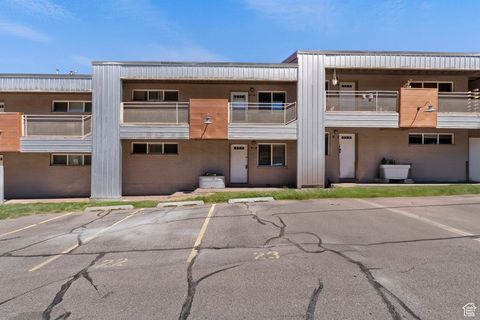
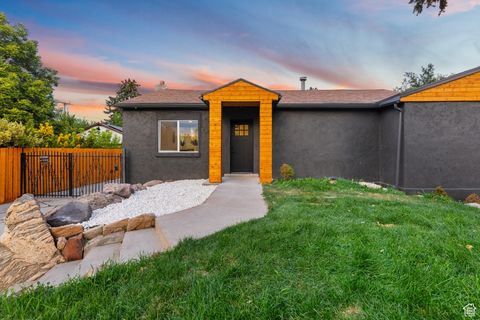
Active
$318,000
2
bds
|
1
ba
|
827
sqft
|
built
1961
650 N 300 W, Salt Lake City, UT 84103
$-641
Cash flow
-10.5%
Cash-on-Cash Return
3.3%
Cap rate
0.6%
Rent to Value Ratio
394 out of 470 properties for sale in Salt Lake City, UT
Limited Results Shown
Create a free account, or log in to reveal all property listings and enjoy the complete experience.
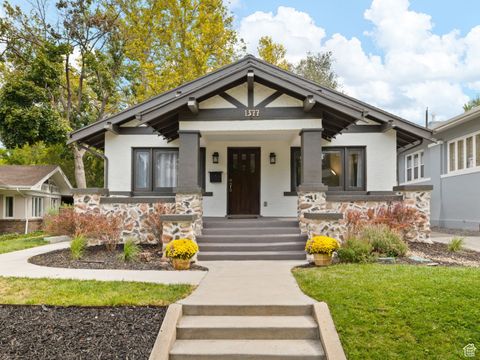
Active
$1,350,000
4
bds
|
3
ba
|
4,248
sqft
|
built
1916
1377 E Butler Ave, Salt Lake City, UT 84102
$-2,972
Cash flow
-11.5%
Cash-on-Cash Return
3.0%
Cap rate
0.4%
Rent to Value Ratio
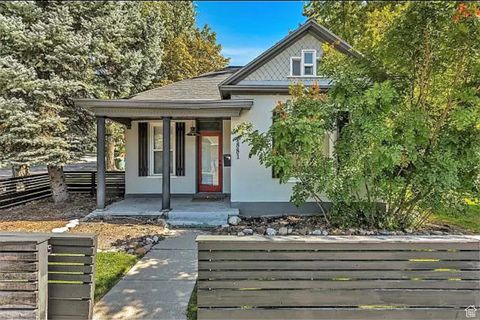
Active
$650,000
4
bds
|
4
ba
|
1,551
sqft
|
built
1902
1881 S 1100 E, Salt Lake City, UT 84105
$-1,797
Cash flow
-14.4%
Cash-on-Cash Return
2.4%
Cap rate
0.3%
Rent to Value Ratio
Active
$769,000
4
bds
|
2
ba
|
2,369
sqft
|
built
1914
714 S 600 E, Salt Lake City, UT 84102
$-1,708
Cash flow
-11.6%
Cash-on-Cash Return
3.0%
Cap rate
0.4%
Rent to Value Ratio
Active
$849,900
7
bds
|
4
ba
|
3,134
sqft
|
built
1921
182 E Kelsey Ave, Salt Lake City, UT 84111
$-2,517
Cash flow
-15.5%
Cash-on-Cash Return
2.1%
Cap rate
0.3%
Rent to Value Ratio
Active
$715,000
3
bds
|
2
ba
|
2,050
sqft
|
built
1948
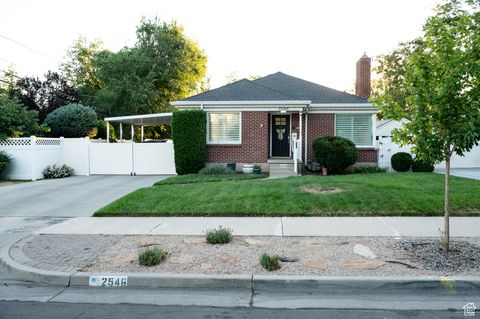
2546 S 1800 E, Salt Lake City, UT 84106
$-2,263
Cash flow
-16.5%
Cash-on-Cash Return
1.9%
Cap rate
0.3%
Rent to Value Ratio
Active
$1,849,000
4
bds
|
5
ba
|
3,924
sqft
|
built
1982
825 N Juniperpoint Ct, Salt Lake City, UT 84103
$-5,429
Cash flow
-15.3%
Cash-on-Cash Return
2.2%
Cap rate
0.4%
Rent to Value Ratio
Active
$870,000
4
bds
|
2
ba
|
2,103
sqft
|
built
1918
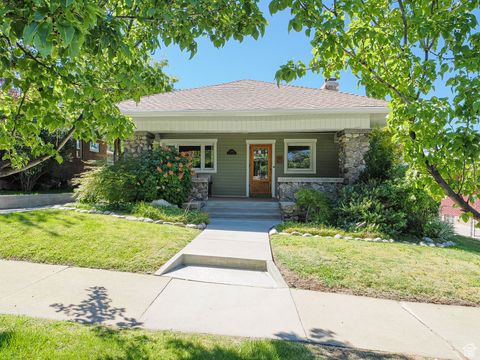
1336 E Roosevelt Ave, Salt Lake City, UT 84105
$-1,694
Cash flow
-10.2%
Cash-on-Cash Return
3.3%
Cap rate
0.5%
Rent to Value Ratio
Active
$1,765,000
5
bds
|
4
ba
|
3,321
sqft
|
built
1924
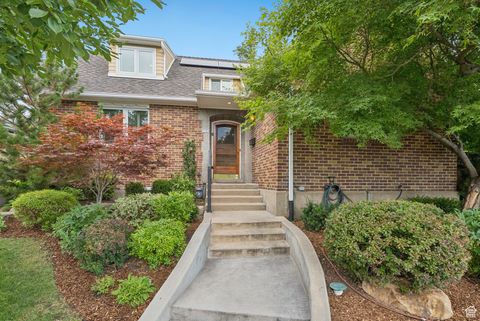
1005 S 1500 E, Salt Lake City, UT 84105
$-6,421
Cash flow
-19.0%
Cash-on-Cash Return
1.3%
Cap rate
0.2%
Rent to Value Ratio
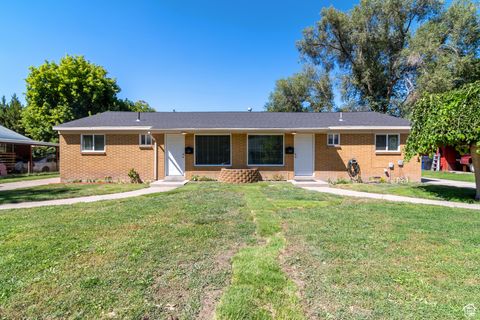
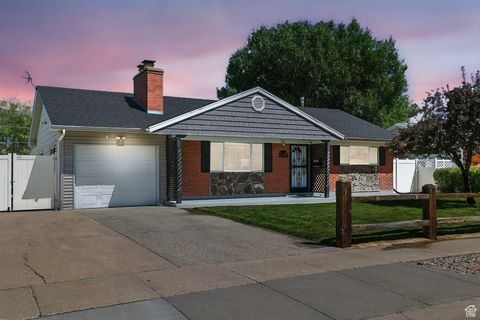
Active
$479,000
4
bds
|
2
ba
|
1,976
sqft
|
built
1977
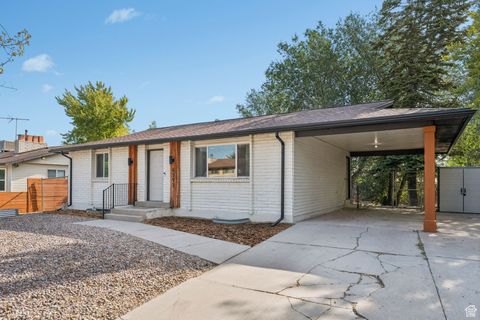
4597 S Trojan Dr, Salt Lake City, UT 84120
$-680
Cash flow
-7.4%
Cash-on-Cash Return
4.0%
Cap rate
0.5%
Rent to Value Ratio
Active
$1,149,900
5
bds
|
4
ba
|
2,808
sqft
|
built
1960
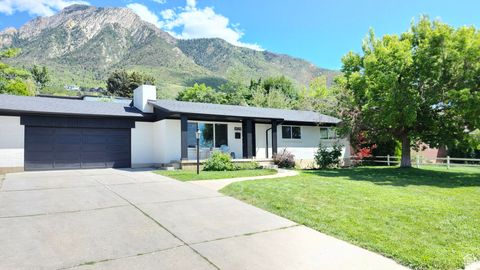
4529 S Westview Dr, Salt Lake City, UT 84124
$-2,965
Cash flow
-13.5%
Cash-on-Cash Return
2.6%
Cap rate
0.3%
Rent to Value Ratio
Active
$1,125,000
5
bds
|
3
ba
|
2,677
sqft
|
built
1927
1791 S 1600 E, Salt Lake City, UT 84105
$-1,920
Cash flow
-8.9%
Cash-on-Cash Return
3.6%
Cap rate
0.5%
Rent to Value Ratio
Active
$378,000
2
bds
|
1
ba
|
818
sqft
|
built
1949
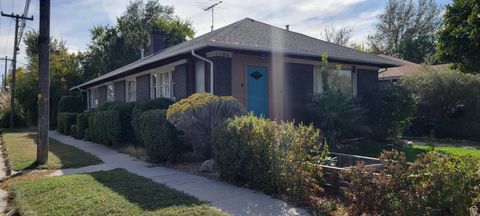
1130 S 1200 W, Salt Lake City, UT 84104
$-964
Cash flow
-13.3%
Cash-on-Cash Return
2.6%
Cap rate
0.4%
Rent to Value Ratio
Active
$1,150,000
4
bds
|
3
ba
|
2,988
sqft
|
built
1961
3441 S 3650 E, Salt Lake City, UT 84109
$-2,531
Cash flow
-11.5%
Cash-on-Cash Return
3.0%
Cap rate
0.4%
Rent to Value Ratio
Active
$1,760,000
5
bds
|
4
ba
|
4,310
sqft
|
built
1903
265 C St, Salt Lake City, UT 84103
$-4,019
Cash flow
-11.9%
Cash-on-Cash Return
2.9%
Cap rate
0.4%
Rent to Value Ratio
Active
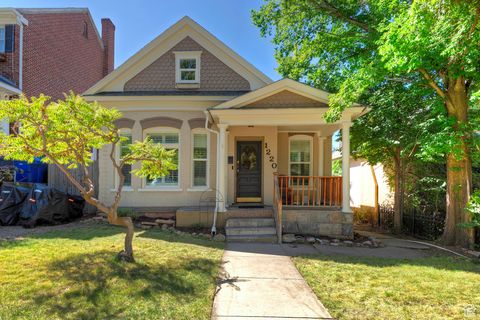
$770,000
4
bds
|
3
ba
|
2,103
sqft
|
built
1909
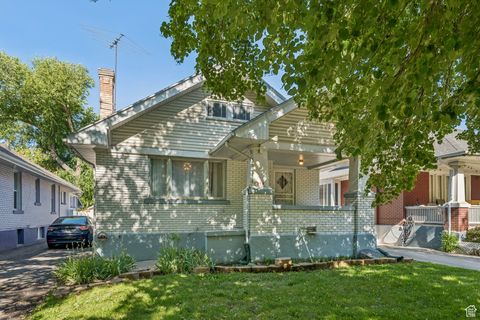
1220 E 600 S, Salt Lake City, UT 84102
$-1,425
Cash flow
-9.7%
Cash-on-Cash Return
3.5%
Cap rate
0.5%
Rent to Value Ratio
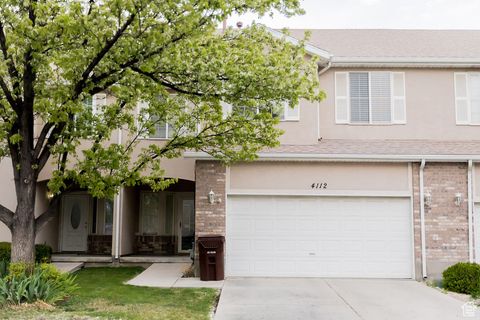
Active
$399,900
3
bds
|
3
ba
|
1,552
sqft
|
built
1999
4112 W 4645 S, Salt Lake City, UT 84120
$-927
Cash flow
-12.1%
Cash-on-Cash Return
2.9%
Cap rate
0.5%
Rent to Value Ratio
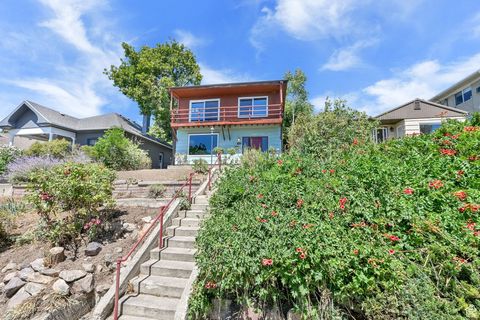
Active
$635,000
3
bds
|
2
ba
|
1,976
sqft
|
built
1930
665 E 6th Ave, Salt Lake City, UT 84103
$-1,122
Cash flow
-9.2%
Cash-on-Cash Return
3.6%
Cap rate
0.5%
Rent to Value Ratio
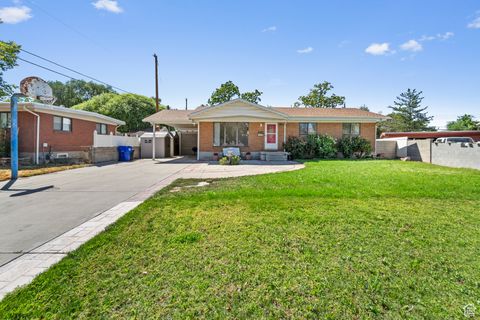
Active
$625,000
5
bds
|
3
ba
|
2,250
sqft
|
built
1959
3674 S 545 E, Salt Lake City, UT 84106
$-1,305
Cash flow
-10.9%
Cash-on-Cash Return
3.2%
Cap rate
0.4%
Rent to Value Ratio
Active
$478,500
3
bds
|
2
ba
|
1,951
sqft
|
built
1979
825 N Starcrest Dr, Salt Lake City, UT 84116
$-1,205
Cash flow
-13.1%
Cash-on-Cash Return
2.7%
Cap rate
0.4%
Rent to Value Ratio
Active
$679,000
5
bds
|
4
ba
|
3,011
sqft
|
built
1978
1575 E 6430 S, Salt Lake City, UT 84121
$-1,264
Cash flow
-9.7%
Cash-on-Cash Return
3.4%
Cap rate
0.6%
Rent to Value Ratio
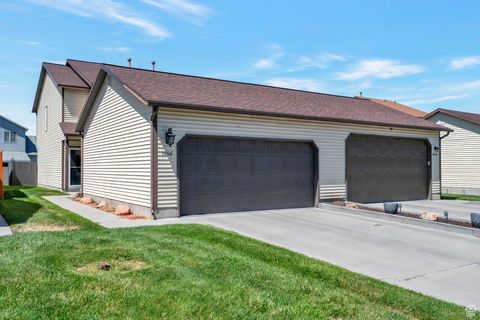
Active
$479,500
4
bds
|
2
ba
|
1,440
sqft
|
built
1960
1540 S 900 W, Salt Lake City, UT 84104
$-703
Cash flow
-7.6%
Cash-on-Cash Return
3.9%
Cap rate
0.5%
Rent to Value Ratio
Active
$463,900
5
bds
|
2
ba
|
1,996
sqft
|
built
1997
5716 S Trowbridge Way, Salt Lake City, UT 84118
$-948
Cash flow
-10.7%
Cash-on-Cash Return
3.2%
Cap rate
0.5%
Rent to Value Ratio
Active
$575,000
3
bds
|
3
ba
|
2,231
sqft
|
built
1995
1876 E Jeremy Ct, Salt Lake City, UT 84121
$-1,575
Cash flow
-14.3%
Cash-on-Cash Return
2.4%
Cap rate
0.3%
Rent to Value Ratio
Active
$365,000
2
bds
|
2
ba
|
900
sqft
|
built
1983
339 E 600 S, Salt Lake City, UT 84111
$-727
Cash flow
-10.4%
Cash-on-Cash Return
3.3%
Cap rate
0.6%
Rent to Value Ratio
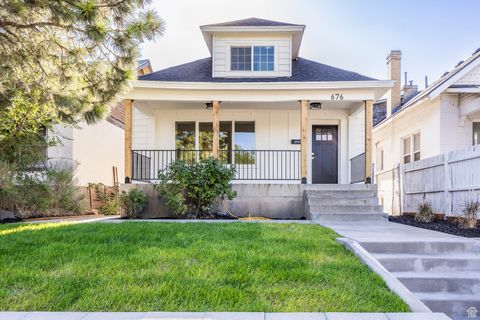
Active
$849,999
5
bds
|
4
ba
|
3,100
sqft
|
built
1909
676 S 200 W, Salt Lake City, UT 84101
$-2,660
Cash flow
-16.3%
Cash-on-Cash Return
1.9%
Cap rate
0.3%
Rent to Value Ratio
Active
$535,000
4
bds
|
2
ba
|
1,868
sqft
|
built
1979
5929 W Dry Bone Cir, Salt Lake City, UT 84118
$-1,047
Cash flow
-10.2%
Cash-on-Cash Return
3.3%
Cap rate
0.5%
Rent to Value Ratio
Active
$799,900
7
bds
|
3
ba
|
3,649
sqft
|
built
1936
435 S 900 W, Salt Lake City, UT 84104
$-2,082
Cash flow
-13.6%
Cash-on-Cash Return
2.6%
Cap rate
0.4%
Rent to Value Ratio

Active
$1,020,000
5
bds
|
4
ba
|
2,596
sqft
|
built
1941
1116 E 400 S, Salt Lake City, UT 84102
$-2,107
Cash flow
-10.8%
Cash-on-Cash Return
3.2%
Cap rate
0.4%
Rent to Value Ratio
Active
$975,000
3
bds
|
4
ba
|
2,722
sqft
|
built
1998
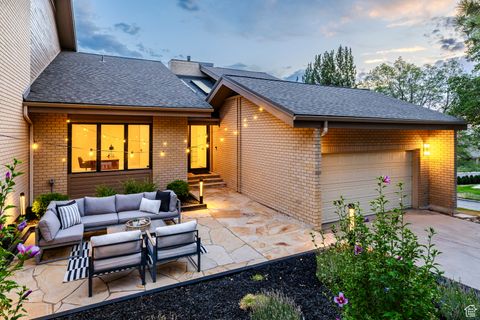
375 E 9th Ave, Salt Lake City, UT 84103
$-2,940
Cash flow
-15.7%
Cash-on-Cash Return
2.1%
Cap rate
0.4%
Rent to Value Ratio
Active
$445,000
5
bds
|
2
ba
|
1,953
sqft
|
built
1978
5647 S Sarah Jane Dr, Salt Lake City, UT 84118
$-836
Cash flow
-9.8%
Cash-on-Cash Return
3.4%
Cap rate
0.5%
Rent to Value Ratio
Active
$839,900
8
bds
|
5
ba
|
5,119
sqft
|
built
2007
4483 S Rodonda Linda Pl, Salt Lake City, UT 84128
$-1,652
Cash flow
-10.3%
Cash-on-Cash Return
3.3%
Cap rate
0.5%
Rent to Value Ratio
Active
$575,000
2
bds
|
1
ba
|
1,200
sqft
|
built
1917
617 E Driggs Ave, Salt Lake City, UT 84106
$-1,337
Cash flow
-12.1%
Cash-on-Cash Return
2.9%
Cap rate
0.4%
Rent to Value Ratio
Active
$799,000
4
bds
|
3
ba
|
2,728
sqft
|
built
1949
3957 S 1000 E, Salt Lake City, UT 84124
$-2,120
Cash flow
-13.8%
Cash-on-Cash Return
2.5%
Cap rate
0.4%
Rent to Value Ratio
Active
$749,000
4
bds
|
2
ba
|
1,624
sqft
|
built
1959
1363 E 4170 S, Salt Lake City, UT 84124
$-2,290
Cash flow
-16.0%
Cash-on-Cash Return
2.0%
Cap rate
0.3%
Rent to Value Ratio
Active
$415,000
3
bds
|
2
ba
|
1,374
sqft
|
built
1995
3606 S 2045 W, Salt Lake City, UT 84119
$-717
Cash flow
-9.0%
Cash-on-Cash Return
3.6%
Cap rate
0.6%
Rent to Value Ratio
Active
$510,000
5
bds
|
2
ba
|
2,306
sqft
|
built
1963
3664 W 3965 S, Salt Lake City, UT 84120
$-1,454
Cash flow
-14.9%
Cash-on-Cash Return
2.3%
Cap rate
0.3%
Rent to Value Ratio
Active
$305,000
1
bds
|
1
ba
|
702
sqft
|
built
1962
8 E Hillside Ave, Salt Lake City, UT 84103
$-749
Cash flow
-12.8%
Cash-on-Cash Return
2.7%
Cap rate
0.5%
Rent to Value Ratio
Active
$765,000
5
bds
|
3
ba
|
2,810
sqft
|
built
1951
1801 E 3900 S, Salt Lake City, UT 84124
$-1,890
Cash flow
-12.9%
Cash-on-Cash Return
2.7%
Cap rate
0.4%
Rent to Value Ratio