United States Investment Properties for Sale
Browse homes for sale and investment properties in United States. Refine your search by price, property type, or more.
Best cash flowing properties in United States
Active
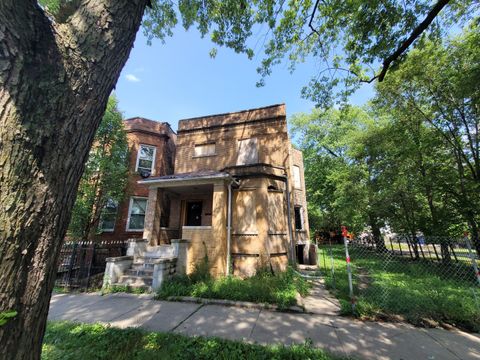
$54,900
3
bds
|
1
ba
|
1,308
sqft
|
built
1908
6627 S Saint Lawrence Ave, Chicago, IL 60637
$859
Cash flow
18.2%
Cash-on-Cash Return
18.8%
Cap rate
2.7%
Rent to Value Ratio

Active
$14,900
2
bds
|
2
ba
|
744
sqft
|
built
1940
5423 Avon Pl, East Saint Louis, IL 62204
$759
Cash flow
59.3%
Cash-on-Cash Return
61.1%
Cap rate
7.4%
Rent to Value Ratio
10,000 out of 312,048 properties for sale in United States
Limited Results Shown
Create a free account, or log in to reveal all property listings and enjoy the complete experience.
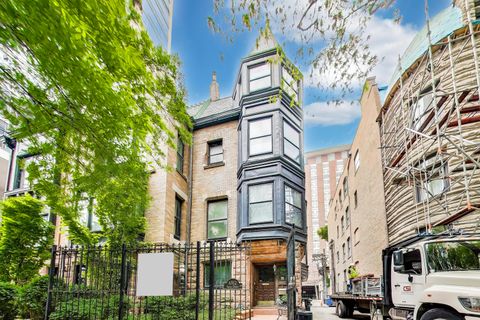
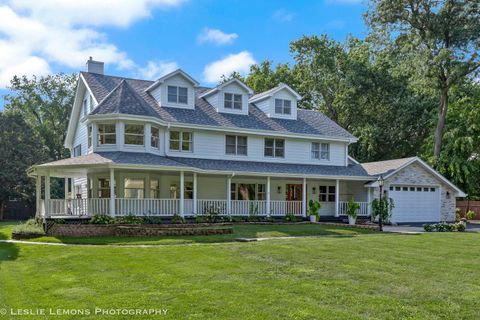
Active
$1,499,000
5
bds
|
4
ba
|
5,991
sqft
|
built
1887
1312 N Astor St, Chicago, IL 60610
$-3,320
Cash flow
-11.6%
Cash-on-Cash Return
3.0%
Cap rate
0.7%
Rent to Value Ratio

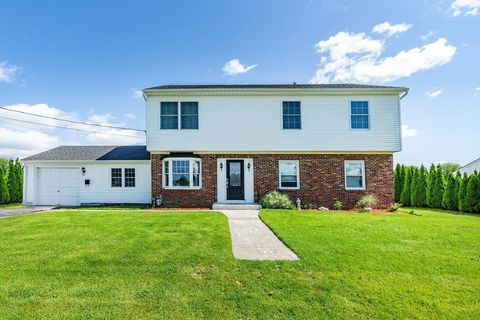
Active
$495,000
4
bds
|
2
ba
|
1,735
sqft
|
built
1924
2107 East Ave, Berwyn, IL 60402
$-1,159
Cash flow
-12.2%
Cash-on-Cash Return
2.9%
Cap rate
0.5%
Rent to Value Ratio
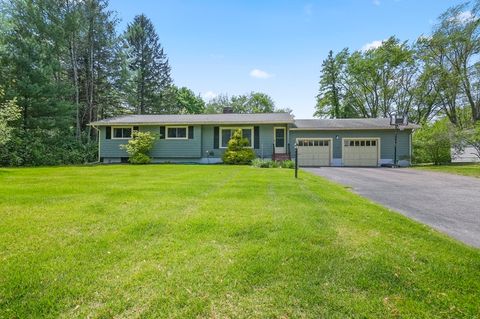
Active
$549,900
4
bds
|
3
ba
|
2,172
sqft
|
built
1966
74 Brookhaven Dr, East Providence, RI 02914
$-948
Cash flow
-9.0%
Cash-on-Cash Return
3.6%
Cap rate
0.6%
Rent to Value Ratio
Active
$800,000
3
bds
|
2
ba
|
1,548
sqft
|
built
1955
35 Snake Brook Rd, Wayland, MA 01778
$-1,712
Cash flow
-11.2%
Cash-on-Cash Return
3.1%
Cap rate
0.5%
Rent to Value Ratio

Active
$839,000
3
bds
|
3
ba
|
2,602
sqft
|
built
1987
1625 Churchill Ct, Libertyville, IL 60048
$-2,595
Cash flow
-16.1%
Cash-on-Cash Return
2.0%
Cap rate
0.4%
Rent to Value Ratio
Active
$245,000
3
bds
|
1
ba
|
936
sqft
|
built
1959
5601 44th Ave, Kenosha, WI 53144
$-113
Cash flow
-2.4%
Cash-on-Cash Return
5.5%
Cap rate
0.8%
Rent to Value Ratio
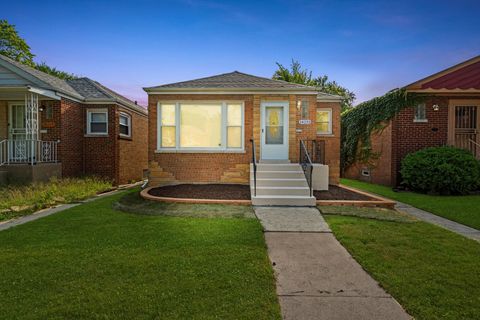
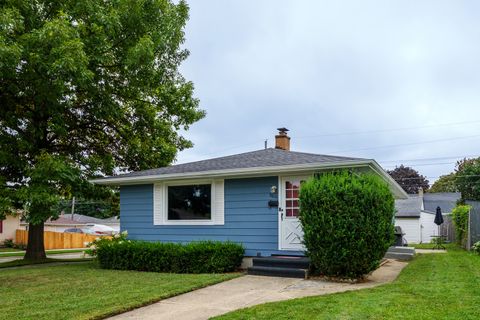
Active
$179,900
3
bds
|
1
ba
|
1,116
sqft
|
built
1955
14231 S Dearborn St, Riverdale, IL 60827
$-55
Cash flow
-1.6%
Cash-on-Cash Return
5.3%
Cap rate
1.1%
Rent to Value Ratio

Active
$1,798,999
4
bds
|
3
ba
|
0
sqft
|
built
1943
3109 Hawk St, San Diego, CA 92103
$-3,683
Cash flow
-10.7%
Cash-on-Cash Return
3.2%
Cap rate
0.4%
Rent to Value Ratio
Active
$119,999
2
bds
|
3
ba
|
1,120
sqft
|
built
1982
2019 Oleander Blvd, Fort Pierce, FL 34950
$-237
Cash flow
-10.3%
Cash-on-Cash Return
3.8%
Cap rate
1.3%
Rent to Value Ratio
Active
$8,900,000
3
bds
|
4
ba
|
3,884
sqft
|
built
2011
9705 Collins Ave, Bal Harbour, FL 33154
$-66,411
Cash flow
-38.9%
Cash-on-Cash Return
-2.8%
Cap rate
0.1%
Rent to Value Ratio

Active
$1,980,000
3
bds
|
2
ba
|
0
sqft
|
built
1960
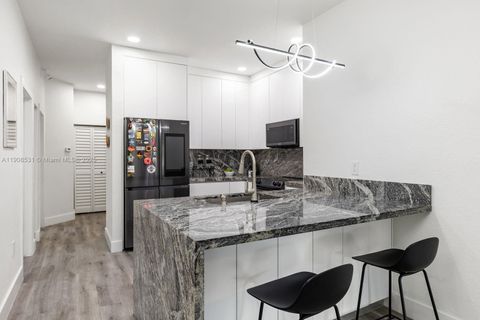
2010 NE 196th Ter, North Miami Beach, FL 33179
$-9,240
Cash flow
-24.3%
Cash-on-Cash Return
0.5%
Cap rate
0.2%
Rent to Value Ratio
Active
$475,000
3
bds
|
2
ba
|
1,417
sqft
|
built
2005
13216 SW 44th St, Miramar, FL 33027
$-1,581
Cash flow
-17.4%
Cash-on-Cash Return
2.2%
Cap rate
0.6%
Rent to Value Ratio
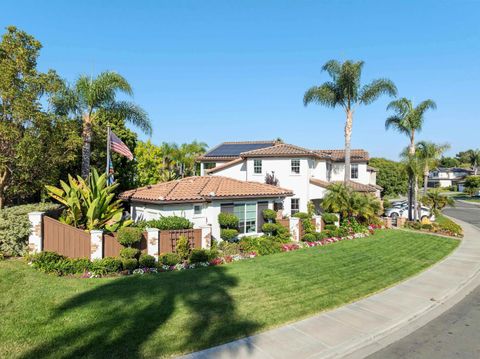
Active
$1,549,000
4
bds
|
3
ba
|
2,372
sqft
|
built
1990
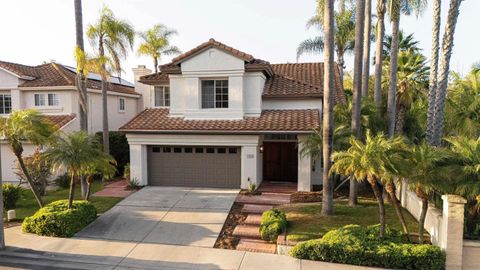
2318 Via Villegas, Carlsbad, CA 92009
$-3,291
Cash flow
-11.1%
Cash-on-Cash Return
3.1%
Cap rate
0.4%
Rent to Value Ratio

Active
$1,099,500
4
bds
|
3
ba
|
2,987
sqft
|
built
1988
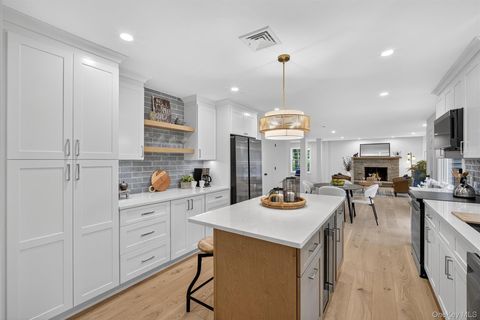
28983 Mountain Meadow Rd, Escondido, CA 92026
$-1,753
Cash flow
-8.3%
Cash-on-Cash Return
3.8%
Cap rate
0.5%
Rent to Value Ratio

Active
$349,000
1
bds
|
1
ba
|
0
sqft
|
built
2008
855 Peachtree St NE, Atlanta, GA 30308
$-1,210
Cash flow
-18.1%
Cash-on-Cash Return
2.0%
Cap rate
0.7%
Rent to Value Ratio
Active
$595,000
5
bds
|
3.5
ba
|
3,484
sqft
|
built
1997
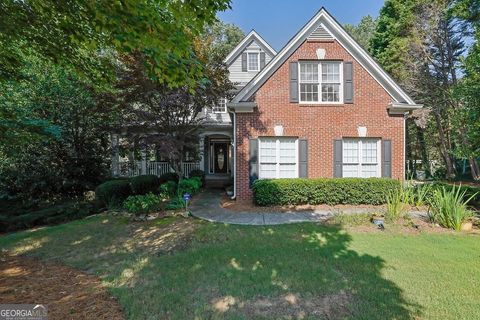
1872 Bakers Mill Rd, Dacula, GA 30019
$-1,670
Cash flow
-14.6%
Cash-on-Cash Return
2.8%
Cap rate
0.5%
Rent to Value Ratio

Active
$285,000
3
bds
|
3
ba
|
2,195
sqft
|
built
2000
9458 Sycamore Brk, San Antonio, TX 78254
$-613
Cash flow
-11.2%
Cash-on-Cash Return
3.1%
Cap rate
0.7%
Rent to Value Ratio

Active
$431,000
3
bds
|
2.5
ba
|
2,483
sqft
|
built
1995
9396 Woodlawn Dr, Douglasville, GA 30135
$-1,196
Cash flow
-14.5%
Cash-on-Cash Return
2.8%
Cap rate
0.5%
Rent to Value Ratio

Active
$249,900
2
bds
|
2
ba
|
880
sqft
|
built
1977
2840 Bombridge Ct, Ann Arbor, MI 48104
$-562
Cash flow
-11.7%
Cash-on-Cash Return
3.0%
Cap rate
0.7%
Rent to Value Ratio
Active
$699,000
4
bds
|
3
ba
|
3,019
sqft
|
built
1973
41 Meddaugh Rd, Pleasant Valley, NY 12569
$-2,227
Cash flow
-16.6%
Cash-on-Cash Return
2.2%
Cap rate
0.5%
Rent to Value Ratio

Active
$849,000
4
bds
|
4
ba
|
3,760
sqft
|
built
2005
224 Whippoorwill Dr, Raynham, MA 02767
$-1,696
Cash flow
-10.4%
Cash-on-Cash Return
3.3%
Cap rate
0.5%
Rent to Value Ratio

Active
$399,000
2
bds
|
2
ba
|
1,200
sqft
|
built
1990
401 E Ontario St, Chicago, IL 60611
$-1,242
Cash flow
-16.2%
Cash-on-Cash Return
1.9%
Cap rate
0.9%
Rent to Value Ratio

Active
$163,995
4
bds
|
1
ba
|
1,197
sqft
|
built
1954
8 Allegheny Ct, Park Forest, IL 60466
$127
Cash flow
4.0%
Cash-on-Cash Return
6.6%
Cap rate
1.2%
Rent to Value Ratio

Active
$220,000
1
bds
|
2
ba
|
780
sqft
|
built
1969
1817 S Ocean Dr, Hallandale Beach, FL 33009
$-671
Cash flow
-15.9%
Cash-on-Cash Return
2.5%
Cap rate
1.0%
Rent to Value Ratio

Active
$354,900
3
bds
|
2.5
ba
|
1,548
sqft
|
built
2003
41 Melivy Ct, Jefferson, GA 30549
$-652
Cash flow
-9.6%
Cash-on-Cash Return
3.9%
Cap rate
0.6%
Rent to Value Ratio

Active
$799,000
4
bds
|
3.5
ba
|
3,054
sqft
|
built
2017
2470 Green Mountain Dr, Braselton, GA 30517
$-1,799
Cash flow
-11.7%
Cash-on-Cash Return
3.4%
Cap rate
0.6%
Rent to Value Ratio

Active
$154,900
0
bds
|
1
ba
|
0
sqft
|
built
1957
1150 N Lake Shore Dr, Chicago, IL 60611
$-455
Cash flow
-15.3%
Cash-on-Cash Return
2.2%
Cap rate
1.1%
Rent to Value Ratio
Active
$1,999,999
5
bds
|
6
ba
|
6,300
sqft
|
built
1975
8S452 Bell Dr, Naperville, IL 60565
$-6,464
Cash flow
-16.9%
Cash-on-Cash Return
1.8%
Cap rate
0.3%
Rent to Value Ratio

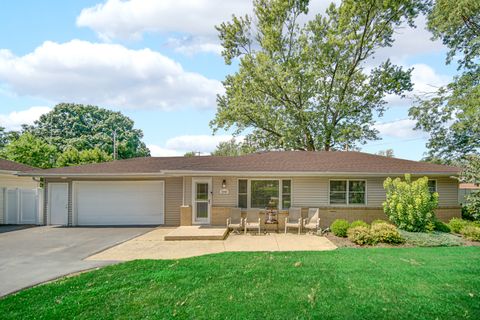
Active
$395,000
5
bds
|
3
ba
|
2,289
sqft
|
built
2002
330 Westwood Dr, Mandeville, LA 70471
$-19
Cash flow
-0.3%
Cash-on-Cash Return
5.6%
Cap rate
0.7%
Rent to Value Ratio

Active
$599,999
2
bds
|
2
ba
|
1,537
sqft
|
built
2023
261 Silver Timber Dr, Yaphank, NY 11980
$-2,430
Cash flow
-21.1%
Cash-on-Cash Return
1.2%
Cap rate
0.5%
Rent to Value Ratio

Active
$530,000
3
bds
|
2
ba
|
1,328
sqft
|
built
1983
20000 SW 114th Ave, Miami, FL 33189
$-683
Cash flow
-6.7%
Cash-on-Cash Return
4.6%
Cap rate
0.7%
Rent to Value Ratio

Active
$679,000
3
bds
|
3
ba
|
2,014
sqft
|
built
1987
9933 NW 49th Ter, Doral, FL 33178
$-1,889
Cash flow
-14.5%
Cash-on-Cash Return
2.8%
Cap rate
0.6%
Rent to Value Ratio

Active
$150,000
1
bds
|
1
ba
|
800
sqft
|
built
1965
1500 S Busse Rd, Mount Prospect, IL 60056
$-66
Cash flow
-2.3%
Cash-on-Cash Return
5.2%
Cap rate
1.0%
Rent to Value Ratio
Active
$320,000
3
bds
|
1
ba
|
1,080
sqft
|
built
1958
2540 Crystal Dr, Joliet, IL 60435
$-814
Cash flow
-13.3%
Cash-on-Cash Return
2.6%
Cap rate
0.5%
Rent to Value Ratio

Active
$620,000
4
bds
|
4
ba
|
4,671
sqft
|
built
2007
6452 Century Park Pl SE, Mableton, GA 30126
$-1,375
Cash flow
-11.6%
Cash-on-Cash Return
3.5%
Cap rate
0.6%
Rent to Value Ratio
Active
$3,070,000
6
bds
|
5
ba
|
4,205
sqft
|
built
1997
3424 Camino Alegre, Carlsbad, CA 92009
$-9,202
Cash flow
-15.6%
Cash-on-Cash Return
2.1%
Cap rate
0.3%
Rent to Value Ratio

Active
$1,089,000
4
bds
|
6
ba
|
4,539
sqft
|
built
1994
12 Riderwood Rd, North Barrington, IL 60010
$-2,918
Cash flow
-14.0%
Cash-on-Cash Return
2.5%
Cap rate
0.6%
Rent to Value Ratio

Active
$159,900
3
bds
|
1
ba
|
1,046
sqft
|
built
1942
782 Campbell Ave, Calumet City, IL 60409
$70
Cash flow
2.3%
Cash-on-Cash Return
6.2%
Cap rate
1.1%
Rent to Value Ratio