United States Investment Properties for Sale
Browse homes for sale and investment properties in United States. Refine your search by price, property type, or more.
Best cash flowing properties in United States
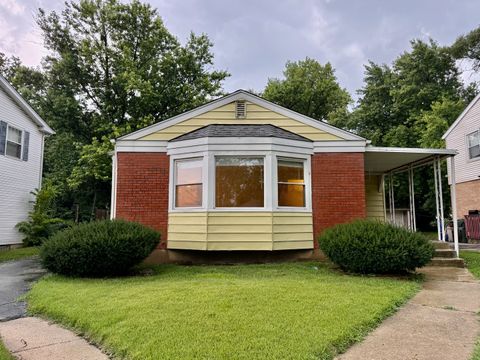
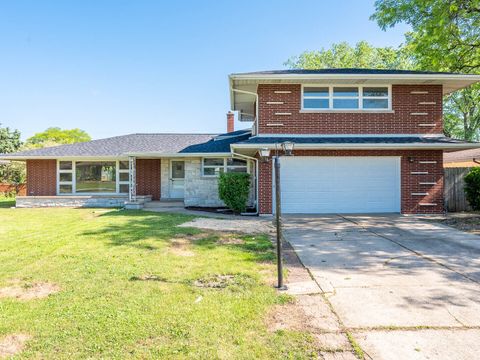
Active
$259,900
3
bds
|
3
ba
|
1,800
sqft
|
built
1905
7832 S Evans Ave, Chicago, IL 60619
$701
Cash flow
14.1%
Cash-on-Cash Return
8.9%
Cap rate
1.1%
Rent to Value Ratio

Active
$106,999
1
bds
|
1
ba
|
716
sqft
|
built
1941
128 W 115th St, Chicago, IL 60628
$534
Cash flow
26.0%
Cash-on-Cash Return
11.7%
Cap rate
1.5%
Rent to Value Ratio
10,000 out of 309,027 properties for sale in United States
Limited Results Shown
Create a free account, or log in to reveal all property listings and enjoy the complete experience.

Active
$445,000
3
bds
|
3
ba
|
2,532
sqft
|
built
1988
13226 Farm View St, Homer Glen, IL 60491
$-739
Cash flow
-8.7%
Cash-on-Cash Return
3.7%
Cap rate
0.7%
Rent to Value Ratio
Active
$569,900
3
bds
|
2
ba
|
1,896
sqft
|
built
1962
900 Rowe Ave, Park Ridge, IL 60068
$-1,206
Cash flow
-11.0%
Cash-on-Cash Return
3.1%
Cap rate
0.6%
Rent to Value Ratio
Active
$870,000
4
bds
|
4
ba
|
4,171
sqft
|
built
2005
927 Scenic Stroll, San Antonio, TX 78260
$-2,051
Cash flow
-12.3%
Cash-on-Cash Return
2.8%
Cap rate
0.7%
Rent to Value Ratio
Active
$349,900
4
bds
|
2.5
ba
|
1,818
sqft
|
built
1976
5002 Abbey Ln SW, Lilburn, GA 30047
$-569
Cash flow
-8.5%
Cash-on-Cash Return
4.2%
Cap rate
0.6%
Rent to Value Ratio
Active
$678,000
5
bds
|
3.5
ba
|
4,895
sqft
|
built
1994
1850 Noblin Ridge Way, Duluth, GA 30097
$-1,772
Cash flow
-13.6%
Cash-on-Cash Return
3.0%
Cap rate
0.5%
Rent to Value Ratio

Active
$474,999
3
bds
|
2.5
ba
|
1,895
sqft
|
built
2017
7210 Post Park Way, Cumming, GA 30040
$-33,609
Cash flow
-369.2%
Cash-on-Cash Return
-78.8%
Cap rate
0.5%
Rent to Value Ratio

Active
$135,000
1
bds
|
1
ba
|
840
sqft
|
built
1972
15600 NW 7th Ave, Miami, FL 33169
$-116
Cash flow
-4.5%
Cash-on-Cash Return
5.1%
Cap rate
1.2%
Rent to Value Ratio

Active
$240,000
3
bds
|
2
ba
|
1,176
sqft
|
built
1981
1299 Birchcrest Blvd, Port Charlotte, FL 33952
$-242
Cash flow
-5.3%
Cash-on-Cash Return
4.9%
Cap rate
0.8%
Rent to Value Ratio

Active
$599,000
4
bds
|
3
ba
|
2,231
sqft
|
built
1998
1241 SW 46th Way, Deerfield Beach, FL 33442
$-1,259
Cash flow
-11.0%
Cash-on-Cash Return
3.6%
Cap rate
0.7%
Rent to Value Ratio
Active
$2,695,000
4
bds
|
3
ba
|
2,700
sqft
|
built
2022
1631 N Copeland Dr, Marco Island, FL 34145
$-9,706
Cash flow
-18.8%
Cash-on-Cash Return
1.8%
Cap rate
0.3%
Rent to Value Ratio
Active
$1,197,500
2
bds
|
2
ba
|
1,236
sqft
|
built
2003
445 3rd Ave S, Naples, FL 34102
$-3,239
Cash flow
-14.1%
Cash-on-Cash Return
2.9%
Cap rate
0.5%
Rent to Value Ratio

Active
$189,000
3
bds
|
2
ba
|
1,300
sqft
|
built
1978
38 Willard Pl, Westwego, LA 70094
$210
Cash flow
5.8%
Cash-on-Cash Return
7.0%
Cap rate
0.8%
Rent to Value Ratio

Active
$134,900
2
bds
|
1
ba
|
939
sqft
|
built
1985
2601 Kenzie Ter, Saint Anthony, MN 55418
$-301
Cash flow
-11.6%
Cash-on-Cash Return
3.0%
Cap rate
1.2%
Rent to Value Ratio

Active
$430,000
3
bds
|
2
ba
|
2,218
sqft
|
built
1988
270 Scroggins Ter, Hot Springs, AR 71901
$-242
Cash flow
-2.9%
Cash-on-Cash Return
5.0%
Cap rate
0.7%
Rent to Value Ratio

Active
$247,000
4
bds
|
2
ba
|
1,533
sqft
|
built
1961
163 W Raye Dr, Chicago Heights, IL 60411
$-328
Cash flow
-6.9%
Cash-on-Cash Return
4.1%
Cap rate
0.8%
Rent to Value Ratio
Active
$439,950
3
bds
|
2.5
ba
|
2,992
sqft
|
built
1988
105 Lancaster Pt, Statesboro, GA 30458
$-1,068
Cash flow
-12.7%
Cash-on-Cash Return
3.2%
Cap rate
0.5%
Rent to Value Ratio
Active
$296,000
3
bds
|
3
ba
|
1,864
sqft
|
built
1955
1121 Olive Rd, Homewood, IL 60430
$-219
Cash flow
-3.9%
Cash-on-Cash Return
4.8%
Cap rate
0.9%
Rent to Value Ratio
Active
$335,000
3
bds
|
3
ba
|
1,764
sqft
|
built
2017
270 Lionel Dr, Grayslake, IL 60030
$-731
Cash flow
-11.4%
Cash-on-Cash Return
3.1%
Cap rate
0.8%
Rent to Value Ratio
Active
$299,000
5
bds
|
2
ba
|
1,747
sqft
|
built
1946
2218 S 11th Ave, Broadview, IL 60155
$-180
Cash flow
-3.1%
Cash-on-Cash Return
5.0%
Cap rate
0.9%
Rent to Value Ratio
Active
$399,000
4
bds
|
2
ba
|
1,750
sqft
|
built
1974
6437 W 82nd St, Burbank, IL 60459
$-594
Cash flow
-7.8%
Cash-on-Cash Return
3.9%
Cap rate
0.7%
Rent to Value Ratio
Active
$384,900
4
bds
|
4
ba
|
1,964
sqft
|
built
1962
6052 W 128th St, Palos Heights, IL 60463
$-267
Cash flow
-3.6%
Cash-on-Cash Return
4.8%
Cap rate
0.8%
Rent to Value Ratio

Active
$465,000
3
bds
|
2
ba
|
1,385
sqft
|
built
1967
1164 NW 45th Ter, Lauderhill, FL 33313
$-1,100
Cash flow
-12.3%
Cash-on-Cash Return
3.3%
Cap rate
0.6%
Rent to Value Ratio

Active
$1,324,900
4
bds
|
3
ba
|
3,610
sqft
|
built
2006
9668 Ginger Ct, Parkland, FL 33076
$-3,661
Cash flow
-14.4%
Cash-on-Cash Return
2.8%
Cap rate
0.7%
Rent to Value Ratio

Active
$200,000
3
bds
|
3
ba
|
1,892
sqft
|
built
1988
2218 Lowtrail Ct, Lithonia, GA 30058
$-165
Cash flow
-4.3%
Cash-on-Cash Return
5.2%
Cap rate
0.9%
Rent to Value Ratio

Active
$285,000
4
bds
|
3
ba
|
1,368
sqft
|
built
1986
3440 Quinn Ridge Dr, Snellville, GA 30039
$-559
Cash flow
-10.2%
Cash-on-Cash Return
3.8%
Cap rate
0.6%
Rent to Value Ratio

Active
$325,000
3
bds
|
2.5
ba
|
0
sqft
|
built
1973
4960 Meadow Ln, Marietta, GA 30068
$-443
Cash flow
-7.1%
Cash-on-Cash Return
4.5%
Cap rate
0.8%
Rent to Value Ratio

Active
$619,500
4
bds
|
3
ba
|
2,512
sqft
|
built
2000
754 NW 126th Ave, Coral Springs, FL 33071
$-1,474
Cash flow
-12.4%
Cash-on-Cash Return
3.3%
Cap rate
0.7%
Rent to Value Ratio

Active
$39,999,999
6
bds
|
9
ba
|
9,995
sqft
|
built
2020
516 Mola Ave, Fort Lauderdale, FL 33301
$-214,634
Cash flow
-28.0%
Cash-on-Cash Return
-0.3%
Cap rate
0.0%
Rent to Value Ratio
Active
$489,000
4
bds
|
3
ba
|
2,345
sqft
|
built
1926
809 37th St, West Palm Beach, FL 33407
$-505
Cash flow
-5.4%
Cash-on-Cash Return
4.9%
Cap rate
0.7%
Rent to Value Ratio
Active
$549,500
3
bds
|
3
ba
|
1,715
sqft
|
built
1952
1865 Briarlake Cir, Decatur, GA 30033
$-1,255
Cash flow
-11.9%
Cash-on-Cash Return
3.4%
Cap rate
0.6%
Rent to Value Ratio

Active
$599,900
4
bds
|
2
ba
|
2,276
sqft
|
built
1923
4536 Grand Ave S, Minneapolis, MN 55419
$-1,811
Cash flow
-15.8%
Cash-on-Cash Return
2.1%
Cap rate
0.4%
Rent to Value Ratio

Active
$789,000
4
bds
|
4
ba
|
2,559
sqft
|
built
1983
769 Edgell Rd, Framingham, MA 01701
$-1,340
Cash flow
-8.9%
Cash-on-Cash Return
3.6%
Cap rate
0.6%
Rent to Value Ratio

Active
$599,000
4
bds
|
2
ba
|
1,508
sqft
|
built
1924
3 Highland Park Ave, Hudson, MA 01749
$-598
Cash flow
-5.2%
Cash-on-Cash Return
4.5%
Cap rate
0.7%
Rent to Value Ratio

Active
$799,000
3
bds
|
2
ba
|
1,728
sqft
|
built
1775
1282 Old Post Rd, Ulster Park, NY 12487
$-2,631
Cash flow
-17.2%
Cash-on-Cash Return
2.1%
Cap rate
0.4%
Rent to Value Ratio

Active
$419,500
4
bds
|
3
ba
|
3,850
sqft
|
built
1992
727 Tanbark Dr, Dimondale, MI 48821
$-690
Cash flow
-8.6%
Cash-on-Cash Return
3.7%
Cap rate
0.6%
Rent to Value Ratio

Active
$489,900
3
bds
|
3
ba
|
1,358
sqft
|
built
1920
563 Eustis St, Saint Paul, MN 55104
$-1,040
Cash flow
-11.1%
Cash-on-Cash Return
3.1%
Cap rate
0.5%
Rent to Value Ratio

Active
$369,000
5
bds
|
4
ba
|
3,212
sqft
|
built
1949
3480 Hogan Rd SW, Atlanta, GA 30331
$-13,110
Cash flow
-185.4%
Cash-on-Cash Return
-36.5%
Cap rate
0.4%
Rent to Value Ratio
Active
$300,000
3
bds
|
3
ba
|
1,672
sqft
|
built
1973
1925 Georgetown Ln, Hoffman Estates, IL 60169
$-354
Cash flow
-6.2%
Cash-on-Cash Return
4.3%
Cap rate
0.8%
Rent to Value Ratio