United States Investment Properties for Sale
Browse homes for sale and investment properties in United States. Refine your search by price, property type, or more.
Best cash flowing properties in United States
Active
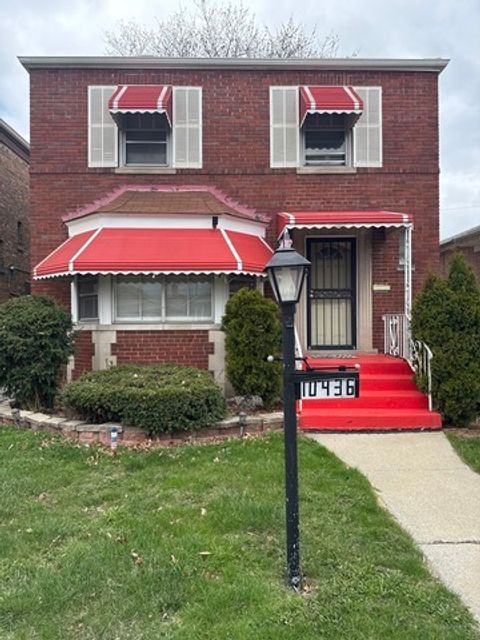
$139,999
3
bds
|
2
ba
|
3,750
sqft
|
built
1950
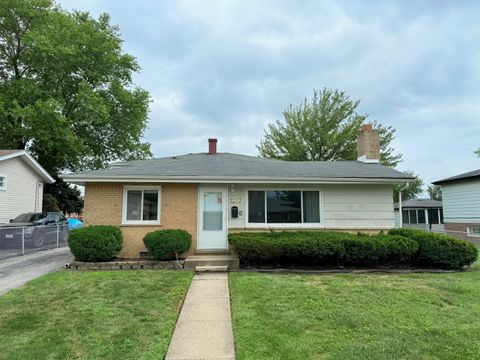
10436 S Calumet Ave, Chicago, IL 60628
$702
Cash flow
26.2%
Cash-on-Cash Return
11.7%
Cap rate
1.6%
Rent to Value Ratio

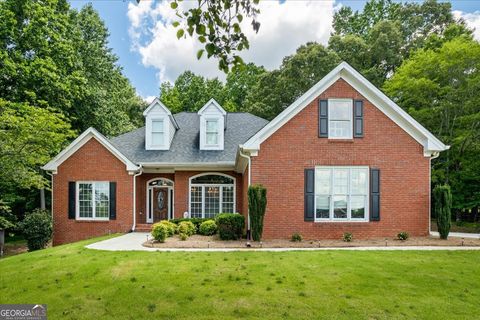
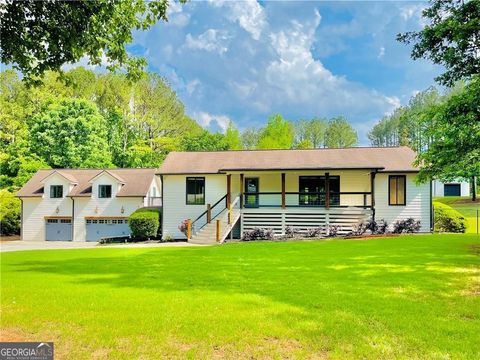
Active
$154,900
3
bds
|
2
ba
|
1,712
sqft
|
built
1960
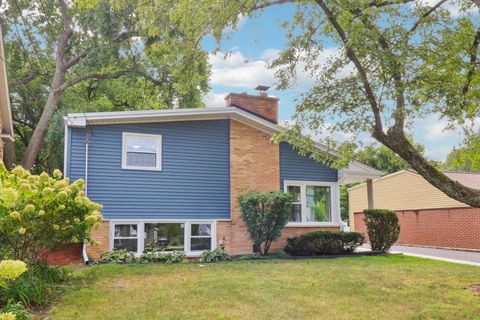
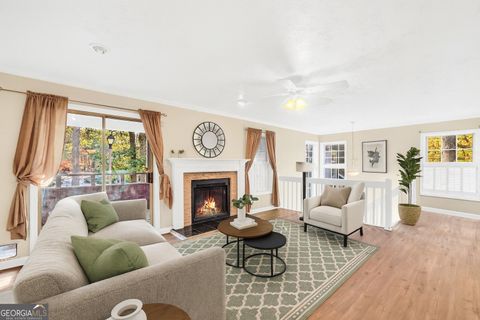
7205 Lakeview Dr SW, Covington, GA 30014
$172
Cash flow
5.8%
Cash-on-Cash Return
7.5%
Cap rate
1.0%
Rent to Value Ratio
10,000 out of 310,643 properties for sale in United States
Limited Results Shown
Create a free account, or log in to reveal all property listings and enjoy the complete experience.

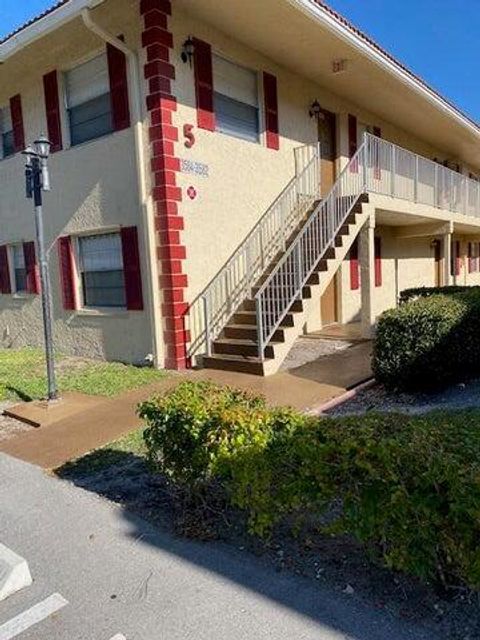
Active
$165,000
1
bds
|
2
ba
|
920
sqft
|
built
1960
3600 N Lake Shore Dr, Chicago, IL 60613
$-122
Cash flow
-3.9%
Cash-on-Cash Return
4.8%
Cap rate
1.5%
Rent to Value Ratio

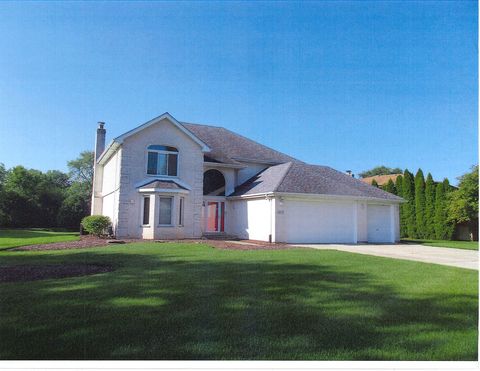
Active
$180,000
1
bds
|
1
ba
|
1,000
sqft
|
built
1974
8916 Kenneth Dr, Des Plaines, IL 60016
$-311
Cash flow
-9.0%
Cash-on-Cash Return
3.6%
Cap rate
0.8%
Rent to Value Ratio

Active
$229,900
2
bds
|
2
ba
|
1,131
sqft
|
built
1973
6545 Main St, Downers Grove, IL 60516
$-132
Cash flow
-3.0%
Cash-on-Cash Return
5.0%
Cap rate
1.0%
Rent to Value Ratio

Active
$179,600
4
bds
|
0
ba
|
2,520
sqft
|
built
2020
103 Saint Martin Ave, San Antonio, TX 78202
$-453
Cash flow
-13.2%
Cash-on-Cash Return
2.7%
Cap rate
0.8%
Rent to Value Ratio
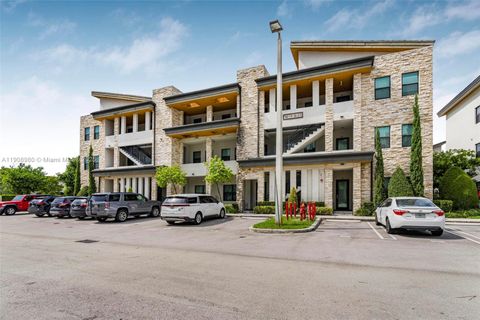
Active
$189,900
2
bds
|
2
ba
|
809
sqft
|
built
1982
3566 N University Dr, Coral Springs, FL 33065
$-577
Cash flow
-15.9%
Cash-on-Cash Return
2.5%
Cap rate
0.9%
Rent to Value Ratio

Active
$2,495,000
6
bds
|
5
ba
|
2,612
sqft
|
built
1942
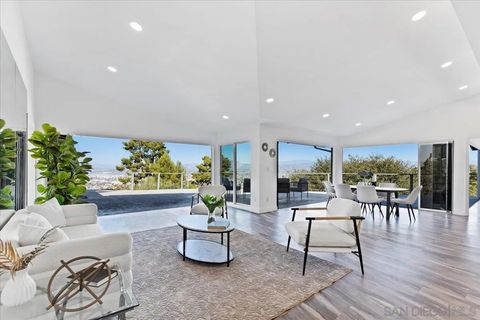
2945 B St, San Diego, CA 92102
$-8,771
Cash flow
-18.3%
Cash-on-Cash Return
1.5%
Cap rate
0.2%
Rent to Value Ratio
Active
$417,000
4
bds
|
2.5
ba
|
4,769
sqft
|
built
1997
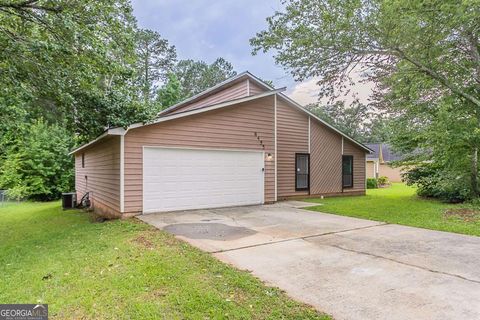
40 Costleys Bridge Dr, Oxford, GA 30054
$-513
Cash flow
-6.4%
Cash-on-Cash Return
4.7%
Cap rate
0.7%
Rent to Value Ratio

Active
$499,000
2
bds
|
2
ba
|
1,137
sqft
|
built
1900
34 Tremont St, Chelsea, MA 02150
$-1,113
Cash flow
-11.6%
Cash-on-Cash Return
3.0%
Cap rate
0.6%
Rent to Value Ratio

Active
$422,000
4
bds
|
3
ba
|
2,025
sqft
|
built
1987
567 Lakewood Dr S, Maplewood, MN 55119
$-496
Cash flow
-6.1%
Cash-on-Cash Return
4.3%
Cap rate
0.7%
Rent to Value Ratio

Active
$489,000
5
bds
|
4
ba
|
2,806
sqft
|
built
1980
5105 Balsam Ln N, Plymouth, MN 55442
$-510
Cash flow
-5.4%
Cash-on-Cash Return
4.4%
Cap rate
0.7%
Rent to Value Ratio

Active
$659,900
4
bds
|
3
ba
|
2,810
sqft
|
built
2023
20105 Glenbrook Path, Lakeville, MN 55044
$-587
Cash flow
-4.6%
Cash-on-Cash Return
4.6%
Cap rate
0.6%
Rent to Value Ratio

Active
$1,075,000
4
bds
|
3
ba
|
2,435
sqft
|
built
1981
2010 Palsero Ave, Escondido, CA 92029
$-1,706
Cash flow
-8.3%
Cash-on-Cash Return
3.8%
Cap rate
0.5%
Rent to Value Ratio

Active
$1,100,000
7
bds
|
4
ba
|
0
sqft
|
built
1914
929 N Rowan Ave, Los Angeles, CA 90063
$-3,274
Cash flow
-15.5%
Cash-on-Cash Return
2.1%
Cap rate
0.3%
Rent to Value Ratio

Active
$185,000
1
bds
|
1
ba
|
0
sqft
|
built
2004
400 17th St NW, Atlanta, GA 30363
$-245
Cash flow
-6.9%
Cash-on-Cash Return
4.6%
Cap rate
1.1%
Rent to Value Ratio
Active
$669,900
4
bds
|
3
ba
|
3,014
sqft
|
built
1993
13735 W Meath Dr, Homer Glen, IL 60491
$-928
Cash flow
-7.2%
Cash-on-Cash Return
4.0%
Cap rate
0.7%
Rent to Value Ratio
Active
$187,000
3
bds
|
2
ba
|
1,050
sqft
|
built
1963
1287 Arthur St, Calumet City, IL 60409
$-192
Cash flow
-5.4%
Cash-on-Cash Return
4.4%
Cap rate
1.1%
Rent to Value Ratio
Active
$579,900
3
bds
|
2
ba
|
1,806
sqft
|
built
1957
333 Elm St, Glen Ellyn, IL 60137
$-1,387
Cash flow
-12.5%
Cash-on-Cash Return
2.8%
Cap rate
0.5%
Rent to Value Ratio
Active
$218,000
3
bds
|
2
ba
|
1,575
sqft
|
built
1989
8455 Cedar Creek Rdg, Riverdale, GA 30274
$-185
Cash flow
-4.4%
Cash-on-Cash Return
5.1%
Cap rate
0.8%
Rent to Value Ratio

Active
$169,000
3
bds
|
1.5
ba
|
1,160
sqft
|
built
1945
2817 Burton Rd NW, Atlanta, GA 30311
$55
Cash flow
1.7%
Cash-on-Cash Return
6.5%
Cap rate
1.1%
Rent to Value Ratio
Active
$780,000
4
bds
|
2
ba
|
2,086
sqft
|
built
1993
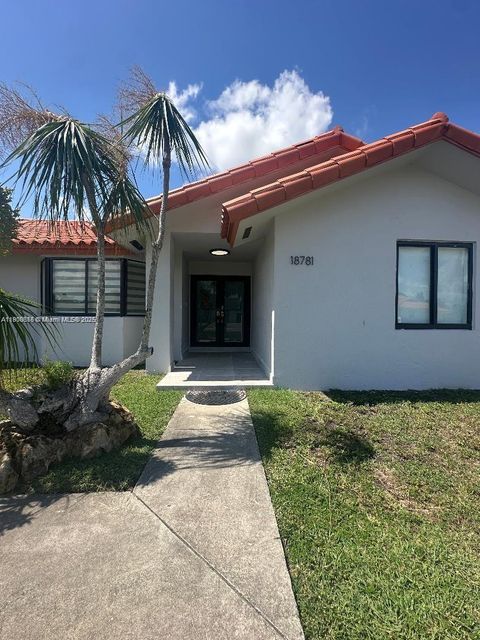
18781 SW 294th Ter, Homestead, FL 33030
$-1,614
Cash flow
-10.8%
Cash-on-Cash Return
3.7%
Cap rate
0.6%
Rent to Value Ratio

Active
$179,990
4
bds
|
3
ba
|
1,825
sqft
|
built
1930
5303 W 57th St, Little Rock, AR 72209
$-63
Cash flow
-1.8%
Cash-on-Cash Return
5.3%
Cap rate
0.7%
Rent to Value Ratio
Active
$535,000
3
bds
|
3
ba
|
2,328
sqft
|
built
2001
14071 Shimmering Lake Ct, Fort Myers, FL 33907
$-1,017
Cash flow
-9.9%
Cash-on-Cash Return
3.9%
Cap rate
0.7%
Rent to Value Ratio
Active
$232,900
2
bds
|
1
ba
|
1,216
sqft
|
built
1984
1482 N Crossing Cir NE, Atlanta, GA 30329
$-558
Cash flow
-12.5%
Cash-on-Cash Return
3.3%
Cap rate
0.9%
Rent to Value Ratio

Active
$439,900
5
bds
|
4
ba
|
3,143
sqft
|
built
2017
2933 Countryside Path, Seguin, TX 78155
$-699
Cash flow
-8.3%
Cash-on-Cash Return
3.8%
Cap rate
0.7%
Rent to Value Ratio
Active
$819,000
2
bds
|
2
ba
|
1,904
sqft
|
built
1979
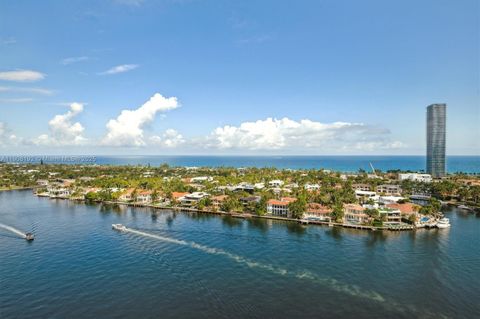
19707 Turnberry Way, Aventura, FL 33180
$-2,342
Cash flow
-14.9%
Cash-on-Cash Return
2.7%
Cap rate
0.9%
Rent to Value Ratio
Active
$263,000
2
bds
|
2
ba
|
1,245
sqft
|
built
2022
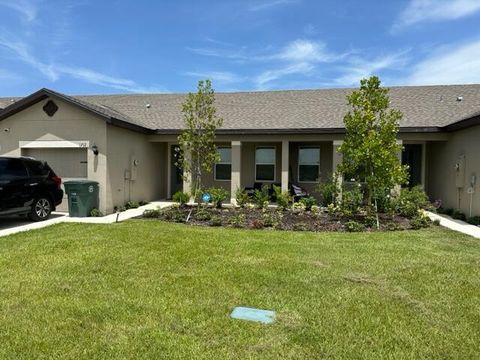
1712 Celebration Dr, Fort Pierce, FL 34947
$-431
Cash flow
-8.6%
Cash-on-Cash Return
4.2%
Cap rate
0.8%
Rent to Value Ratio

Active
$1,150,000
6
bds
|
6
ba
|
6,437
sqft
|
built
2006
217 Heritage Town Pkwy, Canton, GA 30115
$-3,535
Cash flow
-16.0%
Cash-on-Cash Return
2.5%
Cap rate
0.4%
Rent to Value Ratio
Active
$1,595,000
4
bds
|
2
ba
|
2,095
sqft
|
built
1958
5030 Helix Ter, La Mesa, CA 91941
$-4,512
Cash flow
-14.8%
Cash-on-Cash Return
2.3%
Cap rate
0.3%
Rent to Value Ratio

Active
$799,900
4
bds
|
3.5
ba
|
2,838
sqft
|
built
2007
460 Vanderbilt Pkwy, Newnan, GA 30265
$-2,454
Cash flow
-16.0%
Cash-on-Cash Return
2.5%
Cap rate
0.4%
Rent to Value Ratio

Active
$499,999
7
bds
|
3
ba
|
0
sqft
|
built
1930
5010 Harold Ave, Schiller Park, IL 60176
$-2,536
Cash flow
-26.5%
Cash-on-Cash Return
-0.4%
Cap rate
0.4%
Rent to Value Ratio

Active
$399,000
3
bds
|
2
ba
|
2,389
sqft
|
built
1978
1472 Cedar Ridge Rd, Marietta, GA 30066
$-432
Cash flow
-5.6%
Cash-on-Cash Return
4.8%
Cap rate
0.6%
Rent to Value Ratio
Active
$389,000
2
bds
|
2
ba
|
1,048
sqft
|
built
2016
7865 NW 104th Ave, Doral, FL 33178
$-1,518
Cash flow
-20.4%
Cash-on-Cash Return
1.5%
Cap rate
0.7%
Rent to Value Ratio
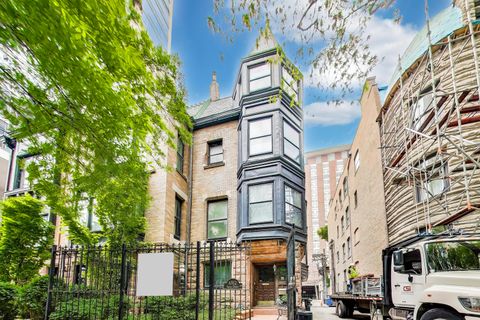
Active
$1,499,000
5
bds
|
4
ba
|
5,991
sqft
|
built
1887
1312 N Astor St, Chicago, IL 60610
$-3,320
Cash flow
-11.6%
Cash-on-Cash Return
3.0%
Cap rate
0.7%
Rent to Value Ratio

Active
$309,900
2
bds
|
2
ba
|
1,800
sqft
|
built
1985
15262 S 74th Ave, Orland Park, IL 60462
$-492
Cash flow
-8.3%
Cash-on-Cash Return
3.8%
Cap rate
0.8%
Rent to Value Ratio

Active
$415,000
4
bds
|
4
ba
|
0
sqft
|
built
2011
6460 Bellevue Dr SW, Conyers, GA 30094
$-826
Cash flow
-10.4%
Cash-on-Cash Return
3.8%
Cap rate
0.6%
Rent to Value Ratio

Active
$325,000
4
bds
|
2.5
ba
|
0
sqft
|
built
2004
2966 Fairton Trl, Lithonia, GA 30038
$-455
Cash flow
-7.3%
Cash-on-Cash Return
4.5%
Cap rate
0.7%
Rent to Value Ratio
Active
$899,000
5
bds
|
4.5
ba
|
4,200
sqft
|
built
1993
345 Etheridge Rd, Auburn, GA 30011
$-2,824
Cash flow
-16.4%
Cash-on-Cash Return
2.4%
Cap rate
0.4%
Rent to Value Ratio
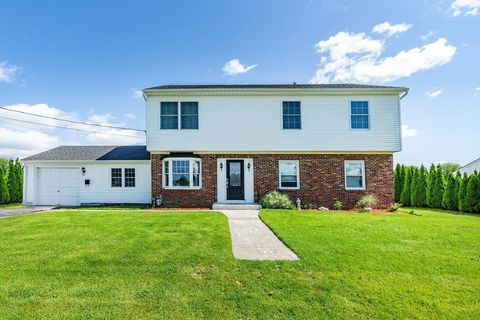
Active
$549,900
4
bds
|
3
ba
|
2,172
sqft
|
built
1966
74 Brookhaven Dr, East Providence, RI 02914
$-948
Cash flow
-9.0%
Cash-on-Cash Return
3.6%
Cap rate
0.6%
Rent to Value Ratio